رینبو آسکیلیٹر بیک ٹیسٹنگ کی حکمت عملی
جائزہ
رینبو شوبرسٹر ریٹرننگ اسٹریٹجی ایک ایسی حکمت عملی ہے جو رینبو شوبرسٹر اشارے پر مبنی ایک مقداری تجارتی حکمت عملی ہے۔ اس حکمت عملی میں اسٹاک کی قیمت اور اوسط کے مابین انحراف کی مقدار کا حساب کتاب کرکے مارکیٹ کے رجحان کی سمت اور طاقت کا اندازہ لگایا جاتا ہے ، جس سے طویل اور مختصر پوزیشن کی سمت کا فیصلہ کیا جاسکتا ہے۔
حکمت عملی کا اصول
اس حکمت عملی کا بنیادی اشارے رینبو اوسیلیٹر (RO) ہے جس کا حساب کتاب اس طرح ہے:
RO = 100 * ((收盘价 - 10日移动平均线) / (最高价的最高值 - 最低价的最低值))
اس میں 10 دن کی متحرک اوسط 10 دوروں کی اختتامی قیمتوں کی ایک سادہ متحرک اوسط ہے۔ یہ اشارے قیمتوں کے اپنے اوسط سے انحراف کی عکاسی کرتا ہے۔ جب آر او > 0 ہوتا ہے تو ، قیمت اوسط سے اوپر ہوتی ہے تو ، یہ ایک مثبت سگنل ہوتا ہے۔ جب آر او < 0 ہوتا ہے تو ، قیمت اوسط سے نیچے ہوتی ہے تو ، یہ ایک منفی سگنل ہوتا ہے۔
اس حکمت عملی میں ایک معاون اشارے ، بینڈوڈتھ (RB) کا بھی حساب لگایا گیا ہے ، جس کا حساب کتاب اس طرح ہے:
RB = 100 * ((均线的最高值 - 均线的最低值) / (最高价的最高值 - 最低价的最低值))
آر بی اوسط لائنوں کے مابین چوڑائی کی عکاسی کرتا ہے۔ آر بی جتنا بڑا ہوتا ہے ، قیمتوں میں زیادہ اتار چڑھاؤ ہوتا ہے ، اور اس کے برعکس ، قیمت مستحکم ہے۔ آر بی اشارے کا استعمال مارکیٹ میں استحکام کی سطح کا اندازہ لگانے کے لئے کیا جاسکتا ہے۔
یہ حکمت عملی آر او اور آر بی اشارے کی قدر کی بنیاد پر قیمتوں کے انحراف اور مارکیٹ کی استحکام کا اندازہ کرتی ہے ، جس سے طویل اور مختصر پوزیشنوں کے لئے تجارتی سگنل پیدا ہوتے ہیں۔
اسٹریٹجک فوائد
یہ حکمت عملی مندرجہ ذیل فوائد رکھتی ہے:
- دوپٹہ معیار کی بنیاد پر فیصلہ کرنے سے ، ایک ہی معیار کے فیصلے کی حدود سے بچا جاتا ہے۔
- قیمتوں کی تبدیلی اور مارکیٹ کے استحکام کا اندازہ لگانا۔
- حساب کتاب سادہ، سمجھنے میں آسان اور قابل عمل ہے۔
- یہ اشارے بصری شکل میں بنائے گئے ہیں تاکہ رنگ برنگے رنگ کے اثرات پیدا ہوں اور آسانی سے پڑھے جاسکیں۔
اسٹریٹجک رسک
اس حکمت عملی کے کچھ خطرات بھی ہیں:
- RO اور RB اشارے پیرامیٹرز کی غلط ترتیب سے ٹریڈنگ سگنل کی غلطی ہوسکتی ہے۔
- دو لائنوں کی حکمت عملی غلط سگنل اور بار بار تجارت کا باعث بنتی ہے۔
- اس کے نتیجے میں ، اس کی وجہ سے ، اس کی وجہ سے ، اس کی وجہ سے ، اس کی وجہ سے ، اس کی وجہ سے ، اس کی وجہ سے ، اس کی وجہ سے۔
- اس کے علاوہ ، یہ بھی کہا گیا ہے کہ یہ ایک بہت ہی کم لاگت والا ٹرانزیکشن ہے ، جس کی وجہ سے آپ کو زیادہ سے زیادہ رقم ملتی ہے۔
ردعمل:
- آر او اور آر بی کے اشارے کو بہتر بنانے کے پیرامیٹرز۔
- زیادہ سے زیادہ تجارت کو روکنے کے لئے فلٹرنگ کی شرائط شامل کریں.
- مناسب ریٹرننگ سائیکل اور قسم کا انتخاب کریں۔
- ٹرانزیکشن لاگت کا حساب لگائیں اور اس پر غور کریں۔
حکمت عملی کی اصلاح
اس حکمت عملی کو مندرجہ ذیل پہلوؤں سے بہتر بنایا جاسکتا ہے:
- رو اشارے پر Smooth فنکشن شامل کریں تاکہ اشارے میں شدید اتار چڑھاو سے بچا جا سکے۔
- اسٹاپ نقصان کی حکمت عملی میں شامل ہوں اور انفرادی نقصانات پر قابو پالیں۔
- دوسرے اشارے کے ساتھ مل کر پورٹیج ٹریڈنگ ، منافع کی امکانات کو بہتر بنانا۔
- مشین لرننگ ماڈل کو پیش گوئی کرنے کے لئے شامل کریں تاکہ اس کی پیمائش کی جا سکے۔
- مختلف اقسام کے پیرامیٹرز کے لئے اصلاح اور موافقت کو بہتر بنانا۔
خلاصہ کریں۔
قوس قزح کے جھٹکا دینے والے کی واپسی کی حکمت عملی ، قیمت اور اوسط کے مابین انحراف کے تعلقات کا حساب کتاب کرکے ، مارکیٹ کے رجحانات اور استحکام کا اندازہ لگاتا ہے ، تاکہ طویل اور قلیل پوزیشنوں میں تجارت کی جاسکے۔ یہ حکمت عملی بصری ، آسان پڑھنے ، آسان عمل درآمد ، اور کچھ عملی قدر رکھتی ہے۔ لیکن اس میں کچھ خطرات بھی ہیں ، جن کو پیرامیٹرز اور تجارتی قواعد کے ل optim بہتر بنانے کی ضرورت ہے ، خطرے کو کم کرنے اور عملی اثر کو بڑھانے کے لئے۔
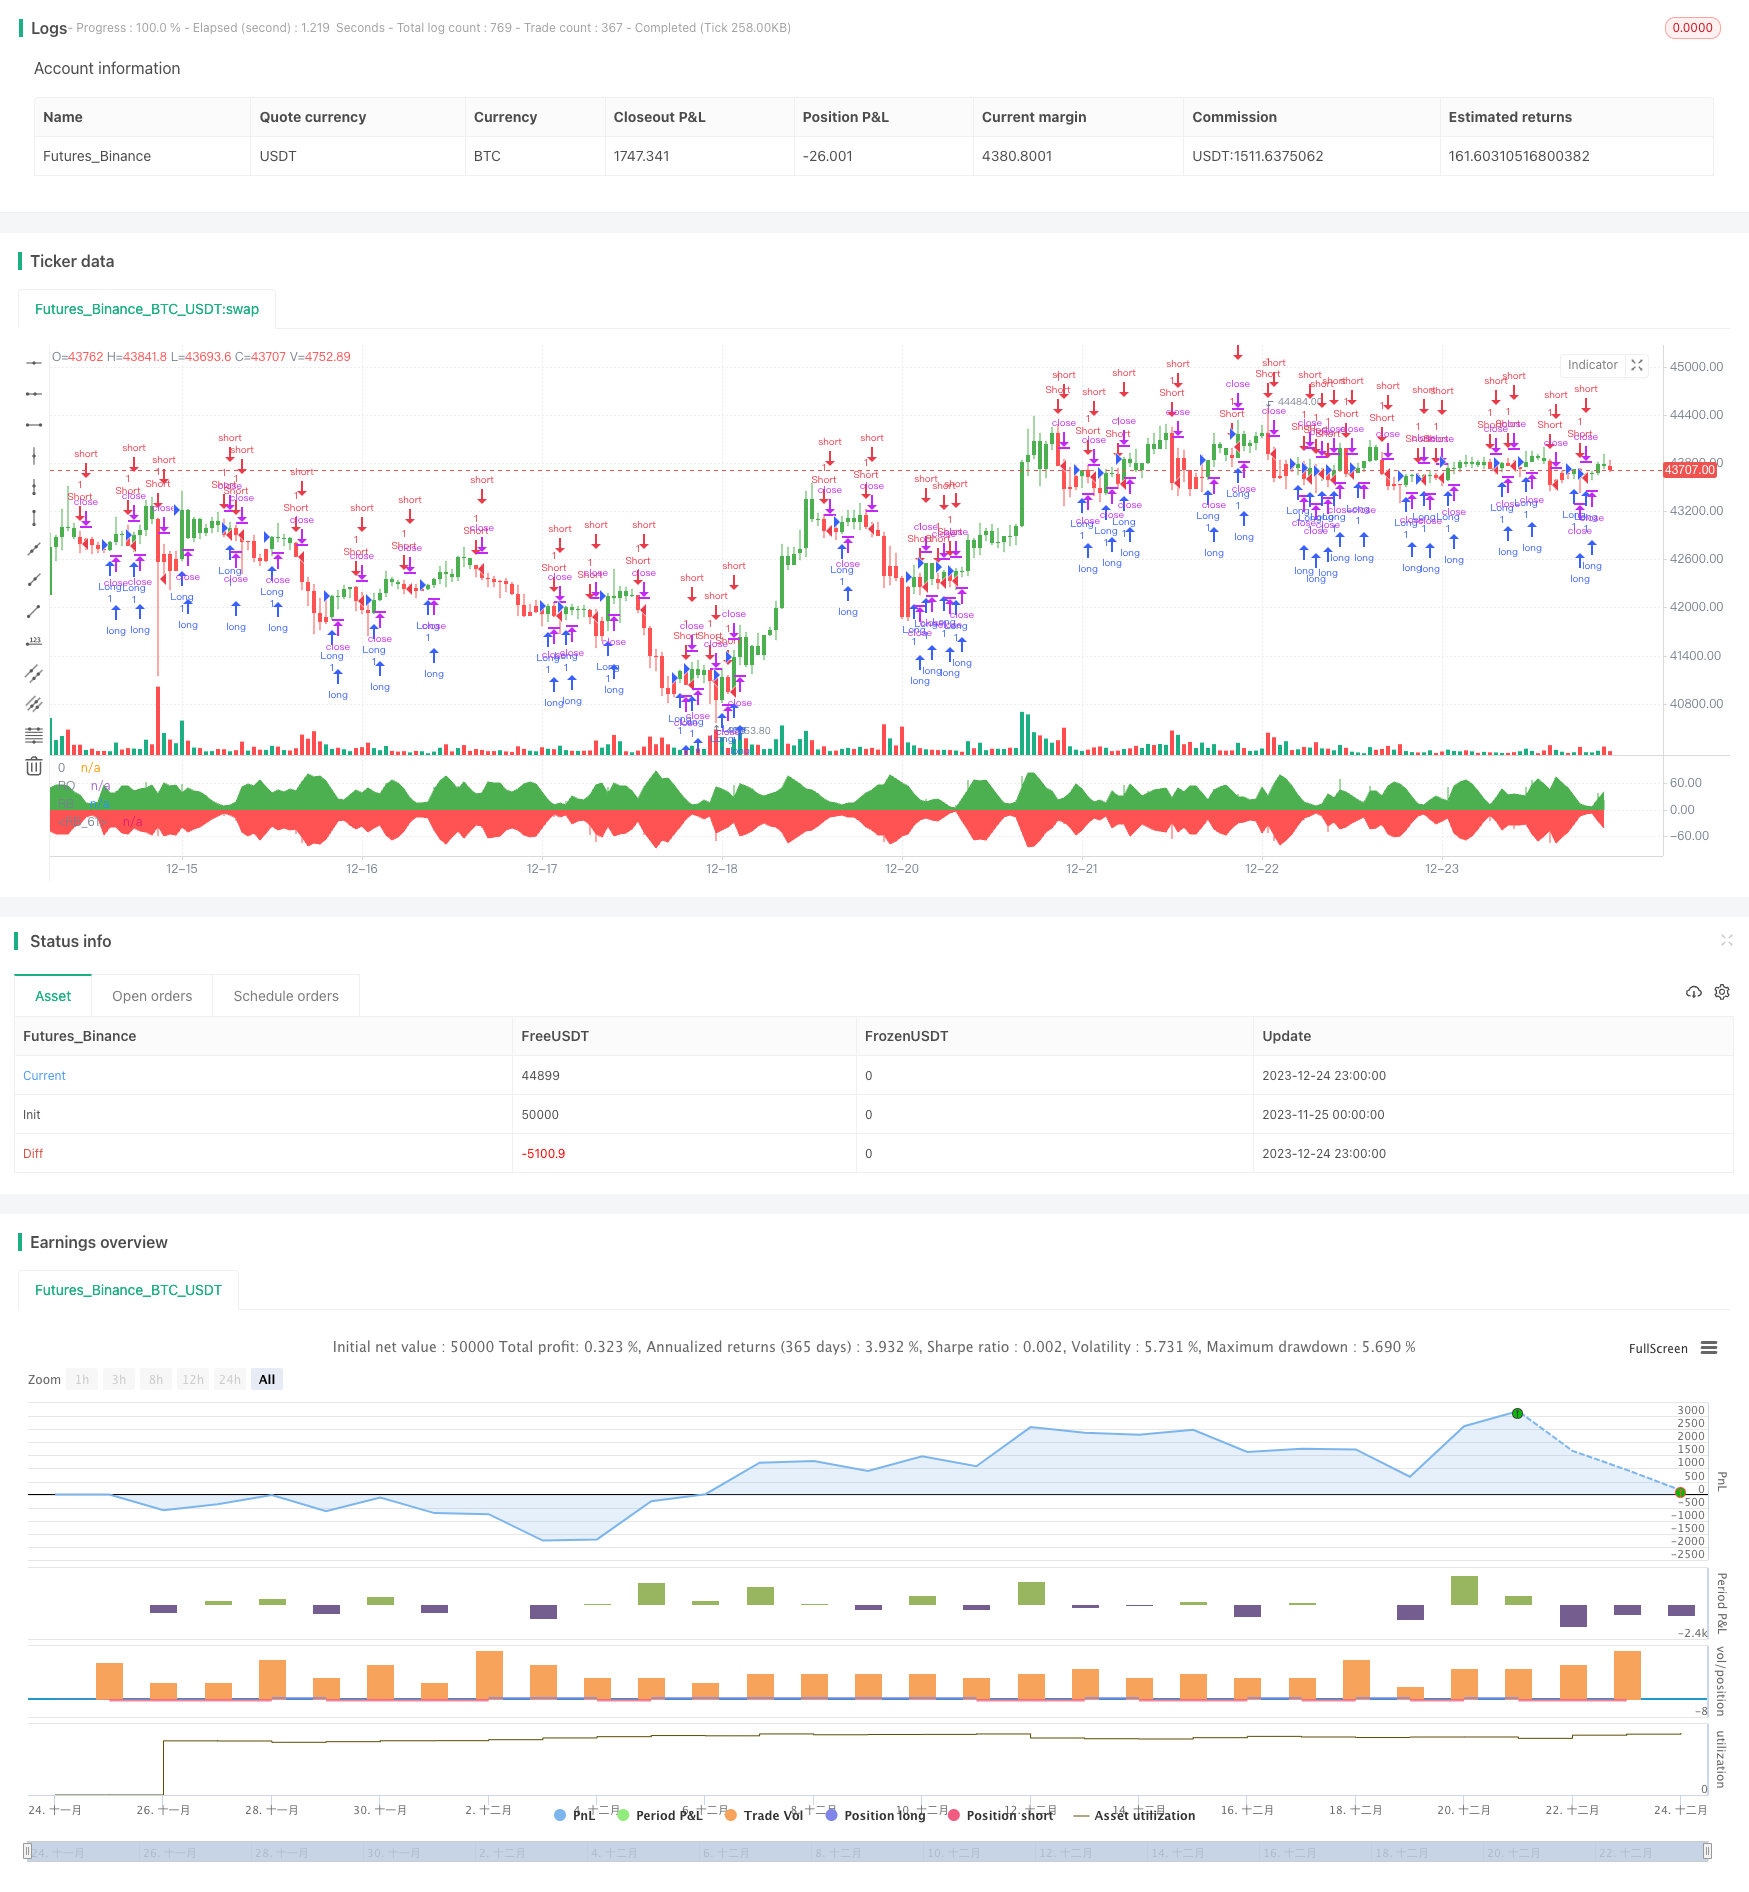
/*backtest
start: 2023-11-25 00:00:00
end: 2023-12-25 00:00:00
period: 1h
basePeriod: 15m
exchanges: [{"eid":"Futures_Binance","currency":"BTC_USDT"}]
*/

//@version=2
////////////////////////////////////////////////////////////
//  Copyright by HPotter v1.0 18/03/2018
// Ever since the people concluded that stock market price movements are not
// random or chaotic, but follow specific trends that can be forecasted, they
// tried to develop different tools or procedures that could help them identify
// those trends. And one of those financial indicators is the Rainbow Oscillator
// Indicator. The Rainbow Oscillator Indicator is relatively new, originally
// introduced in 1997, and it is used to forecast the changes of trend direction.
//
// As market prices go up and down, the oscillator appears as a direction of the
// trend, but also as the safety of the market and the depth of that trend. As
// the rainbow grows in width, the current trend gives signs of continuity, and
// if the value of the oscillator goes beyond 80, the market becomes more and more
// unstable, being prone to a sudden reversal. When prices move towards the rainbow
// and the oscillator becomes more and more flat, the market tends to remain more
// stable and the bandwidth decreases. Still, if the oscillator value goes below 20,
// the market is again, prone to sudden reversals. The safest bandwidth value where
// the market is stable is between 20 and 80, in the Rainbow Oscillator indicator value.
// The depth a certain price has on a chart and into the rainbow can be used to judge
// the strength of the move.
//
// You can change long to short in the Input Settings
// WARNING:
//  - For purpose educate only
//  - This script to change bars colors.
////////////////////////////////////////////////////////////
strategy(title="Rainbow Oscillator Backtest")
Length = input(2, minval=1)
LengthHHLL = input(10, minval=2, title="HHV/LLV Lookback")
reverse = input(false, title="Trade reverse")
xMA1 = sma(close, Length)
xMA2 = sma(xMA1, Length)
xMA3 = sma(xMA2, Length)
xMA4 = sma(xMA3, Length)
xMA5 = sma(xMA4, Length)
xMA6 = sma(xMA5, Length)
xMA7 = sma(xMA6, Length)
xMA8 = sma(xMA7, Length)
xMA9 = sma(xMA8, Length)
xMA10 = sma(xMA9, Length)
xHH = highest(close, LengthHHLL)
xLL = lowest(close, LengthHHLL)
xHHMAs = max(xMA1,max(xMA2,max(xMA3,max(xMA4,max(xMA5,max(xMA6,max(xMA7,max(xMA8,max(xMA9,xMA10)))))))))
xLLMAs = min(xMA1,min(xMA2,min(xMA3,min(xMA4,min(xMA5,min(xMA6,min(xMA7,min(xMA8,min(xMA9,xMA10)))))))))
xRBO = 100 * ((close - ((xMA1+xMA2+xMA3+xMA4+xMA5+xMA6+xMA7+xMA8+xMA9+xMA10) / 10)) / (xHH - xLL))
xRB = 100 * ((xHHMAs - xLLMAs) / (xHH - xLL))
clr = iff(xRBO >= 0, green, red)
pos = iff(xRBO > 0, 1,
       iff(xRBO < 0, -1, nz(pos[1], 0)))
possig = iff(reverse and pos == 1, -1,
          iff(reverse and pos == -1, 1, pos))
if (possig == 1)
    strategy.entry("Long", strategy.long)
if (possig == -1)
    strategy.entry("Short", strategy.short)
barcolor(possig == -1 ? red: possig == 1 ? green : blue )
plot(xRBO, color=clr, title="RO", style= histogram, linewidth=2)
p0 = plot(0, color = gray, title="0")
p1 = plot(xRB, color=green, title="RB")
p2 = plot(-xRB, color=red, title="RB")
fill(p1, p0, color=green)
fill(p2, p0, color=red)