سپر ٹرینڈ کی پیروی کی حکمت عملی
جائزہ
یہ حکمت عملی ایک ٹریکنگ قسم کی سپر ٹرینڈ حکمت عملی ہے ، جس کا بنیادی خیال یہ ہے کہ مختلف پیرامیٹرز کی ترتیب کے ساتھ مل کر سپر ٹرینڈ اشارے کو ٹریکنگ کے اثر کو حاصل کرنے کے لئے استعمال کیا جائے ، اور فلٹر اشارے کو خطرہ کنٹرول کے لئے استعمال کیا جائے۔ حکمت عملی کا بنیادی خیال آسان ، آسان اور ابتدائی سیکھنے کے لئے موزوں ہے۔
حکمت عملی کا اصول
اس حکمت عملی میں بنیادی طور پر سپر ٹرینڈ اشارے کے تین سیٹوں پر مشتمل ہے جن میں مختلف پیرامیٹرز کی ترتیبات ہیں۔ پہلا گروپ مین سپر ٹرینڈ اشارے بنیادی طور پر مارکیٹ کے رجحان کی سمت کا تعین کرنے کے لئے ڈیفالٹ پیرامیٹرز کا استعمال کرتا ہے۔ دوسرا گروپ ذیلی سپر ٹرینڈ اشارے ، اے ٹی آر کے دورانیے کو کم کرکے اور اے ٹی آر کے ضرب کو بڑھا کر ، قیمت میں تبدیلی کو زیادہ حساس طور پر ٹریک کرنے کے لئے۔
جب اہم سپر ٹرینڈ خریدنے کا اشارہ کرتا ہے تو ، اگر ذیلی سپر ٹرینڈ بھی بیک وقت اشارہ کرتا ہے ، اور فلٹر سپر ٹرینڈ کی سمت عروج پر ہے تو ، حکمت عملی ٹریکنگ خرید لیتی ہے۔ جب اہم سپر ٹرینڈ بیچنے کا اشارہ کرتا ہے تو ، اگر ذیلی سپر ٹرینڈ بھی بیک وقت اشارہ کرتا ہے ، اور فلٹر سپر ٹرینڈ کی سمت نیچے کی طرف ہے تو ، حکمت عملی ٹریکنگ فروخت لیتی ہے۔ اس طرح ، اہم رجحان کو پکڑنے کی ضمانت دیتے ہوئے ، ذیلی سپر ٹرینڈ اشارے کا استعمال کرتے ہوئے ٹھیک ٹھیک ایڈجسٹمنٹ کا سراغ لگایا جاسکتا ہے ، جس سے بروقت اندراج اور اسٹاپ نقصان ہوتا ہے۔
اسٹریٹجک فوائد
- حکمت عملی سادہ، واضح اور آسان ہے، ابتدائی سیکھنے کے لئے مناسب
- حکمت عملی کے پیرامیٹرز کو مناسب طریقے سے ترتیب دیا گیا ہے تاکہ حالات کو مؤثر طریقے سے ٹریک کیا جاسکے اور خطرات پر قابو پایا جاسکے
- اسٹریٹجک سگنل زیادہ درست اور قابل اعتماد ہے، جیت کی شرح زیادہ ہے
- مختلف پیرامیٹرز کے مجموعے کے ساتھ ٹریکنگ کے اثرات
- فلٹر میکانزم شامل کیا گیا ہے تاکہ غلط سگنل کو مؤثر طریقے سے فلٹر کیا جاسکے اور خطرات پر قابو پایا جاسکے
اسٹریٹجک رسک
- اسٹاک کا نظاماتی خطرہ
- سپر ٹرینڈ اشارے کچھ مارکیٹوں میں تاخیر کا باعث بن سکتے ہیں
- اے ٹی آر اشارے میں استعمال ہونے والے پیرامیٹرز کی غلط ترتیب سے حکمت عملی کے اشارے میں انحراف ہوسکتا ہے
- اسٹریٹجک ٹریڈنگ کی ناکافی مقدار کے نتیجے میں مکمل طور پر بند کرنے میں دشواری کا سامنا کرنا پڑتا ہے
اہم خطرات سے بچاؤ کے اقدامات:
- اچھی لیکویڈیٹی والے اور زیادہ اتار چڑھاؤ والے اسٹاک کا انتخاب کریں
- پیرامیٹرز کو مناسب طریقے سے بہتر بنائیں تاکہ ممکنہ طور پر تاخیر کو کم کیا جاسکے
- پیرامیٹرز ٹیسٹنگ کو بہتر بنایا گیا ہے تاکہ سگنل کی درستگی کو بہتر بنایا جاسکے
- ٹرانزیکشن حجم کو مناسب طریقے سے بڑھانا تاکہ سٹاپ نقصان کی گنجائش کو یقینی بنایا جا سکے۔
حکمت عملی کی اصلاح کی سمت
- ٹریکنگ کو بہتر بنانے کے لئے مختلف ATR سائیکل پیرامیٹرز کے مجموعے کی جانچ
- اے ٹی آر کے بجائے متغیرات کے دیگر اشارے آزمائیں
- سپر رجحان کے مجموعے کی تعداد میں اضافہ یا کمی ، ٹیسٹ اثر
- سگنل فلٹرنگ کو بہتر بنانے کے لئے دیگر اشارے کے ساتھ کوشش کریں
- نقصان کو روکنے کے مختلف طریقوں کی جانچ اور بہترین حل تلاش کرنا
خلاصہ کریں۔
اس حکمت عملی کا مجموعی نظریہ واضح اور آسان ہے ، مختلف پیرامیٹرز کی ترتیب کے ذریعہ سپر ٹرینڈ کے متعدد اشارے باہمی تعاون کے ساتھ ، داخلے اور خطرے کے کنٹرول کو ٹریک کرنے کے لئے۔ حکمت عملی کے اشارے زیادہ درست ہیں ، بہتر کارکردگی کا مظاہرہ کرتے ہیں ، ابتدائی سیکھنے کے لئے موزوں ہیں ، اور مختلف اشارے اور پیرامیٹرز کی جانچ کی اصلاح کے لئے بطور ٹیمپلیٹ بھی استعمال کیا جاسکتا ہے۔ سپر ٹرینڈ حکمت عملی کی سفارش کی جاتی ہے۔
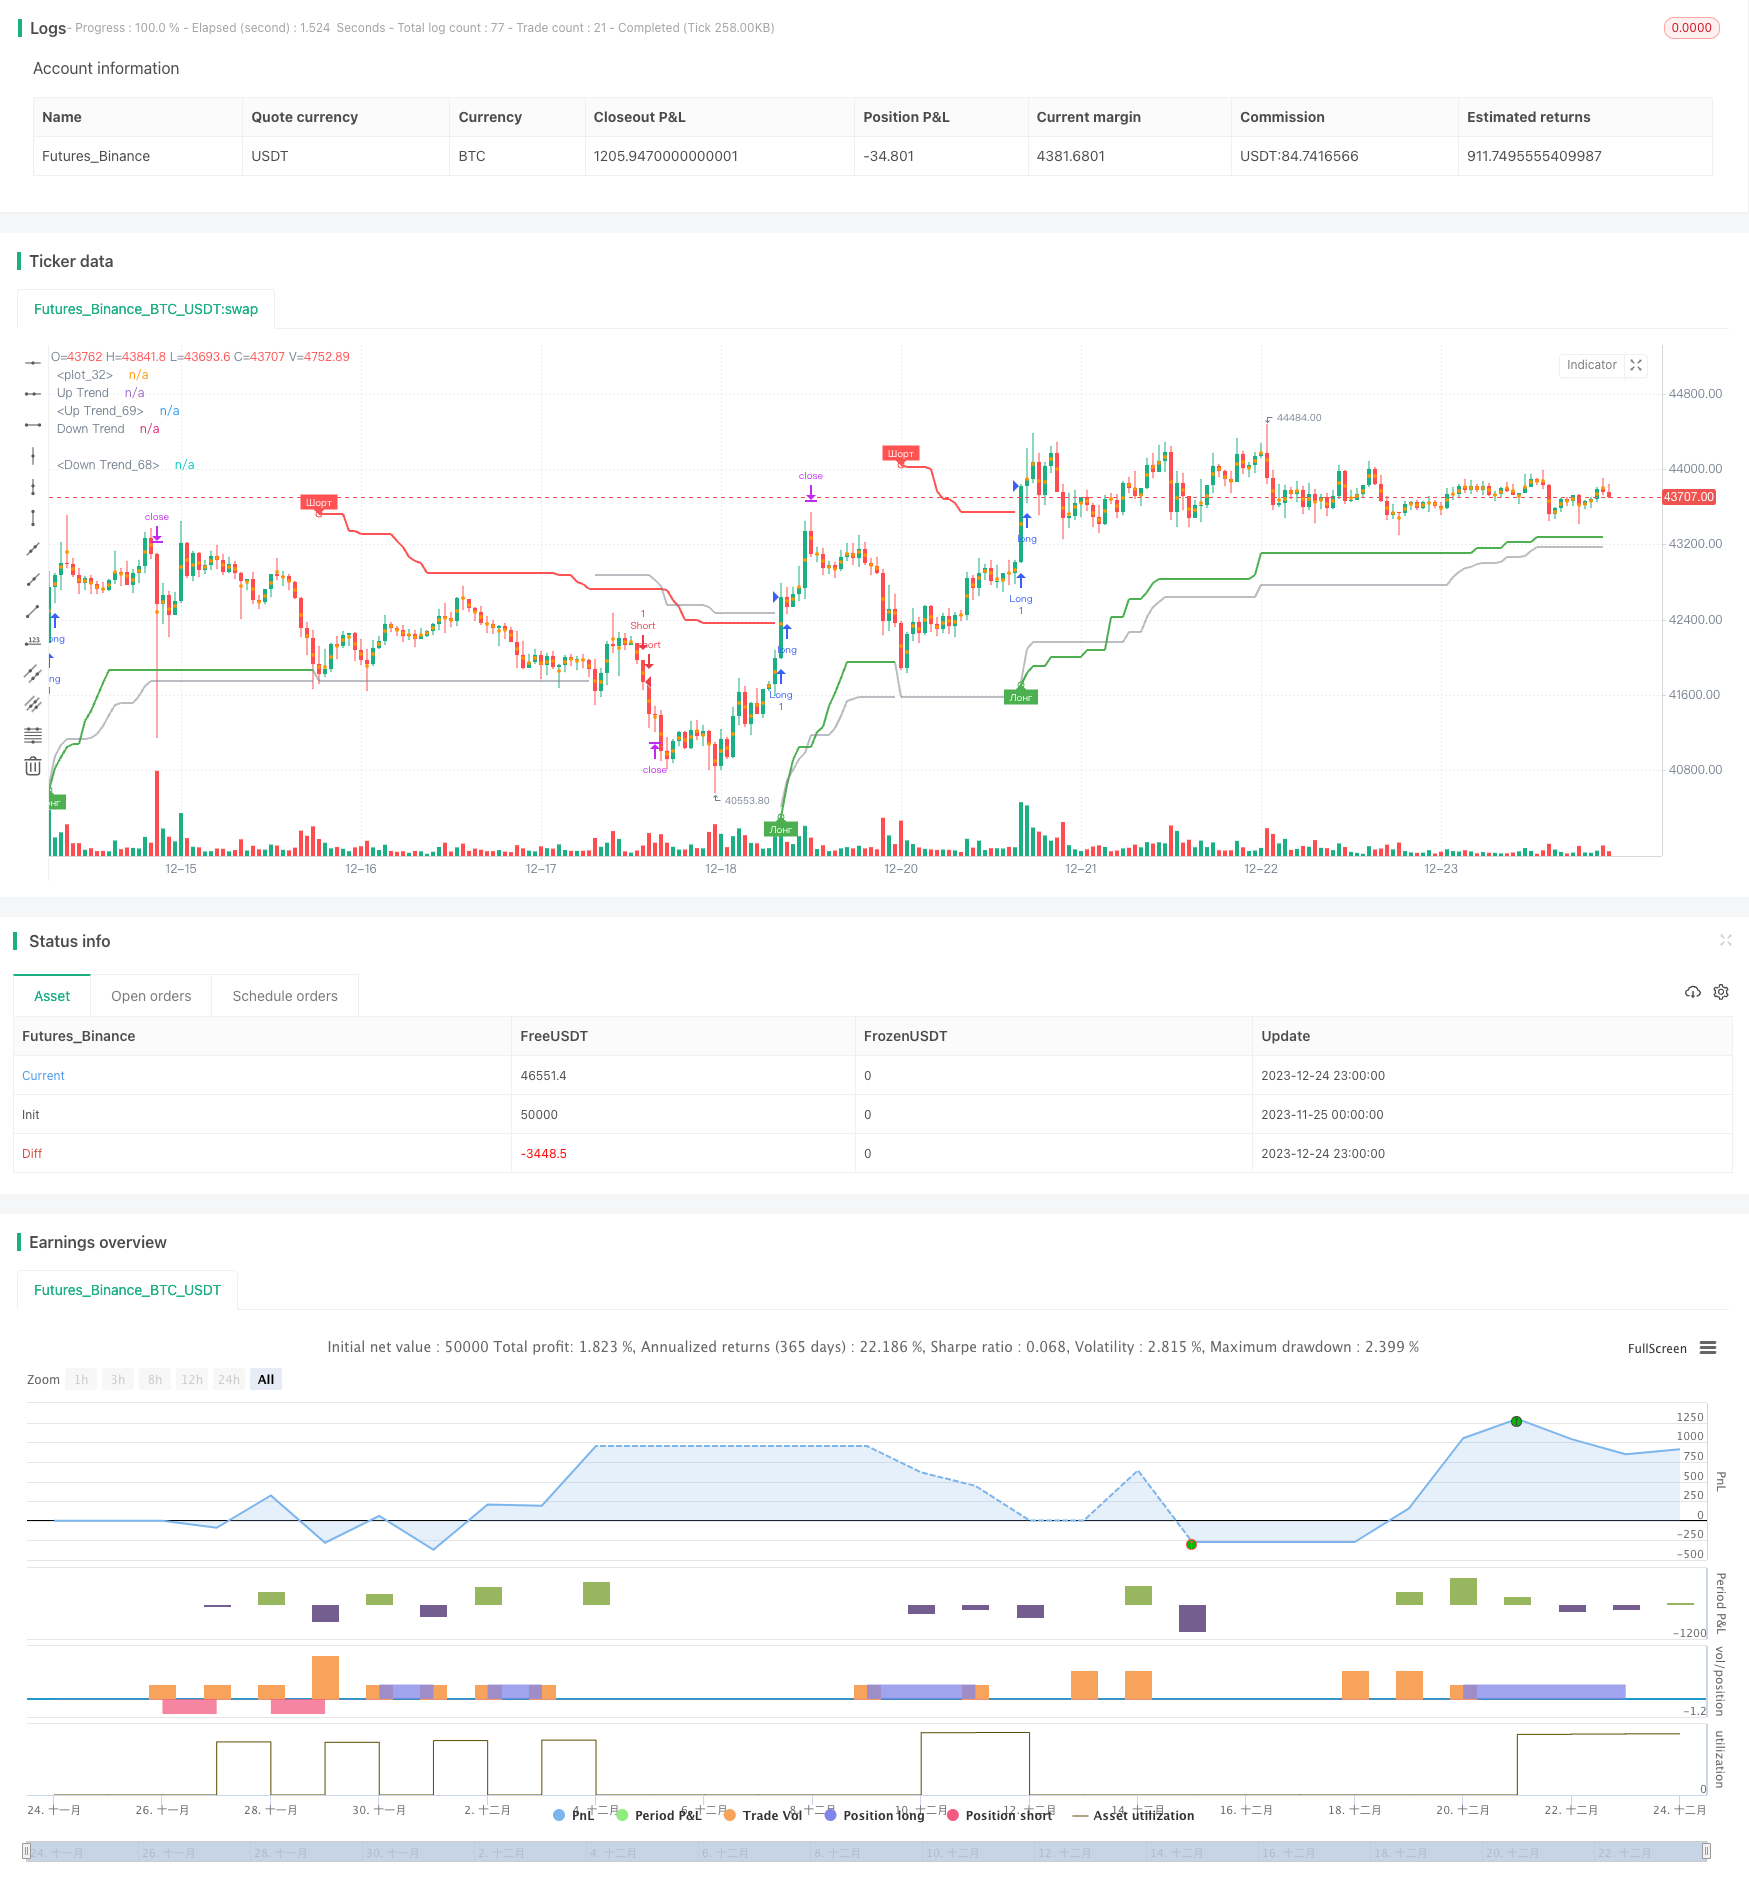
/*backtest
start: 2023-11-25 00:00:00
end: 2023-12-25 00:00:00
period: 1h
basePeriod: 15m
exchanges: [{"eid":"Futures_Binance","currency":"BTC_USDT"}]
*/

//@version=4
strategy("Supertrend TEST 2 Strategy", overlay = true, format=format.price, precision=2)

Periods = input(title="ATR Period", type=input.integer, defval=4)
src = input(hl2, title="Source")
Multiplier = input(title="ATR Multiplier", type=input.float, step=0.1, defval=4.7)
changeATR= input(title="Change ATR Calculation Method ?", type=input.bool, defval=true)
showsignals = input(title="Show Buy/Sell Signals ?", type=input.bool, defval=true)
highlighting = input(title="Highlighter On/Off ?", type=input.bool, defval=true)
tp=close
sl=close

atr2 = sma(tr, Periods)
atr= changeATR ? atr(Periods) : atr2
up=src-(Multiplier*atr)
up1 = nz(up[1],up)
up := close[1] > up1 ? max(up,up1) : up
dn=src+(Multiplier*atr)
dn1 = nz(dn[1], dn)
dn := close[1] < dn1 ? min(dn, dn1) : dn
trend = 1
trend := nz(trend[1], trend)
trend := trend == -1 and close > dn1 ? 1 : trend == 1 and close < up1 ? -1 : trend
upPlot = plot(trend == 1 ? up : na, title="Up Trend", style=plot.style_linebr, linewidth=2, color=color.green)
buySignal = trend == 1 and trend[1] == -1
plotshape(buySignal ? up : na, title="UpTrend Begins", location=location.absolute, style=shape.circle, size=size.tiny, color=color.green )
plotshape(buySignal and showsignals ? up : na, title="Лонг", text="Лонг", location=location.absolute, style=shape.labelup, size=size.tiny, color=color.green, textcolor=color.white )
dnPlot = plot(trend == 1 ? na : dn, title="Down Trend", style=plot.style_linebr, linewidth=2, color=color.red)
sellSignal = trend == -1 and trend[1] == 1
plotshape(sellSignal ? dn : na, title="DownTrend Begins", location=location.absolute, style=shape.circle, size=size.tiny, color=color.red )
plotshape(sellSignal and showsignals ? dn : na, title="Шорт", text="Шорт", location=location.absolute, style=shape.labeldown, size=size.tiny, color=color.red, textcolor=color.white )
mPlot = plot(ohlc4, title="", style=plot.style_circles, linewidth=0)
longFillColor = highlighting ? (trend == 1 ? color.green : color.white) : color.white
shortFillColor = highlighting ? (trend == -1 ? color.red : color.white) : color.white

sPeriods=input(title="ATR Period", type=input.integer, defval=8)
sMultiplier=input(title="dop ATR Multiplier", type=input.float, step=0.1, defval=1.5)
satr2 = sma(tr, sPeriods)
satr= changeATR ? atr(sPeriods) : satr2
ssup=ohlc4-(sMultiplier*satr)
ssup1 = nz(ssup[1],ssup)
ssup := close[1] > ssup1 ? max(ssup,ssup1) : ssup
sdn=ohlc4+(sMultiplier*satr)
sdn1 = nz(sdn[1], sdn)
sdn := close[1] < sdn1 ? min(sdn, sdn1) : sdn
strend = 1
strend := nz(strend[1], strend)
strend := strend == -1 and close > sdn1 ? 1 : strend == 1 and close < ssup1 ? -1 : strend
sbuySignal = strend == 1 and strend[1] == -1
ssellSignal = strend == -1 and strend[1] == 1

fPeriods=input(title="ATR Period", type=input.integer, defval=10)
fMultiplier=input(title="filter ATR Multiplier", type=input.float, step=0.1, defval=5)
fatr2 = sma(tr, fPeriods)
fatr= changeATR ? atr(fPeriods) : fatr2
fup=ohlc4-(fMultiplier*fatr)
fup1 = nz(fup[1],fup)
fup := close[1] > fup1 ? max(fup,fup1) : fup
fdn=ohlc4+(fMultiplier*fatr)
fdn1 = nz(fdn[1], fdn)
fdn := close[1] < fdn1 ? min(fdn, fdn1) : fdn
ftrend = 1
ftrend := nz(ftrend[1], ftrend)
ftrend := ftrend == -1 and close > fdn1 ? 1 : ftrend == 1 and close < fup1 ? -1 : ftrend
fbuySignal = ftrend == 1 and ftrend[1] == -1
fsellSignal = ftrend == -1 and ftrend[1] == 1
tcolor=color.new(color.gray,50)
fdnPlot = plot(ftrend == 1 ? na : fdn, title="Down Trend", style=plot.style_linebr, linewidth=2, color=tcolor)
fupPlot = plot(ftrend == 1 ? fup : na, title="Up Trend", style=plot.style_linebr, linewidth=2, color=tcolor)


if (strategy.position_size > 0)
	tp:=tp[1]
	sl:=up
	strategy.exit("Long_TP/SL","Long",limit=tp, stop=sl)

if (strategy.position_size < 0)
	tp:=tp[1]
	sl:=dn
	strategy.exit("Short_TP/SL","Short",limit=tp, stop=sl)


if ((buySignal and  ftrend==1) or (sbuySignal and trend==1 and  ftrend==1))
	tp:=close+(close-up)*0.382
    strategy.entry("Long", strategy.long,  limit=tp, comment=tostring(round(tp)))
if ((sellSignal and ftrend==-1) or (ssellSignal and trend==-1 and  ftrend==-1))
	tp:=close-(dn-close)*0.382
    strategy.entry("Short", strategy.short, limit=tp, comment=tostring(round(tp)))