smoothed oscillator پر مبنی حکمت عملی کے بعد رجحان
جائزہ
یہ حکمت عملی قیمت کے رجحانات کی نشاندہی کرنے کے لئے ہموار جھٹکے والے اشارے پر مبنی ہے ، اور رجحانات کی پیروی کرنے کے طریقوں کو بروئے کار لاتے ہوئے تجارت کرتی ہے۔ جب قیمت اشارے کی لائن کو توڑتی ہے تو زیادہ سر ، اور جب قیمت اشارے کی لائن کو توڑتی ہے تو مختصر سر۔
حکمت عملی کا اصول
اس حکمت عملی میں قیمتوں کے رجحانات کی نشاندہی کرنے کے لئے اپنی مرضی کے مطابق smoothed oscillation indicator کا استعمال کیا جاتا ہے۔ یہ اشارے موجودہ K لائن کی reversal closing price کا حساب لگاتا ہے ، یعنی اس نظریاتی قیمت کی جس کی وجہ سے نقصانات اور ٹریکٹ گراف کا رنگ reversal ہوتا ہے۔ اس کے بعد اس reversal closing price کو smoothed کیا جاتا ہے ، اور اس کے نتیجے میں smoothed oscillation indicator line ملتا ہے۔ جب قیمت اوپر (بائیں) اشارے کی لائن سے زیادہ ہوتی ہے تو ، اس کا مطلب یہ ہوتا ہے کہ یہ بڑھتی ہوئی (بائیں) رجحان میں ہے۔
حکمت عملی ایک پوزیشن لگانے کے اشارے کے طور پر اشارے کی لائن کو توڑنے کے لئے استعمال کرتی ہے۔ جب قیمت اشارے کی لائن کو توڑتی ہے تو زیادہ کریں اور جب قیمت اشارے کی لائن کو گرتی ہے تو خالی ہوجائیں۔ منافع کو لاک کرنے اور خطرے پر قابو پانے کے لئے اسٹاپ نقصان کی لائن کو داخلہ قیمت کی ایک فیصد کے طور پر ترتیب دیا گیا ہے۔
اسٹریٹجک فوائد
- اپنی مرضی کے مطابق اشارے کا استعمال کرتے ہوئے رجحانات کی نشاندہی کریں ، بہتر کارکردگی کا مظاہرہ کریں
- رجحان ٹریکنگ کا استعمال کرتے ہوئے، تقریباً کوانٹم ٹرینڈ ٹریڈنگ تھیوری کے مطابق
- سٹاپ نقصان کی ترتیب خطرے کو کنٹرول کرنے میں مددگار ہے
خطرے کا تجزیہ
- انڈیکیٹرز میں کچھ حد تک پیچھے ہٹنا ، جو حکمت عملی کی خراب کارکردگی کا سبب بن سکتا ہے۔
- صرف ایک اشارے کی بنیاد پر غلط سگنل
- سٹاپ نقصان کی ترتیبات میں اصلاح کی گنجائش ہے ، اور اس سے زیادہ نقصان ہوسکتا ہے
اصلاح کی سمت
- دوسرے اشارے کے ساتھ مل کر ٹریڈنگ سگنل کو فلٹر کرنے پر غور کریں ، جیسے برن بینڈ ، آر ایس آئی ، وغیرہ
- مختلف اشارے پیرامیٹرز کی ترتیبات کی جانچ
- نقصان کو روکنے کے طریقوں کی جانچ اور اصلاح
- مختلف اقسام اور ادوار کے لئے مزید ٹیسٹ کے اعداد و شمار
خلاصہ کریں۔
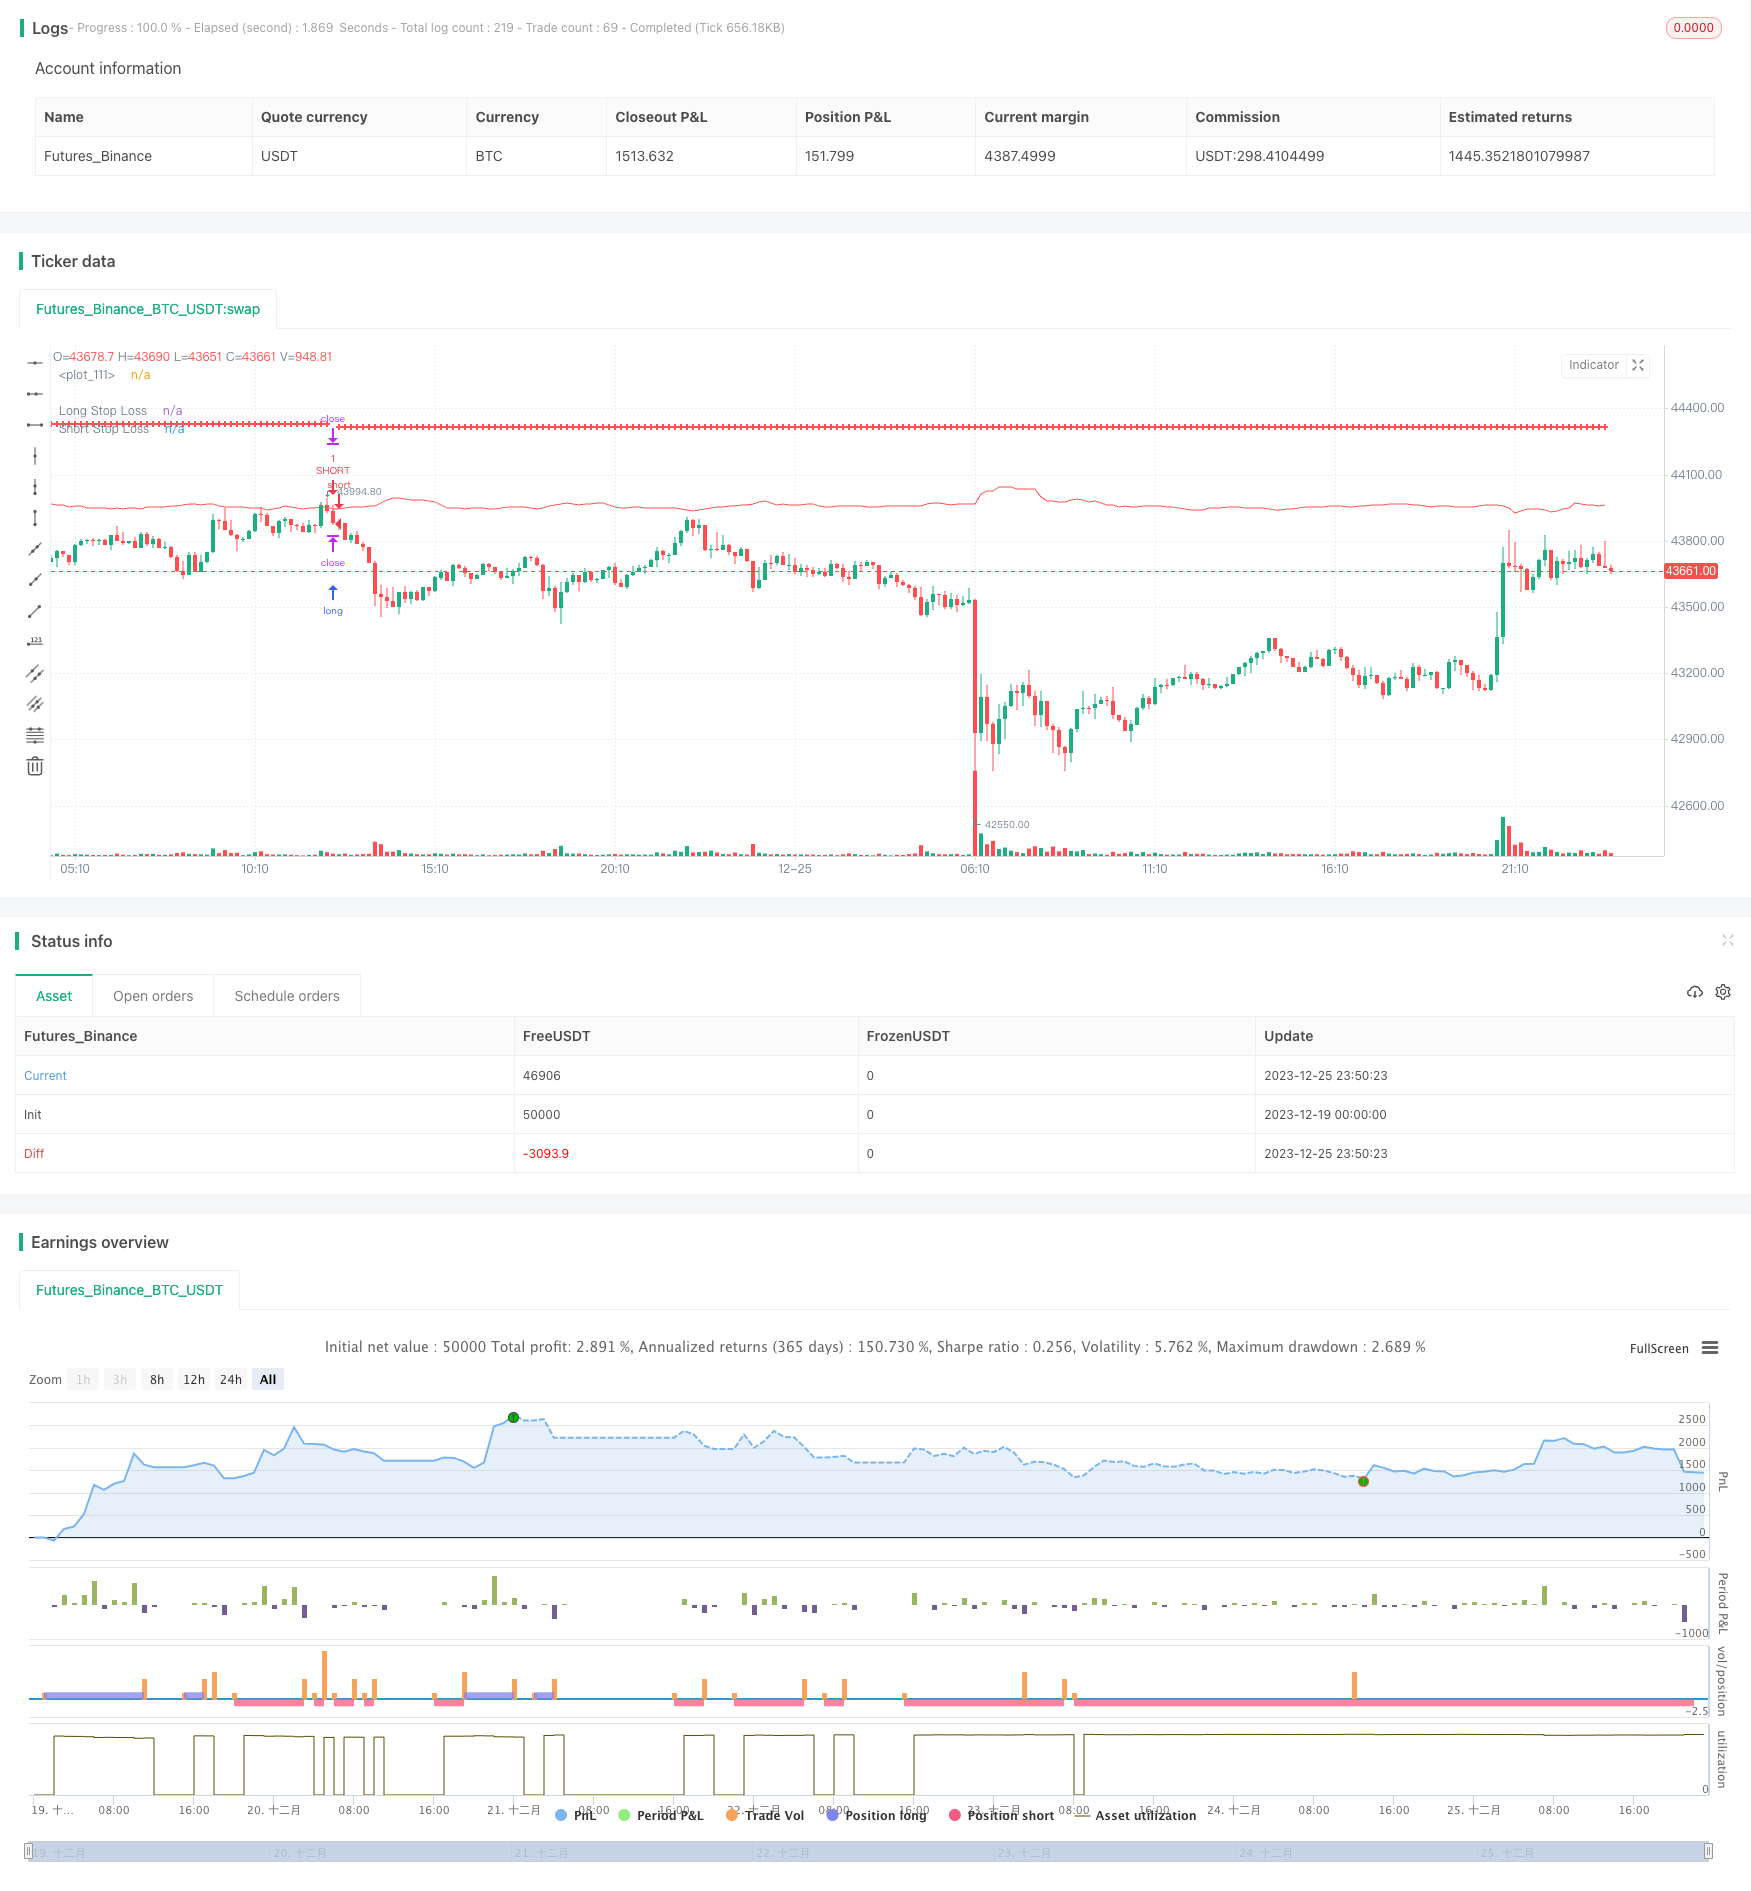
اس حکمت عملی کا مجموعی نظریہ واضح ہے ، اپنی مرضی کے مطابق اشارے کے رجحانات کی نشاندہی کرنے اور رجحانات کی پیروی کرنے کے طریقے سے تجارت کرتا ہے۔ واپسی کے نتائج کے مطابق ، حکمت عملی اچھی کارکردگی کا مظاہرہ کرتی ہے ، اس میں کچھ عملی استعمال کی صلاحیت ہے۔ لیکن صرف ایک اشارے پر انحصار کرتا ہے اور کچھ پیچھے ہٹنا ہے ، سگنل کی کوالٹی کی تصدیق ہونا باقی ہے۔ اس کے علاوہ ، نقصان کو روکنے کے طریقہ کار کو مزید جانچ اور اصلاح کی ضرورت ہے۔ مجموعی طور پر ، اس حکمت عملی کا تصور قابل عمل ہے ، لیکن ابھی بھی عملی استعمال کی صلاحیت کو بڑھانے کے لئے مزید کام کرنے کی ضرورت ہے۔
/*backtest
start: 2023-12-19 00:00:00
end: 2023-12-26 00:00:00
period: 10m
basePeriod: 1m
exchanges: [{"eid":"Futures_Binance","currency":"BTC_USDT"}]
*/

// This source code is subject to the terms of the Mozilla Public License 2.0 at https://mozilla.org/MPL/2.0/

// © TraderHalai
// This is a backtest of the Smoothed Heikin Ashi Trend indicator, which computes the reverse candle close price required to flip a heikin ashi trend from red to green and vice versa. Original indicator can be found on the scripts section of my profile.

// Default testing parameters are 10% of equity position size, with a 1% stop loss on short and long strategy.opentrades.commission

// This particular back test uses this indicator as a Trend trading tool with a tight stop loss. The equity curve as tested seems promising but requires further work to refine. Note in an actual trading setup, you may wish to use this with volatilty filters as most of the losses are in sideways, low volatility markets.


//@version=5
strategy("Smoothed Heikin Ashi Trend on Chart - TraderHalai BACKTEST", " SHA Trend - BACKTEST", overlay=true)
//Inputs

i_useSmooth =       input ( true, "Use smoothing Heikin Ashi")
i_smoothingMethod = input.string("SMA", "Method", options=["SMA", "EMA", "HMA", "VWMA", "RMA"])
i_smoothingPeriod = input ( 10, "Smoothing period")

i_infoBox   =       input ( true, "Show Info Box"        )
i_decimalP  =       input ( 2,    "Prices Decimal Places")
i_boxOffSet =       input ( 5,    "Info Box Offset"      )
i_repaint   =       input (false,  "Repaint -  Keep on for live / Off for backtest")

i_longLossPerc = input.float(title="Long Stop Loss (%)",minval=0.0, step=0.1, defval=1) * 0.01

i_shortLossPerc = input.float(title="Short Stop Loss (%)", minval=0.0, step=0.1, defval=1) * 0.01


timeperiod = timeframe.period

//Security functions to avoid repaint, as per PineCoders
f_secureSecurity(_symbol, _res, _src) => request.security(_symbol, _res, _src[1], lookahead = barmerge.lookahead_on)
f_security(_symbol, _res, _src, _repaint) => request.security(_symbol, _res, _src[_repaint ? 0 : barstate.isrealtime ? 1 : 0])[_repaint ? 0 : barstate.isrealtime ? 0 : 1]
f_secSecurity2(_symbol, _res, _src) => request.security(_symbol, _res, _src[1])


candleClose = f_security(syminfo.tickerid, timeperiod, close, i_repaint)
candleOpen = f_security(syminfo.tickerid, timeperiod, open, i_repaint)
candleLow = f_security(syminfo.tickerid, timeperiod, low, i_repaint)
candleHigh = f_security(syminfo.tickerid, timeperiod, high, i_repaint)

haTicker = ticker.heikinashi(syminfo.tickerid)
haClose = f_security(haTicker, timeperiod, close, i_repaint)
haOpen = f_security(haTicker, timeperiod, open, i_repaint)
haLow = f_security(haTicker, timeperiod, low, i_repaint)
haHigh= f_security(haTicker, timeperiod, high, i_repaint)


reverseClose = (2 * (haOpen[1] + haClose[1])) - candleHigh - candleLow - candleOpen

if(reverseClose < candleLow)
    reverseClose := (candleLow + reverseClose) / 2

if(reverseClose > candleHigh)
    reverseClose := (candleHigh + reverseClose) / 2

//Smoothing

smaSmoothed = ta.sma(reverseClose, i_smoothingPeriod)
emaSmoothed = ta.ema(reverseClose, i_smoothingPeriod)
hmaSmoothed = ta.hma(reverseClose, i_smoothingPeriod)
vwmaSmoothed = ta.vwma(reverseClose, i_smoothingPeriod)
rmaSmoothed = ta.rma(reverseClose, i_smoothingPeriod)

shouldApplySmoothing = i_useSmooth and i_smoothingPeriod > 1

smoothedReverseClose = reverseClose

if(shouldApplySmoothing)
    if(i_smoothingMethod == "SMA")
        smoothedReverseClose := smaSmoothed
    else if(i_smoothingMethod == "EMA")
        smoothedReverseClose := emaSmoothed
    else if(i_smoothingMethod == "HMA")
        smoothedReverseClose := hmaSmoothed
    else if(i_smoothingMethod == "VWMA")
        smoothedReverseClose := vwmaSmoothed
    else if(i_smoothingMethod == "RMA")
        smoothedReverseClose := rmaSmoothed
    else
        smoothedReverseClose := reverseClose // Default to non-smoothed for invalid smoothing type

haBull = candleClose >= smoothedReverseClose
haCol = haBull ? color.green : color.red


//Overall trading strategy
if(ta.crossover(candleClose, smoothedReverseClose))
    strategy.entry("LONG", strategy.long, stop=smoothedReverseClose)
else
    strategy.cancel("LONG")

if(ta.crossunder(candleClose, smoothedReverseClose))
    strategy.entry("SHORT", strategy.short, stop=smoothedReverseClose)
else
    strategy.cancel("SHORT")


longStopPrice  = strategy.position_avg_price * (1 - i_longLossPerc)
shortStopPrice = strategy.position_avg_price * (1 + i_shortLossPerc)


plot(series=(strategy.position_size > 0) ? longStopPrice : na,
     color=color.red, style=plot.style_cross,
     linewidth=2, title="Long Stop Loss")
plot(series=(strategy.position_size < 0) ? shortStopPrice : na,
     color=color.red, style=plot.style_cross,
     linewidth=2, title="Short Stop Loss")

plot(smoothedReverseClose, color=haCol)

if (strategy.position_size > 0)
    strategy.exit(id="XL STP", stop=longStopPrice)

if (strategy.position_size < 0)
    strategy.exit(id="XS STP", stop=shortStopPrice)