ڈبل موونگ ایوریج ٹریلنگ اسٹاپ نقصان کی حکمت عملی
جائزہ
یہ حکمت عملی تیز اوسط اور سست اوسط کی کراسنگ پر مبنی ہے جس میں زیادہ سے زیادہ کم کرنے کا فیصلہ کیا جاتا ہے۔ جب تیز اوسط پر سست اوسط سے گزرتا ہے تو زیادہ ہوتا ہے ، اور جب تیز اوسط سے نیچے سست اوسط سے گزرتا ہے تو صاف ہوجاتا ہے۔ زیادہ منافع کے حصول کے ل the ، اس حکمت عملی میں ٹریکنگ اسٹاپ نقصان کا طریقہ کار استعمال کیا جاتا ہے۔ زیادہ کرنے کے بعد ، براہ راست سودے کی قیمت کے نیچے اسٹاپ نقصان کی قیمت مقرر نہیں کی جاتی ہے ، بلکہ سودے کی قیمت کے نیچے ایک ٹریکنگ اسٹاپ نقصان کی قیمت قائم کی جاتی ہے ، جس میں قیمتوں میں اضافے کے ساتھ ہی ٹریکنگ اسٹاپ نقصان بڑھ جاتا ہے ، یہاں تک کہ قیمتوں میں کمی کی وجہ سے قیمتوں میں کمی واقع ہوتی ہے۔
حکمت عملی کا اصول
یہ حکمت عملی تیز رفتار سادہ حرکت پذیر اوسط ((SMA) اور سست رفتار SMA کا استعمال کرتی ہے تاکہ یہ فیصلہ کیا جاسکے کہ کس طرح اور کس وقت پوزیشن پر کام کیا جائے۔ جب تیز رفتار SMA پر سست رفتار SMA سے گزرتا ہے تو ، اس رجحان کا تعین کرنے کے لئے زیادہ سے زیادہ ہوتا ہے ، اور اس وقت زیادہ ہوتا ہے۔ جب تیز رفتار SMA کے نیچے سست رفتار SMA سے گزرتا ہے تو ، اس رجحان کو تبدیل کرنے کا تعین کریں ، اور پوزیشن کو برابر کرنے کے لئے تیار ہوں۔
زیادہ منافع کے حصول کے لئے ، اس حکمت عملی میں ٹریکنگ اسٹاپ نقصان کا طریقہ کار متعارف کرایا گیا ہے۔ زیادہ کرنے کے بعد ، اسٹاپ نقصان کا آرڈر طے نہیں کیا جاتا ہے۔ اس کے بجائے ، ایک ٹریکنگ اسٹاپ قیمت قائم کی جاتی ہے ، جو قیمت میں اضافے کے ساتھ ساتھ اوپر کی طرف چلتی ہے ، اور ہر بار قیمت میں اضافے کے بعد ، ٹریکنگ اسٹاپ قیمت میں ایک خاص حد تک اضافہ ہوتا ہے۔ جب قیمت میں واپسی ہوتی ہے اور ٹریکنگ اسٹاپ نقصان کی قیمت کو چھوتی ہے تو ، اسٹاپ نقصان کا آرڈر متحرک ہوجاتا ہے ، اور پوزیشن کو صاف کردیا جاتا ہے۔
اسٹاپ نقصان کی قیمتوں کا سراغ لگانے کے لئے ، خاص طور پر ، حساب کتاب کا فارمولا یہ ہے:
ٹریکنگ سٹاپ نقصان = قیمت × (1 - ٹریکنگ سٹاپ نقصان فی صد)
اس میں ، اسٹاپ نقصان کی پیمائش کی فیصد حکمت عملی کے پیرامیٹر خانہ Deviation % خانہ کے ذریعہ طے کی جاتی ہے۔ حکمت عملی ہر بار جب K لائن بند ہوجاتی ہے تو اس کی پوزیشن کھولی جاتی ہے۔ نئی ٹریکنگ اسٹاپ نقصان کی قیمت پچھلی K لائن کی ٹریکنگ اسٹاپ نقصان کی قیمت سے کم نہیں ہوسکتی ہے ، اس بات کو یقینی بنانے کے لئے کہ اسٹاپ نقصان کی قیمت صرف اوپر کی طرف بڑھ سکتی ہے ، پیچھے نہیں جاسکتی ہے۔
جب قیمت گرتی ہے اور ٹریکنگ اسٹاپ نقصان کی قیمت کو چھوتی ہے تو ، اس سے ایک صفائی کا اشارہ ہوتا ہے ، اور پوزیشن مارکیٹ کی قیمت پر ایک صفائی کا استعمال کرتی ہے۔
اسٹریٹجک فوائد
- رجحان کی سمت کا اندازہ لگانے کے لئے دوہری مساوی لائنوں کا استعمال کریں ، بہتر پیمائش کریں
- ٹریکنگ سٹاپ نقصان کے ساتھ زیادہ منافع حاصل کرنے کے لئے
- اپنی مرضی کے مطابق اوسط لکیری مدت اور سٹاپ نقصان کا سراغ لگانے کی شدت
- اسٹاپ نقصان کی لکیر اوپر کی طرف بڑھتی ہے ، زیادہ تر منافع کو یقینی بناتی ہے
- رجحان کے الٹ جانے پر تیزی سے روکنے اور زیادہ نقصان سے بچنے کے لئے
خطرات اور حل
- اوسط لکیری کراسنگ کا وقت غلط انتخاب کیا گیا ، جس سے مجازی سگنل پیدا ہوسکتے ہیں۔ آپ مختلف پیرامیٹرز کی جانچ کر سکتے ہیں تاکہ اوسط لکیری کا بہترین مجموعہ مل سکے
- ٹریکنگ اسٹاپ نقصان بہت زیادہ جارحانہ ہے ، جس کی وجہ سے اسٹاپ نقصان بہت جلد ٹوٹ جاتا ہے۔ اسٹاپ نقصان ٹریکنگ فیصد پیرامیٹرز کو مناسب طریقے سے ایڈجسٹ کیا جاسکتا ہے۔
- قیمتوں میں ایک چھلانگ کا سوراخ ہوتا ہے ، اور یہ براہ راست اسٹاپ نقصان کی قیمت کو بھی توڑ سکتا ہے۔ یہ مشورہ دیا جاتا ہے کہ دوسرے اشارے کے ساتھ مل کر رجحانات کا اندازہ لگائیں ، اور ہنگامہ خیز حالات میں تجارت سے گریز کریں۔
اصلاح کی سمت
- مختلف اوسط لکیری مدت کے پیرامیٹرز کی جانچ کر سکتے ہیں اور بہترین پیرامیٹرز کا مجموعہ تلاش کریں
- بہترین نقصان کی سطح کو تلاش کرنے کے لئے مختلف سٹاپ ٹریکنگ فیصد پیرامیٹرز کی جانچ کر سکتے ہیں
- دوسرے اشارے کے ساتھ فیصلہ کرنے کے قابل ، زلزلے کی صورت حال میں تجارت کو روکنے کے لئے ، غیر متوقع واقعات سے بچنے کے لئے
خلاصہ کریں۔
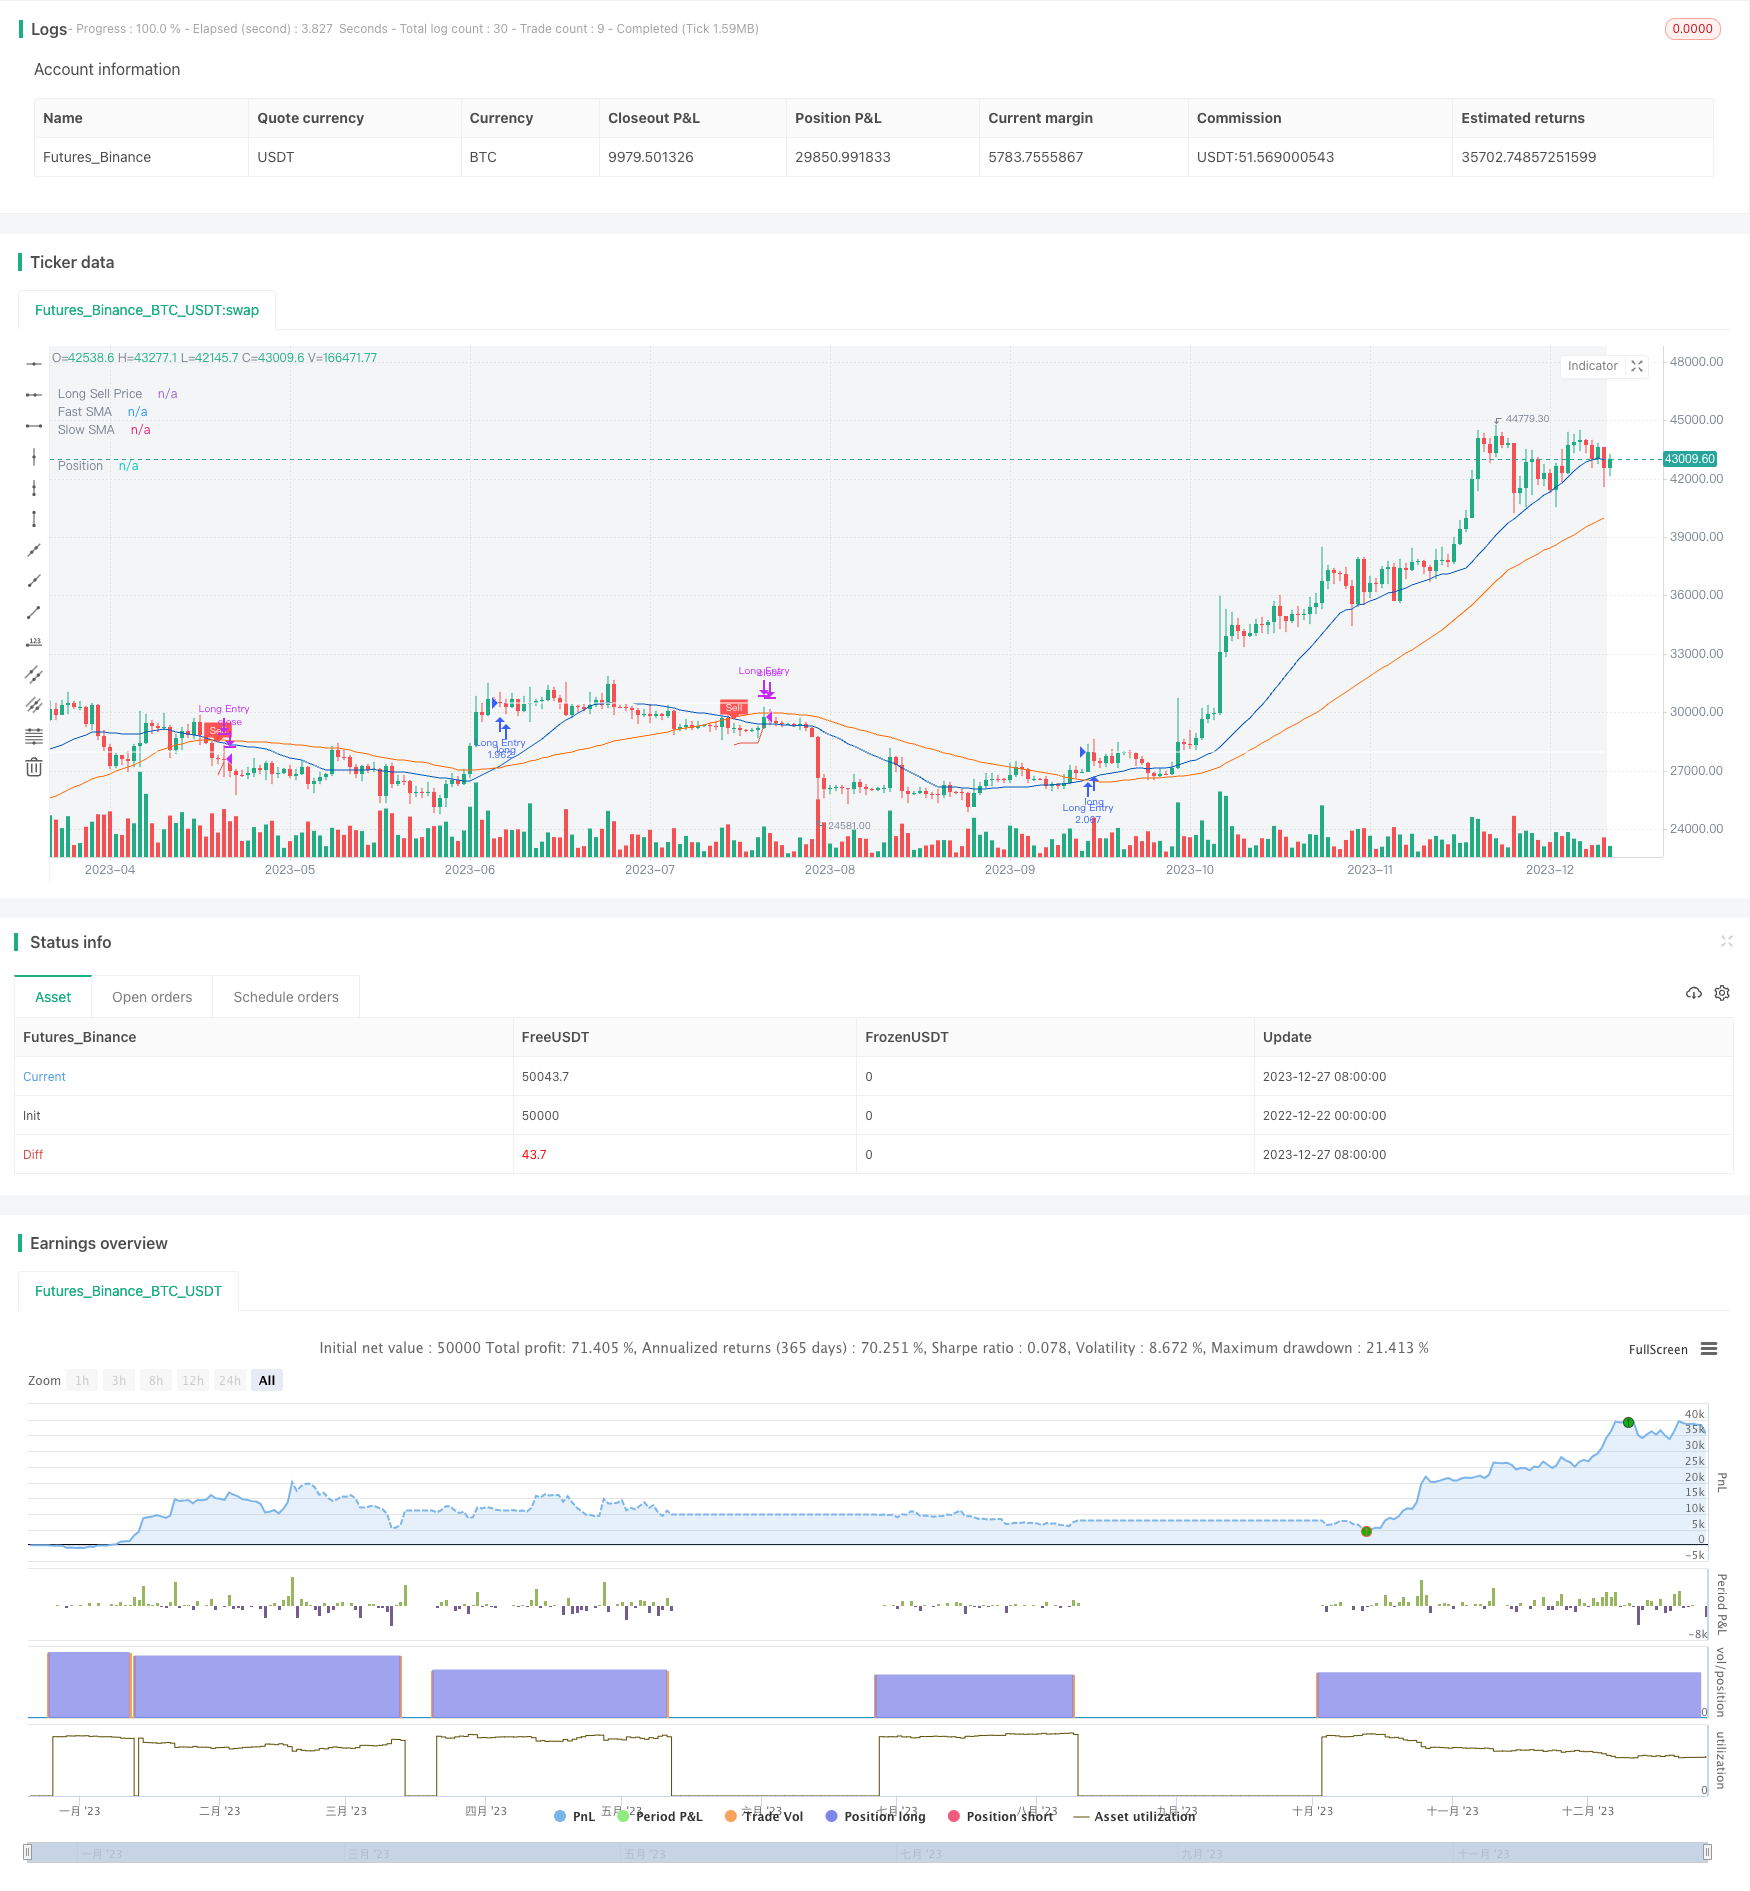
اس حکمت عملی میں رجحان کی سمت کا تعین کرنے کے لئے مجموعی طور پر اوسط لکیری اشارے کا استعمال کیا جاتا ہے ، اور منافع کو روکنے کے لئے نقصان کے طریقہ کار کو ٹریک کیا جاتا ہے۔ تربیت کے اعداد و شمار میں اچھی کارکردگی کا مظاہرہ کریں۔ پیرامیٹرز کے مجموعے کو بہتر بنانے ، خطرے پر قابو پانے ، مستحکم آمدنی حاصل کرنے کی امید ہے۔ تاہم ، کوئی بھی حکمت عملی مکمل طور پر نقصان سے بچنے کے قابل نہیں ہے ، مناسب پوزیشن مینجمنٹ کو ایڈجسٹ کرنے ، مختلف اقسام کی جانچ کرنے ، خطرے کو تقسیم کرنے کی سفارش کی گئی ہے۔
/*backtest
start: 2022-12-22 00:00:00
end: 2023-12-28 00:00:00
period: 1d
basePeriod: 1h
exchanges: [{"eid":"Futures_Binance","currency":"BTC_USDT"}]
*/

//@version=5
//
// ▒▒▒▒▒▒▒▒▒▒▒▒▒▒▒▒▒▒▒▒▒▒▒▒▒▒▒▒▒▒▒▒▒▒▒▒▒▒▒▒▒▒▒▒▒▒▒▒▒▒▒▒▒▒▒▒▒▒▒▒▒▒▒▒▒▒▒▒▒▒▒▒▒▒▒▒▒▒▒▒▒▒▒▒▒▒▒▒▒▒▒▒▒▒▒▒▒▒▒▒▒▒▒▒▒▒▒▒▒▒▒▒▒▒
//  -----------------------------------------------------------------------------
//  Copyright 2022 Iason Nikolas | jason5480
//  Trailing Buy script may be freely distributed under the MIT license.
//
//  Permission is hereby granted, free of charge,
//  to any person obtaining a copy of this software and associated documentation files (the "Software"),
//  to deal in the Software without restriction, including without limitation the rights to use, copy, modify, merge,
//  publish, distribute, sublicense, and/or sell copies of the Software, and to permit persons to whom the Software is furnished to do so,
//  subject to the following conditions:
//
//  The above copyright notice and this permission notice shall be included in all copies or substantial portions of the Software.
//
//  THE SOFTWARE IS PROVIDED "AS IS", WITHOUT WARRANTY OF ANY KIND,
//  EXPRESS OR IMPLIED, INCLUDING BUT NOT LIMITED TO THE WARRANTIES OF MERCHANTABILITY,
//  FITNESS FOR A PARTICULAR PURPOSE AND NONINFRINGEMENT. IN NO EVENT SHALL THE AUTHORS OR COPYRIGHT HOLDERS BE LIABLE FOR ANY CLAIM,
//  DAMAGES OR OTHER LIABILITY, WHETHER IN AN ACTION OF CONTRACT, TORT OR OTHERWISE, ARISING FROM,
//  OUT OF OR IN CONNECTION WITH THE SOFTWARE OR THE USE OR OTHER DEALINGS IN THE SOFTWARE.
//
//  -----------------------------------------------------------------------------
//
//  Authors:  @jason5480
//  Revision: v1.0.1
//  Date:     24-Feb-2022
//
//  Description
//  =============================================================================
//  This strategy will go long if fast MA crosses over slow MA.
//  If the 'Enable Trailing` is checked then the strategy instead of exiting from the position
//  directly it will follow the price upwards (percentagewise) with small steps
//  If the price drops by this percentage then the exit order will be executed
//
//  The strategy has the following parameters:
//
//  Fast SMA Length - How many candles back to calculte the fast SMA.
//  Slow SMA Length - How many candles back to calculte the slow SMA.
//  Enable Trailing - Enable or disable the trailing
//  Deviation % - The step to follow the price when the open position condition is met.
//  Source Exit Control - The source price to compare with the exit price to trigger the exit order when trailing.
//
//  -----------------------------------------------------------------------------
//  Disclaimer:
//    1. I am not licensed financial advisors or broker dealer. I do not tell you
//       when or what to buy or sell. I developed this software which enables you
//       execute manual or automated using TradingView. The
//       software allows you to set the criteria you want for entering and exiting
//       trades.
//    2. Do not trade with money you cannot afford to lose.
//    3. I do not guarantee consistent profits or that anyone can make money with no
//       effort. And I am not selling the holy grail.
//    4. Every system can have winning and losing streaks.
//    5. Money management plays a large role in the results of your trading. For
//       example: lot size, account size, broker leverage, and broker margin call
//       rules all have an effect on results. Also, your Take Profit and Stop Loss
//       settings for individual pair trades and for overall account equity have a
//       major impact on results. If you are new to trading and do not understand
//       these items, then I recommend you seek education materials to further your
//       knowledge.
//
//    YOU NEED TO FIND AND USE THE TRADING SYSTEM THAT WORKS BEST FOR YOU AND YOUR
//    TRADING TOLERANCE.
//
//    I HAVE PROVIDED NOTHING MORE THAN A TOOL WITH OPTIONS FOR YOU TO TRADE WITH THIS PROGRAM ON TRADINGVIEW.
//
//    I accept suggestions to improve the script.
//    If you encounter any problems I will be happy to share with me.
//  -----------------------------------------------------------------------------
//
// ▒▒▒▒▒▒▒▒▒▒▒▒▒▒▒▒▒▒▒▒▒▒▒▒▒▒▒▒▒▒▒▒▒▒▒▒▒▒▒▒▒▒▒▒▒▒▒▒▒▒▒▒▒▒▒▒▒▒▒▒▒▒▒▒▒▒▒▒▒▒▒▒▒▒▒▒▒▒▒▒▒▒▒▒▒▒▒▒▒▒▒▒▒▒▒▒▒▒▒▒▒▒▒▒▒▒▒▒▒▒▒▒▒▒
// SETUP ============================================================================================================

strategy(title = 'Trailing Sell',
         shorttitle = 'TS',
         overlay = true,
         pyramiding = 0,
         default_qty_type = strategy.percent_of_equity,
         default_qty_value = 100,
         initial_capital = 100000)

//
// ▒▒▒▒▒▒▒▒▒▒▒▒▒▒▒▒▒▒▒▒▒▒▒▒▒▒▒▒▒▒▒▒▒▒▒▒▒▒▒▒▒▒▒▒▒▒▒▒▒▒▒▒▒▒▒▒▒▒▒▒▒▒▒▒▒▒▒▒▒▒▒▒▒▒▒▒▒▒▒▒▒▒▒▒▒▒▒▒▒▒▒▒▒▒▒▒▒▒▒▒▒▒▒▒▒▒▒▒▒▒▒▒▒▒
// FILTERS ==========================================================================================================

// INPUT ============================================================================================================
usefromDate = input.bool(defval = true, title = 'From', inline = "From Date", group = "Filters")
fromDate = input(defval = timestamp('01 Jan 2021 00:00 UTC'), title = '', inline = "From Date", group = 'Filters')
usetoDate = input.bool(defval = false, title = 'To ', inline = "To Date", group = "Filters")
toDate = input(defval = timestamp('31 Dec 2121 23:59 UTC'), title = '', inline = "To Date", group = 'Filters')

// LOGIC ============================================================================================================
isWithinPeriod() => true // create function "within window of time"

// PLOT =============================================================================================================
bgcolor(color = isWithinPeriod() ? color.new(color.gray, 90) : na, title = 'Period')

//
// ▒▒▒▒▒▒▒▒▒▒▒▒▒▒▒▒▒▒▒▒▒▒▒▒▒▒▒▒▒▒▒▒▒▒▒▒▒▒▒▒▒▒▒▒▒▒▒▒▒▒▒▒▒▒▒▒▒▒▒▒▒▒▒▒▒▒▒▒▒▒▒▒▒▒▒▒▒▒▒▒▒▒▒▒▒▒▒▒▒▒▒▒▒▒▒▒▒▒▒▒▒▒▒▒▒▒▒▒▒▒▒▒▒▒
// STRATEGY =========================================================================================================

// INPUT ============================================================================================================
fastMALen = input.int(defval = 21, title = 'Fast/Slow SMA Length', inline = 'MA Length', group = 'Strategy')
slowMALen = input.int(defval = 49, title = '', tooltip = 'How many candles back to calculte the fast/slow SMA.', inline = 'MA Length', group = 'Strategy')

// LOGIC ============================================================================================================
fastMA = ta.sma(close, fastMALen)
slowMA = ta.sma(close, slowMALen)

bool openLongPosition = isWithinPeriod() and ta.crossover(fastMA, slowMA)
bool closeLongPosition = ta.crossunder(fastMA, slowMA)

// PLOT =============================================================================================================
var fastColor = color.new(#0056BD, 0)
plot(series = fastMA, title = 'Fast SMA', color = fastColor, linewidth = 1, style = plot.style_line)
var slowColor = color.new(#FF6A00, 0)
plot(series = slowMA, title = 'Slow SMA', color = slowColor, linewidth = 1, style = plot.style_line)

plotshape(series = closeLongPosition and strategy.position_size > 0 ? fastMA : na, title = 'Sell', text = 'Sell', style = shape.labeldown, location = location.absolute, color = color.new(color.red, 0), textcolor = color.new(color.white, 0), size = size.tiny)

//
// ▒▒▒▒▒▒▒▒▒▒▒▒▒▒▒▒▒▒▒▒▒▒▒▒▒▒▒▒▒▒▒▒▒▒▒▒▒▒▒▒▒▒▒▒▒▒▒▒▒▒▒▒▒▒▒▒▒▒▒▒▒▒▒▒▒▒▒▒▒▒▒▒▒▒▒▒▒▒▒▒▒▒▒▒▒▒▒▒▒▒▒▒▒▒▒▒▒▒▒▒▒▒▒▒▒▒▒▒▒▒▒▒▒▒
// EXIT ============================================================================================================

// INPUT ============================================================================================================
enableTrailing = input.bool(defval = true, title = 'Enable Trailing', tooltip = 'Enable or disable the trailing for exit position.', group = 'Exit')
devExitPerc = input.float(defval = 3.0, title = 'Deviation %', minval = 0.01, maxval = 100, step = 0.05, tooltip = 'The step to follow the price when the open position condition is met.', group = 'Exit') / 100
ctrLongExitSrc = input.source(defval = low, title = 'Source Exit Control', tooltip = 'The source price to compare with the exit price to trigger the exit order when trailing.', group = 'Exit')

// LOGIC ============================================================================================================
var bool exitLongPosition = false

int barsSinceOpenLong = nz(ta.barssince(openLongPosition), 999999)
int barsSinceCloseLong = nz(ta.barssince(closeLongPosition), 999999)
int barsSinceExitLong = nz(ta.barssince(exitLongPosition), 999999)
bool closeLongIsActive = barsSinceOpenLong >= barsSinceCloseLong
bool exitLongIsPending = barsSinceExitLong >= barsSinceCloseLong
bool tryExitLongPosition = isWithinPeriod() and closeLongIsActive and exitLongIsPending

float longExitPrice = na
longExitPrice := if closeLongPosition and strategy.position_size > 0
    close * (1 - devExitPerc)
else if tryExitLongPosition
    math.max(high * (1 - devExitPerc), nz(longExitPrice[1], 999999))
else
    na

exitLongPosition := enableTrailing ? isWithinPeriod() and ta.crossunder(closeLongPosition ? close : ctrLongExitSrc, longExitPrice) : closeLongPosition

// PLOT =============================================================================================================
var sellPriceColor = color.new(#e25141, 0)
plot(series = enableTrailing ? longExitPrice : na, title = 'Long Sell Price', color = sellPriceColor, linewidth = 1, style = plot.style_linebr)

//
// ▒▒▒▒▒▒▒▒▒▒▒▒▒▒▒▒▒▒▒▒▒▒▒▒▒▒▒▒▒▒▒▒▒▒▒▒▒▒▒▒▒▒▒▒▒▒▒▒▒▒▒▒▒▒▒▒▒▒▒▒▒▒▒▒▒▒▒▒▒▒▒▒▒▒▒▒▒▒▒▒▒▒▒▒▒▒▒▒▒▒▒▒▒▒▒▒▒▒▒▒▒▒▒▒▒▒▒▒▒▒▒▒▒▒
// POSITION ORDERS ==================================================================================================

// LOGIC ============================================================================================================
// getting into LONG position
strategy.entry(id = 'Long Entry', direction = strategy.long, when = openLongPosition, alert_message = 'Long(' + syminfo.ticker + '): Started')
// submit close order on trend reversal
strategy.close(id = 'Long Entry', when = exitLongPosition, comment = 'Close Long', alert_message = 'Long(' + syminfo.ticker + '): Closed at market price')

// PLOT =============================================================================================================
var posColor = color.new(color.white, 0)
plot(series = strategy.position_avg_price, title = 'Position', color = posColor, linewidth = 1, style = plot.style_linebr)

// ==================================================================================================================