ڈبل اتار چڑھاؤ بینڈ تراشنے کی حکمت عملی
جائزہ
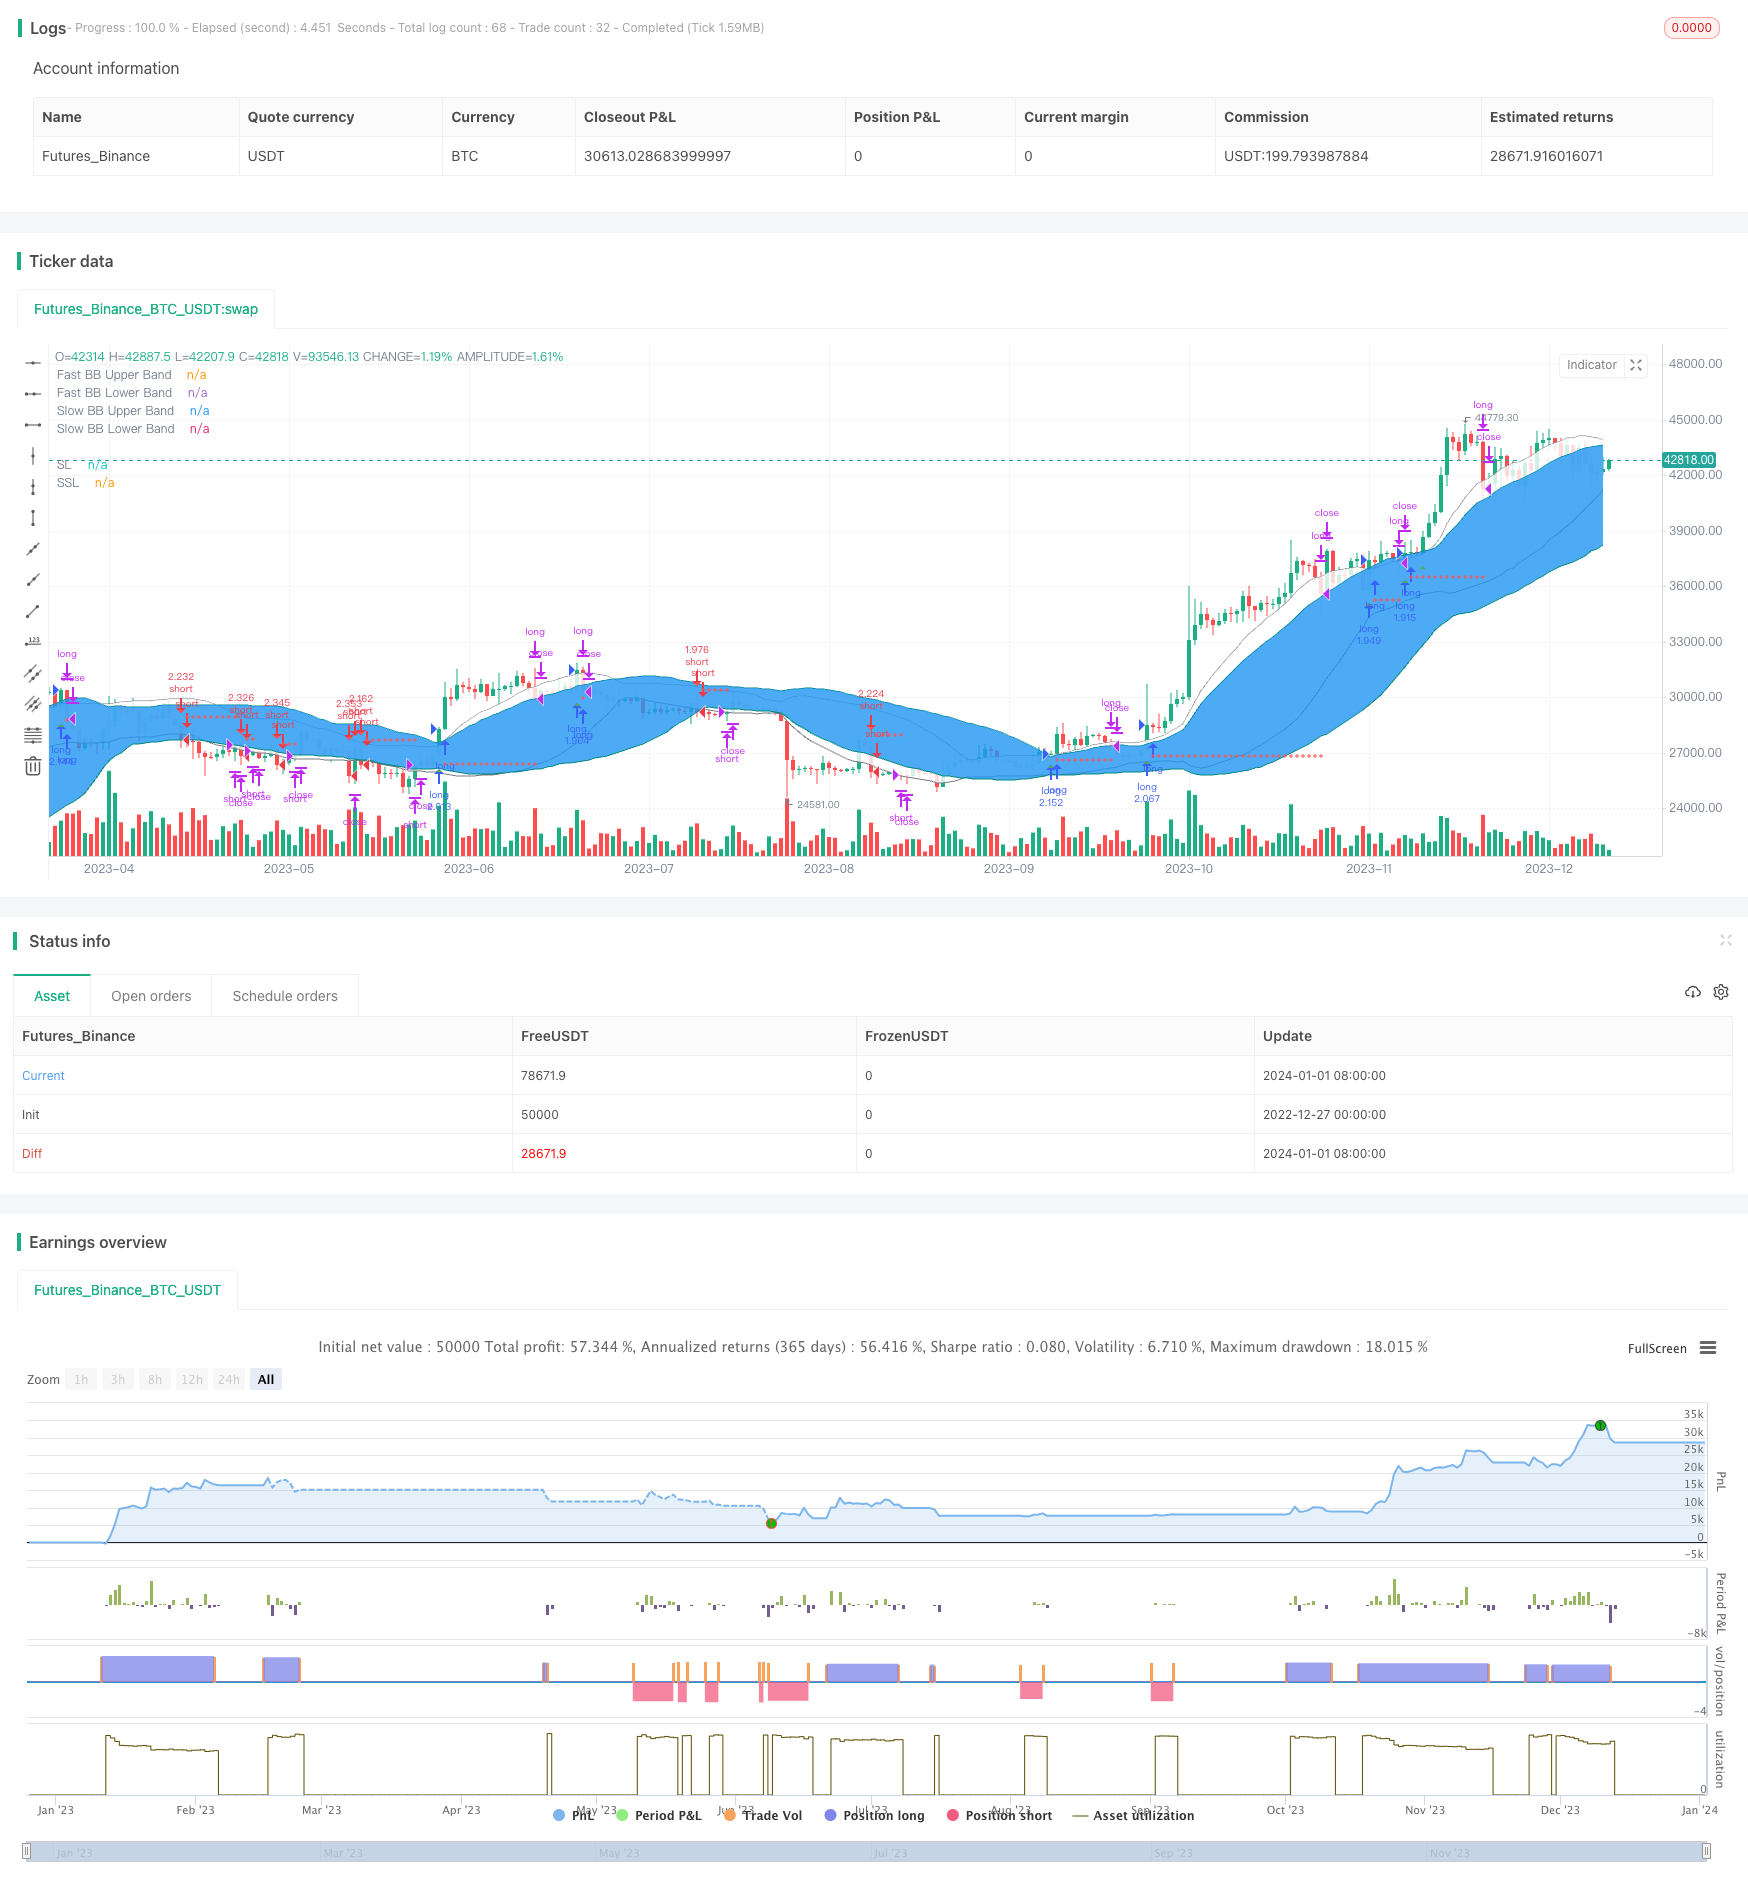
ڈبل لہر بینڈ کاٹنے کی حکمت عملی ایک لہر بینڈ اشارے کا استعمال کرتے ہوئے ایک مختصر لائن ٹریڈنگ حکمت عملی ہے۔ یہ ایک ہی وقت میں دو مختلف پیرامیٹرز کی ترتیب والے لہر بینڈ کا استعمال کرتا ہے ، تیز اور آہستہ ، تجارت کے مواقع کی تلاش میں جب لہر بینڈ اوپر یا نیچے کی طرف جاتا ہے۔
حکمت عملی کا اصول
یہ حکمت عملی ایک ہی وقت میں 20 اور 50 کی لمبائی کا استعمال کرتی ہے ، تیز رفتار اور سست اتار چڑھاؤ والی بینڈ ، جس میں معیاری فرق 1 ہے۔ جب اختتامی قیمت تیزی سے اتار چڑھاؤ والی بینڈ کو ٹریک کرتی ہے تو ، اس اختتامی قیمت کے ساتھ ایک کثیر پوزیشن میں داخل ہوتا ہے۔ جب اختتامی قیمت تیزی سے اتار چڑھاؤ والی بینڈ کو ٹریک کرتی ہے تو ، اس اختتامی قیمت کے ساتھ ایک خالی پوزیشن میں داخل ہوتا ہے۔
ایک بار پوزیشن میں داخل ہونے کے بعد ، حکمت عملی انتظار کرتی ہے کہ قیمت آہستہ آہستہ اتار چڑھاؤ کے بینڈ کو ٹریک کرنے یا ٹریک کرنے کے لئے آگے بڑھ جائے۔ اس کے علاوہ ، حکمت عملی رجحان کی سمت کا تعین کرنے کے لئے آر ایس آئی اشارے کے ساتھ مل کر کام کرتی ہے۔ صرف جب آر ایس آئی 50 سے زیادہ ہو تو ، خریدنے کے سگنل کو ٹریک کرنے پر غور کیا جائے گا۔ صرف جب آر ایس آئی 50 سے کم ہو تو ، بیچنے کے سگنل کو ٹریک کرنے پر غور کیا جائے گا۔
ایک پوزیشن قائم ہونے کے بعد ، اگر قیمت تیزی سے اتار چڑھاؤ کے بینڈ کو دوبارہ ٹریک یا نیچے کردیتی ہے تو ، اس کے مطابق کثیر سر یا خالی سر کی پوزیشنوں سے باہر نکل جاتا ہے۔
طاقت کا تجزیہ
ڈبل ویو بینڈ کٹوتی کی حکمت عملی کا فائدہ بنیادی طور پر چھوٹی حرکتوں کو پکڑنے کی صلاحیت میں ظاہر ہوتا ہے۔ تیز رفتار ویو بینڈ کے ذریعہ قیمتوں میں چھوٹی چھوٹی چھوٹی چھوٹی چھوٹی چھوٹی چھوٹی چھوٹی چھوٹی چھوٹی چھوٹی چھوٹی چھوٹی چھوٹی چھوٹی چھوٹی چھوٹی چھوٹی چھوٹی چھوٹی چھوٹی چھوٹی چھوٹی چھوٹی چھوٹی چھوٹی چھوٹی چھوٹی چھوٹی چھوٹی چھوٹی چھوٹی چھوٹی چھوٹی چھوٹی چھوٹی چھوٹی چھوٹی چھوٹی چھوٹی چھوٹی چھوٹی چھوٹی چھوٹی چھوٹی چھوٹی چھوٹی چھوٹی چھوٹی چھوٹی چھوٹی چھوٹی چھوٹی چھوٹی چھوٹی چھوٹی چھوٹی چھوٹی چھوٹی چھوٹی چھوٹی چھوٹی چھوٹی چھوٹی چھوٹی چھوٹی چھوٹی چھوٹی چھوٹی چھوٹی چھوٹی چھوٹی چھوٹی چھوٹی چھوٹی چھوٹی چھوٹی چھوٹی چھوٹی چھوٹی چھوٹی چھوٹی چھوٹی چھوٹی چھوٹی چھوٹی چھوٹی چھوٹی چھوٹی چھوٹی چھوٹی چھوٹی چھوٹی چھوٹی چھوٹی چھوٹی چھوٹی چھوٹی چھوٹی چھوٹی چھوٹی چھوٹی چھوٹی چھوٹی چھوٹی چھوٹی چھوٹی
اس کے علاوہ ، ڈبل لہر والے بینڈ خود ہی ایک متحرک اشارے کے طور پر ، اس بات کا اندازہ لگانے کے لئے بہت اچھا ہے کہ آیا مارکیٹ اس وقت اعلی متحرک مرحلے میں ہے یا نہیں ، جو ایک مختصر لائن ٹریڈنگ حکمت عملی کے لئے بہت فائدہ مند ہے۔
خطرے کا تجزیہ
اس حکمت عملی کا بنیادی خطرہ یہ ہے کہ دوہری لہر والے بینڈ سے پیدا ہونے والے تجارتی سگنل اتنے کثرت سے ہوسکتے ہیں کہ وہ مارکیٹ کے شور کو مؤثر طریقے سے فلٹر نہیں کرسکتے ہیں۔ اس سے بہت زیادہ غلط تجارت اور نقصانات جمع ہوجاتے ہیں۔ اس کے علاوہ ، کم رفتار کے مرحلے میں ، لہر والے بینڈ کی چوڑائی تنگ ہوجاتی ہے ، اور تجارت کے مواقع بھی کم ہوجاتے ہیں۔
خطرے کو کم کرنے کے لئے، آپ کو طول و عرض کے بینڈ پیرامیٹرز کو ایڈجسٹ کرنے پر غور کر سکتے ہیں، طویل عرصے سے سست رفتار طول و عرض کے بینڈ کا استعمال کرتے ہوئے، یا دستی طور پر سگنل کی تصدیق کریں. آپ کو دیگر تکنیکی اشارے، جیسے MACD، KDJ وغیرہ کے ساتھ مل کر، حکمت عملی کی استحکام کو بہتر بنانے کے لئے استعمال کیا جا سکتا ہے.
اصلاح کی سمت
اس حکمت عملی کے لئے اصلاح کی جگہ بنیادی طور پر اتار چڑھاؤ کے بینڈ پیرامیٹرز اور آر ایس آئی پیرامیٹرز کو ایڈجسٹ کرنے پر مرکوز ہے۔ مثال کے طور پر ، مختلف لمبائی کے ادوار کے لئے تیز اور سست اتار چڑھاؤ کے بینڈ پیرامیٹرز کی جانچ کی جاسکتی ہے تاکہ بہترین مجموعہ تلاش کیا جاسکے۔ یا مختلف لمبائی کے ادوار کے لئے آر ایس آئی اشارے کے پیرامیٹرز کی کوشش کریں تاکہ یہ دیکھا جاسکے کہ حکمت عملی کی کارکردگی کو بہتر بنایا جاسکتا ہے۔
ایک اور اصلاحی سمت یہ ہے کہ اسٹاپ لوجیک کو شامل یا ایڈجسٹ کیا جائے۔ موجودہ حکمت عملی میں اسٹاپ نقصان کی ترتیب نہیں ہے ، جس سے حکمت عملی کے زیادہ سے زیادہ واپسی کا خطرہ بڑھ جاتا ہے۔ مناسب طریقے سے مقررہ تناسب اسٹاپ یا ٹریکنگ اسٹاپ کو ترتیب دینے سے خطرے کی واپسی میں نمایاں طور پر بہتری آسکتی ہے۔
خلاصہ کریں۔
ڈبل لہر بینڈ کاٹنے کی حکمت عملی ایک مختصر لائن ٹریڈنگ حکمت عملی ہے جو مارکیٹ کی نقل و حرکت کے لئے حساس ہے۔ یہ اعلی اتار چڑھاؤ کے حالات میں قیمتوں کی معمولی نقل و حرکت کو پکڑ سکتا ہے اور جب ڈبل لہر بینڈ کے اشارے واضح سگنل دیتے ہیں تو تجارت کرتا ہے۔ تاہم ، اس حکمت عملی کی وشوسنییتا کو مزید جانچنا باقی ہے ، اور پیرامیٹرز کی اصلاح اور اسٹاپ لاسر منطق کے اضافے سے اس حکمت عملی کی استحکام کو مزید بہتر بنانے کی امید ہے۔
/*backtest
start: 2022-12-27 00:00:00
end: 2024-01-02 00:00:00
period: 1d
basePeriod: 1h
exchanges: [{"eid":"Futures_Binance","currency":"BTC_USDT"}]
*/

// This source code is subject to the terms of the Mozilla Public License 2.0 at https://mozilla.org/MPL/2.0/

// From "Bitcoin Trading Strategies: Algorithmic Trading Strategies For Bitcoin And Cryptocurrency That Work" by David Hanson.

// "Double Bolinger Band Scalping System
// Recommended Timeframe: 1 minute or 5 minute

// Required Indicators:
// - RSI with a length of 14 (default settings)
// - Bolinger band #1 settings: Length = 50, stDev = 1 Hide the basis/middle line (basis line not needed for this strategy)
// Note: This is the slower bolinger band in the directions
// - Bolinger band #2 settings: Length 20, stDev = 1 Hide the basis/middle line (basis line not needed for this strategy)
// Note: This is the faster bolinger band in the directions

// Enter Long/Buy Trade When:
// - RSI is above the level 50
// - A candle closes above the top of the faster bolinger band
// Enter a long when a candle then closes above the top of the slower bolinger band, and price is above the top of both bands
// Place a stop loss under the low of the entry candle Example of a long trade using this strategy
// Exit Long Trade When: A candle closes below the top band of the fast bolinger band

// Enter Short/Sell Trade When:
// - RSI is below the level 50
// - A candle closes below the bottom of the faster bolinger band
// Enter a short when a candle then closes below the bottom of the slower bolinger band, and price is below both bands
// Place a stop loss above the high of the entry candle Example of a short trade using this strategy
// Exit Short Trade When: Price closes inside the bottom of the faster bolinger band"

// © tweakerID

//@version=4
strategy("Double Bollinger Strategy",
     overlay=true,
     default_qty_type=strategy.percent_of_equity,
     default_qty_value=100,
     initial_capital=10000,
     commission_value=0.04,
     calc_on_every_tick=false,
     slippage=0)

direction = input(0, title = "Strategy Direction", type=input.integer, minval=-1, maxval=1)
strategy.risk.allow_entry_in(direction == 0 ? strategy.direction.all : (direction < 0 ? strategy.direction.short : strategy.direction.long))

/////////////////////// STRATEGY INPUTS ////////////////////////////////////////
title1=input(true, "-----------------Strategy Inputs-------------------")

i_RSI=input(14, title="RSI Length")
lengthS = input(45, minval=1, title="Slow BB Band Length")
lengthF = input(31, minval=1, title="Fast BB Band Length")

/////////////////////// BACKTESTER /////////////////////////////////////////////
title2=input(true, "-----------------General Inputs-------------------")

// Backtester General Inputs
i_SL=input(true, title="Use Stop Loss and Take Profit")
i_SLType=input(defval="Strategy Stop", title="Type Of Stop", options=["Strategy Stop", "Swing Lo/Hi", "ATR Stop"])
i_SPL=input(defval=10, title="Swing Point Lookback")
i_PercIncrement=input(defval=1, step=.1, title="Swing Point SL Perc Increment")*0.01
i_ATR = input(14, title="ATR Length")
i_ATRMult = input(5, step=.1, title="ATR Multiple")
i_TPRRR = input(2, step=.1, title="Take Profit Risk Reward Ratio")
TS=input(false, title="Trailing Stop")

// Bought and Sold Boolean Signal
bought = strategy.position_size > strategy.position_size[1]
 or strategy.position_size < strategy.position_size[1]

// Price Action Stop and Take Profit
LL=(lowest(i_SPL))*(1-i_PercIncrement)
HH=(highest(i_SPL))*(1+i_PercIncrement)
LL_price = valuewhen(bought, LL, 0)
HH_price = valuewhen(bought, HH, 0)
entry_LL_price = strategy.position_size > 0 ? LL_price : na
entry_HH_price = strategy.position_size < 0 ? HH_price : na
tp=strategy.position_avg_price + (strategy.position_avg_price - entry_LL_price)*i_TPRRR
stp=strategy.position_avg_price - (entry_HH_price - strategy.position_avg_price)*i_TPRRR

// ATR Stop
ATR=atr(i_ATR)*i_ATRMult
ATRLong = ohlc4 - ATR
ATRShort = ohlc4 + ATR
ATRLongStop = valuewhen(bought, ATRLong, 0)
ATRShortStop = valuewhen(bought, ATRShort, 0)
LongSL_ATR_price = strategy.position_size > 0 ? ATRLongStop : na
ShortSL_ATR_price = strategy.position_size < 0 ? ATRShortStop : na
ATRtp=strategy.position_avg_price + (strategy.position_avg_price - LongSL_ATR_price)*i_TPRRR
ATRstp=strategy.position_avg_price - (ShortSL_ATR_price - strategy.position_avg_price)*i_TPRRR


// Strategy Stop
float LongStop = valuewhen(bought,low[1],0)*(1-i_PercIncrement)
float ShortStop = valuewhen(bought,high[1],0)*(1+i_PercIncrement)
float StratTP = na
float StratSTP = na

/////////////////////// STRATEGY LOGIC /////////////////////////////////////////

//RSI
RSI=rsi(close, i_RSI)

//BOLL1
[middleS, upperS, lowerS] = bb(close, lengthS, 1)
p1 = plot(upperS, "Slow BB Upper Band", color=color.teal)
p2 = plot(lowerS, "Slow BB Lower Band", color=color.teal)
fill(p1, p2, title = "Slow BB Background", color=color.blue, transp=95)

//BOLL2
[middleF, upperF, lowerF] = bb(close, lengthF, 1)
p1F = plot(upperF, "Fast BB Upper Band", color=color.gray)
p2F = plot(lowerF, "Fast BB Lower Band", color=color.gray)
fill(p1F, p2F, title = "Fast BB Background", color=color.white, transp=95)


BUY = bar_index > 40 and (RSI > 50) and (close > upperF) and crossover(close, upperS)
SELL = bar_index > 40 and (RSI < 50) and (close < lowerF) and crossunder(close, lowerS)

longexit=close < upperF
shortexit=close > lowerF

//Trading Inputs
i_strategyClose=input(true, title="Use Strategy Close Logic")
DPR=input(true, "Allow Direct Position Reverse")
reverse=input(false, "Reverse Trades")

// Entries
if reverse
    if not DPR
        strategy.entry("long", strategy.long, when=SELL and strategy.position_size == 0)
        strategy.entry("short", strategy.short, when=BUY and strategy.position_size == 0)
    else
        strategy.entry("long", strategy.long, when=SELL)
        strategy.entry("short", strategy.short, when=BUY)
else
    if not DPR
        strategy.entry("long", strategy.long, when=BUY and strategy.position_size == 0)
        strategy.entry("short", strategy.short, when=SELL and strategy.position_size == 0)
    else
        strategy.entry("long", strategy.long, when=BUY)
        strategy.entry("short", strategy.short, when=SELL)

if i_strategyClose
    strategy.close("long", when=longexit)
    strategy.close("short", when=shortexit)


SL= i_SLType == "Swing Lo/Hi" ? entry_LL_price : i_SLType == "ATR Stop" ? LongSL_ATR_price : LongStop
SSL= i_SLType == "Swing Lo/Hi" ? entry_HH_price : i_SLType == "ATR Stop" ? ShortSL_ATR_price : ShortStop
TP= i_SLType == "Swing Lo/Hi" ? tp : i_SLType == "ATR Stop" ? ATRtp : StratTP
STP= i_SLType == "Swing Lo/Hi" ? stp : i_SLType == "ATR Stop" ? ATRstp : StratSTP

//TrailingStop
dif=(valuewhen(strategy.position_size>0 and strategy.position_size[1]<=0, high,0))
 -strategy.position_avg_price
trailOffset     = strategy.position_avg_price - SL
var tstop = float(na)
if strategy.position_size > 0
    tstop := high- trailOffset - dif
    if tstop<tstop[1]
        tstop:=tstop[1]
else
    tstop := na
StrailOffset     = SSL - strategy.position_avg_price
var Ststop = float(na)
Sdif=strategy.position_avg_price-(valuewhen(strategy.position_size<0
 and strategy.position_size[1]>=0, low,0))
if strategy.position_size < 0
    Ststop := low+ StrailOffset + Sdif
    if Ststop>Ststop[1]
        Ststop:=Ststop[1]
else
    Ststop := na

strategy.exit("TP & SL", "long", limit=TP, stop=TS? tstop : SL, when=i_SL)
strategy.exit("TP & SL", "short", limit=STP, stop=TS? Ststop : SSL, when=i_SL)

/////////////////////// PLOTS //////////////////////////////////////////////////


plot(i_SL and strategy.position_size > 0 and not TS ? SL : i_SL and strategy.position_size > 0 and TS ? tstop : na , title='SL', style=plot.style_cross, color=color.red)
plot(i_SL and strategy.position_size < 0 and not TS ? SSL : i_SL and strategy.position_size < 0 and TS ? Ststop : na , title='SSL', style=plot.style_cross, color=color.red)
plot(i_SL and strategy.position_size > 0 ? TP : na, title='TP', style=plot.style_cross, color=color.green)
plot(i_SL and strategy.position_size < 0 ? STP : na, title='STP', style=plot.style_cross, color=color.green)
// Draw price action setup arrows
plotshape(BUY ? 1 : na, style=shape.triangleup, location=location.belowbar,
 color=color.green, title="Bullish Setup", size=size.auto)
plotshape(SELL ? 1 : na, style=shape.triangledown, location=location.abovebar,
 color=color.red, title="Bearish Setup", size=size.auto)