بریک آؤٹ اور اسمارٹ ریورسل بولنگر بینڈز پرائس چینل کی حکمت عملی
جائزہ
یہ حکمت عملی ایک بریکآؤٹ حکمت عملی ہے جس میں ایک سے زیادہ ٹائم رینج (ایک منٹ ، پانچ منٹ ، پندرہ منٹ ، ایک گھنٹہ اور چار گھنٹے) کا استعمال کیا جاتا ہے ، جو چارٹ پر حمایت اور مزاحمت کے علاقوں کا پتہ لگاتا ہے۔
حکمت عملی کا اصول
یہ حکمت عملی سپورٹ اور مزاحمت کے علاقوں کی نشاندہی کرنے کے لئے برن بینڈ اور پرائس چینلز کا استعمال کرتی ہے۔ پہلے ، اس نے ہر ٹائم فریم کے اختتامی قیمتوں کے مطابق ایک سادہ حرکت پذیر اوسط ((SMA) اور معیاری فرق ((STDEV) کا حساب لگایا ، تاکہ اس کے اوپر اور نیچے کا تعین کیا جاسکے۔ اس کے بعد ، اس نے ایک خرابی کا پتہ لگایا۔
ایک بار بریک چوکوں کا پتہ لگنے کے بعد ، اگر قیمت ٹریک سے ٹکرا جائے تو خریدنے کا اشارہ پیدا ہوتا ہے۔ اگر ٹریک سے ٹکرا جائے تو بیچنے کا اشارہ پیدا ہوتا ہے۔ یہ حکمت عملی ہر ٹائم فریم کے لئے قیمتوں کے چینلز کا نقشہ بھی بناتی ہے ، جس سے حمایت اور مزاحمت کی سطح ظاہر ہوتی ہے۔
اس کے علاوہ ، اس حکمت عملی میں ہر ٹائم فریم کے لئے اسٹاپ لمیٹڈ لیولز مرتب کیے گئے ہیں۔ اس کا مطلب یہ ہے کہ پوزیشنوں کے لئے مقرر کردہ قیمت کی سطح کو منافع بخش طریقے سے ختم کیا جانا چاہئے۔ اس کے علاوہ ، نقصان کو محدود کرنے کے لئے اسٹاپ لمیٹڈ لیولز بھی مرتب کیے گئے ہیں۔
طاقت کا تجزیہ
- کثیر ٹائم اسپین تجزیہ کا استعمال کرتے ہوئے مارکیٹ کے رجحانات کا زیادہ جامع اندازہ لگانا
- بریک چوکوں ، برین بینڈ چینلز اور ٹرانزیکشن حجم کے ساتھ مل کر سگنل کو زیادہ قابل اعتماد بناتا ہے
- خطرے کو کنٹرول کرنے میں مدد کے لئے اسٹاپ نقصان کی ترتیب
خطرے کا تجزیہ
- غلط طور پر مقرر کردہ برن بینڈ پیرامیٹرز غلط سگنل کا سبب بن سکتے ہیں
- ایک بریک ایک قلیل مدتی مارکیٹ شور ہوسکتا ہے ، جس سے قید خانے کا خطرہ ہوتا ہے۔
- ایک سے زیادہ ٹائم فریم کے فیصلے حکمت عملی کی پیچیدگی میں اضافہ کرتے ہیں
برین بینڈ پیرامیٹرز کو بہتر بنانے ، ہولڈنگ ٹائم بڑھانے یا اسٹاپ نقصان کو ترتیب دے کر مزید خطرے سے بچنے کے لئے۔
اصلاح کی سمت
اس حکمت عملی کو مندرجہ ذیل پہلوؤں سے بہتر بنایا جاسکتا ہے:
بلین بینڈ پیرامیٹرز کو بہتر بنانے کے لئے بہتر حمایت اور مزاحمت کی عکاسی کرنے کے لئے
مشین لرننگ الگورتھم میں اضافے کے ذریعہ ان کی سمت اور طاقت کا اندازہ لگانا
اسٹاک کی قیمتوں میں اتار چڑھاؤ کے اشارے میں اضافہ کرکے خرید و فروخت کے بہترین اوقات کا تعین کیا جائے
رجحانات اور توانائی کا تعین کرنے کے لئے MACD، KD اور مزید اشارے شامل کریں
خلاصہ کریں۔
اس حکمت عملی میں کثیر ٹائم اسپینڈ ٹیکنیکل اشارے تجزیہ شامل ہے ، جس میں بریک ٹریڈنگ ، اسٹاپ اسٹاپ نقصان کے ذریعہ خطرے کا انتظام کیا جاتا ہے۔ یہ ایک لچکدار اور قابل اعتماد بریک سسٹم ٹریڈنگ حکمت عملی ہے۔ تاہم ، پیرامیٹرز کی ترتیب اور خطرے کے کنٹرول کو حقیقی مارکیٹ کے مطابق مسلسل جانچ اور اصلاح کی ضرورت ہے۔
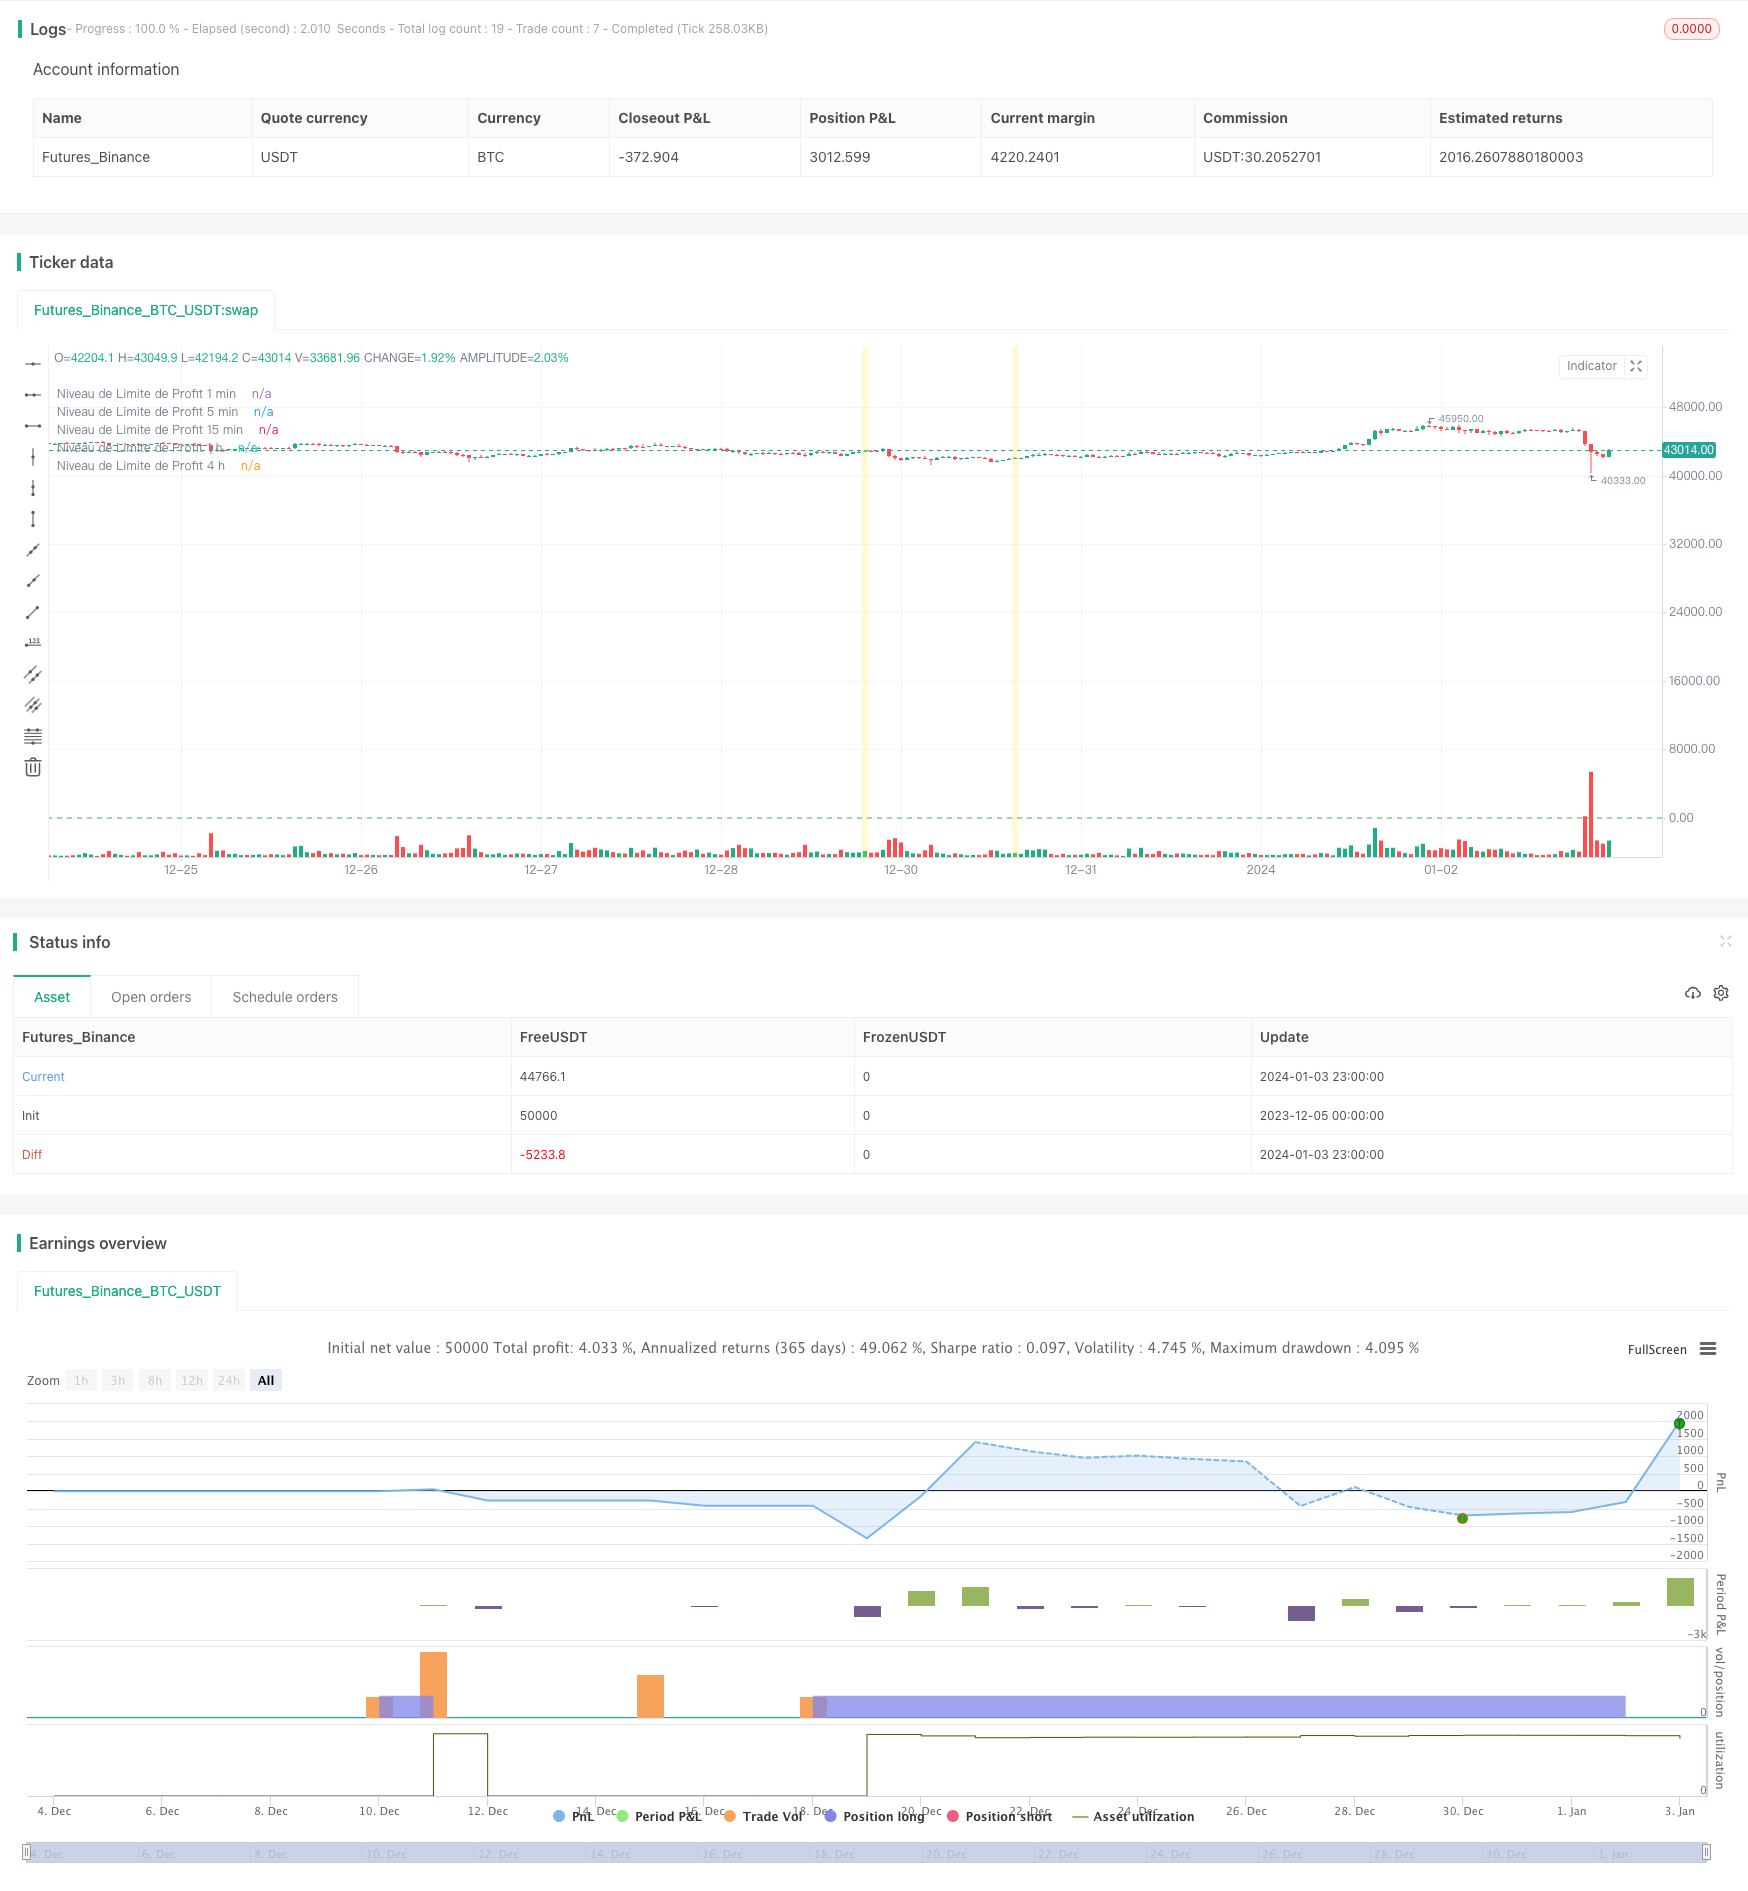
/*backtest
start: 2023-12-05 00:00:00
end: 2024-01-04 00:00:00
period: 1h
basePeriod: 15m
exchanges: [{"eid":"Futures_Binance","currency":"BTC_USDT"}]
*/

//@version=5
strategy("DZ Strategy ICT", overlay=true)

// Paramètres de l'indicateur
length1 = input.int(14, minval=1, title='Longueur 1 min')
deviations1 = input.float(2.0, title='Déviations 1 min')
multiplier1 = input.float(1.0, minval=0.1, maxval=10, title='Multiplicateur 1 min')
fibonacciLevel1 = input.float(0.618, title='Niveau de Fibonacci 1 min')
displacement1 = input.int(3, minval=1, title='Décalage de Displacement 1 min')
volumeThreshold1 = input.float(1.0, minval=0, title='Seuil de Volume 1 min')
fibLevelInput1 = input.float(0.0, "Niveau de Limite de Profit 1 min", minval=0.0)

length5 = input.int(14, minval=1, title='Longueur 5 min')
deviations5 = input.float(2.0, title='Déviations 5 min')
multiplier5 = input.float(1.0, minval=0.1, maxval=10, title='Multiplicateur 5 min')
fibonacciLevel5 = input.float(0.618, title='Niveau de Fibonacci 5 min')
displacement5 = input.int(3, minval=1, title='Décalage de Displacement 5 min')
volumeThreshold5 = input.float(1.0, minval=0, title='Seuil de Volume 5 min')
fibLevelInput5 = input.float(0.0, "Niveau de Limite de Profit 5 min", minval=0.0)

length15 = input.int(14, minval=1, title='Longueur 15 min')
deviations15 = input.float(2.0, title='Déviations 15 min')
multiplier15 = input.float(1.0, minval=0.1, maxval=10, title='Multiplicateur 15 min')
fibonacciLevel15 = input.float(0.618, title='Niveau de Fibonacci 15 min')
displacement15 = input.int(3, minval=1, title='Décalage de Displacement 15 min')
volumeThreshold15 = input.float(1.0, minval=0, title='Seuil de Volume 15 min')
fibLevelInput15 = input.float(0.0, "Niveau de Limite de Profit 15 min", minval=0.0)

length60 = input.int(14, minval=1, title='Longueur 1 h')
deviations60 = input.float(2.0, title='Déviations 1 h')
multiplier60 = input.float(1.0, minval=0.1, maxval=10, title='Multiplicateur 1 h')
fibonacciLevel60 = input.float(0.618, title='Niveau de Fibonacci 1 h')
displacement60 = input.int(3, minval=1, title='Décalage de Displacement 1 h')
volumeThreshold60 = input.float(1.0, minval=0, title='Seuil de Volume 1 h')
fibLevelInput60 = input.float(0.0, "Niveau de Limite de Profit 1 h", minval=0.0)

length240 = input.int(14, minval=1, title='Longueur 4 h')
deviations240 = input.float(2.0, title='Déviations 4 h')
multiplier240 = input.float(1.0, minval=0.1, maxval=10, title='Multiplicateur 4 h')
fibonacciLevel240 = input.float(0.618, title='Niveau de Fibonacci 4 h')
displacement240 = input.int(3, minval=1, title='Décalage de Displacement 4 h')
volumeThreshold240 = input.float(1.0, minval=0, title='Seuil de Volume 4 h')
fibLevelInput240 = input.float(0.0, "Niveau de Limite de Profit 4 h", minval=0.0)

// Calcul des supports et résistances pour chaque plage de temps
basis1 = ta.sma(close, length1)
range_1 = multiplier1 * ta.stdev(close, length1)
upper1 = basis1 + deviations1 * range_1
lower1 = basis1 - deviations1 * range_1

basis5 = ta.sma(close, length5)
range_5 = multiplier5 * ta.stdev(close, length5)
upper5 = basis5 + deviations5 * range_5
lower5 = basis5 - deviations5 * range_5

basis15 = ta.sma(close, length15)
range_15 = multiplier15 * ta.stdev(close, length15)
upper15 = basis15 + deviations15 * range_15
lower15 = basis15 - deviations15 * range_15

basis60 = ta.sma(close, length60)
range_60 = multiplier60 * ta.stdev(close, length60)
upper60 = basis60 + deviations60 * range_60
lower60 = basis60 - deviations60 * range_60

basis240 = ta.sma(close, length240)
range_240 = multiplier240 * ta.stdev(close, length240)
upper240 = basis240 + deviations240 * range_240
lower240 = basis240 - deviations240 * range_240

// Calcul du volume moyen sur chaque période donnée
averageVolume1 = ta.sma(volume, length1)
averageVolume5 = ta.sma(volume, length5)
averageVolume15 = ta.sma(volume, length15)
averageVolume60 = ta.sma(volume, length60)
averageVolume240 = ta.sma(volume, length240)

// Détection du Breaker Block en fonction du déplacement et du volume pour chaque plage de temps
breakerBlock1 = ta.crossover(close[displacement1], lower1) and volume > volumeThreshold1 * averageVolume1
breakerBlock1 := breakerBlock1 or (ta.crossunder(close[displacement1], upper1) and volume > volumeThreshold1 * averageVolume1)

breakerBlock5 = ta.crossover(close[displacement5], lower5) and volume > volumeThreshold5 * averageVolume5
breakerBlock5 := breakerBlock5 or (ta.crossunder(close[displacement5], upper5) and volume > volumeThreshold5 * averageVolume5)

breakerBlock15 = ta.crossover(close[displacement15], lower15) and volume > volumeThreshold15 * averageVolume15
breakerBlock15 := breakerBlock15 or (ta.crossunder(close[displacement15], upper15) and volume > volumeThreshold15 * averageVolume15)

breakerBlock60 = ta.crossover(close[displacement60], lower60) and volume > volumeThreshold60 * averageVolume60
breakerBlock60 := breakerBlock60 or (ta.crossunder(close[displacement60], upper60) and volume > volumeThreshold60 * averageVolume60)

breakerBlock240 = ta.crossover(close[displacement240], lower240) and volume > volumeThreshold240 * averageVolume240
breakerBlock240 := breakerBlock240 or (ta.crossunder(close[displacement240], upper240) and volume > volumeThreshold240 * averageVolume240)

// Affichage du Breaker Block sur le graphique
bgcolor(breakerBlock1 ? color.new(color.yellow, 70) : na)
bgcolor(breakerBlock5 ? color.new(color.yellow, 70) : na)
bgcolor(breakerBlock15 ? color.new(color.yellow, 70) : na)
bgcolor(breakerBlock60 ? color.new(color.yellow, 70) : na)
bgcolor(breakerBlock240 ? color.new(color.yellow, 70) : na)

// Définition de la zone limite de l'ordre de profit pour chaque plage de temps
fibLevel1 = basis1 * fibonacciLevel1
fibLevel5 = basis5 * fibonacciLevel5
fibLevel15 = basis15 * fibonacciLevel15
fibLevel60 = basis60 * fibonacciLevel60
fibLevel240 = basis240 * fibonacciLevel240

// Signal d'achat modifié en fonction du Breaker Block et du déplacement pour chaque plage de temps
buySignal1 = ta.crossover(close[displacement1], lower1) and volume > volumeThreshold1 * averageVolume1
buySignal5 = ta.crossover(close[displacement5], lower5) and volume > volumeThreshold5 * averageVolume5
buySignal15 = ta.crossover(close[displacement15], lower15) and volume > volumeThreshold15 * averageVolume15
buySignal60 = ta.crossover(close[displacement60], lower60) and volume > volumeThreshold60 * averageVolume60
buySignal240 = ta.crossover(close[displacement240], lower240) and volume > volumeThreshold240 * averageVolume240

// Signal de vente modifié en fonction du Breaker Block et du déplacement pour chaque plage de temps
sellSignal1 = ta.crossunder(close[displacement1], upper1) and volume > volumeThreshold1 * averageVolume1
sellSignal5 = ta.crossunder(close[displacement5], upper5) and volume > volumeThreshold5 * averageVolume5
sellSignal15 = ta.crossunder(close[displacement15], upper15) and volume > volumeThreshold15 * averageVolume15
sellSignal60 = ta.crossunder(close[displacement60], upper60) and volume > volumeThreshold60 * averageVolume60
sellSignal240 = ta.crossunder(close[displacement240], upper240) and volume > volumeThreshold240 * averageVolume240


// Tracé des niveaux de limite de profit pour chaque plage de temps
hline(fibLevelInput1, color=color.green, linestyle=hline.style_dashed, title="Niveau de Limite de Profit 1 min")
hline(fibLevelInput5, color=color.green, linestyle=hline.style_dashed, title="Niveau de Limite de Profit 5 min")
hline(fibLevelInput15, color=color.green, linestyle=hline.style_dashed, title="Niveau de Limite de Profit 15 min")
hline(fibLevelInput60, color=color.green, linestyle=hline.style_dashed, title="Niveau de Limite de Profit 1 h")
hline(fibLevelInput240, color=color.green, linestyle=hline.style_dashed, title="Niveau de Limite de Profit 4 h")

// Définition des ordres de vente et d'achat pour chaque plage de temps
if buySignal1
    strategy.entry("Achat 1 min", strategy.long)

if sellSignal1
    strategy.entry("Vente 1 min", strategy.short)

if buySignal5
    strategy.entry("Achat 5 min", strategy.long)

if sellSignal5
    strategy.entry("Vente 5 min", strategy.short)

if buySignal15
    strategy.entry("Achat 15 min", strategy.long)

if sellSignal15
    strategy.entry("Vente 15 min", strategy.short)

if buySignal60
    strategy.entry("Achat 1 h", strategy.long)

if sellSignal60
    strategy.entry("Vente 1 h", strategy.short)

if buySignal240
    strategy.entry("Achat 4 h", strategy.long)

if sellSignal240
    strategy.entry("Vente 4 h", strategy.short)

// Configuration des ordres de sortie (Take Profit) pour chaque plage de temps
profitRatio = 2
stopLossRatio = 1

stopLossLevel1 = strategy.position_avg_price * (1 - stopLossRatio / (stopLossRatio + profitRatio))
stopLossLevel5 = strategy.position_avg_price * (1 - stopLossRatio / (stopLossRatio + profitRatio))
stopLossLevel15 = strategy.position_avg_price * (1 - stopLossRatio / (stopLossRatio + profitRatio))
stopLossLevel60 = strategy.position_avg_price * (1 - stopLossRatio / (stopLossRatio + profitRatio))
stopLossLevel240 = strategy.position_avg_price * (1 - stopLossRatio / (stopLossRatio + profitRatio))

strategy.exit("Stop Loss 1 min", "Achat 1 min", stop=stopLossLevel1)
strategy.exit("Stop Loss 1 min", "Vente 1 min", stop=stopLossLevel1)

strategy.exit("Stop Loss 5 min", "Achat 5 min", stop=stopLossLevel5)
strategy.exit("Stop Loss 5 min", "Vente 5 min", stop=stopLossLevel5)

strategy.exit("Stop Loss 15 min", "Achat 15 min", stop=stopLossLevel15)
strategy.exit("Stop Loss 15 min", "Vente 15 min", stop=stopLossLevel15)

strategy.exit("Stop Loss 1 h", "Achat 1 h", stop=stopLossLevel60)
strategy.exit("Stop Loss 1 h", "Vente 1 h", stop=stopLossLevel60)