ماہانہ واپسی کی کارکردگی کی حکمت عملی
جائزہ
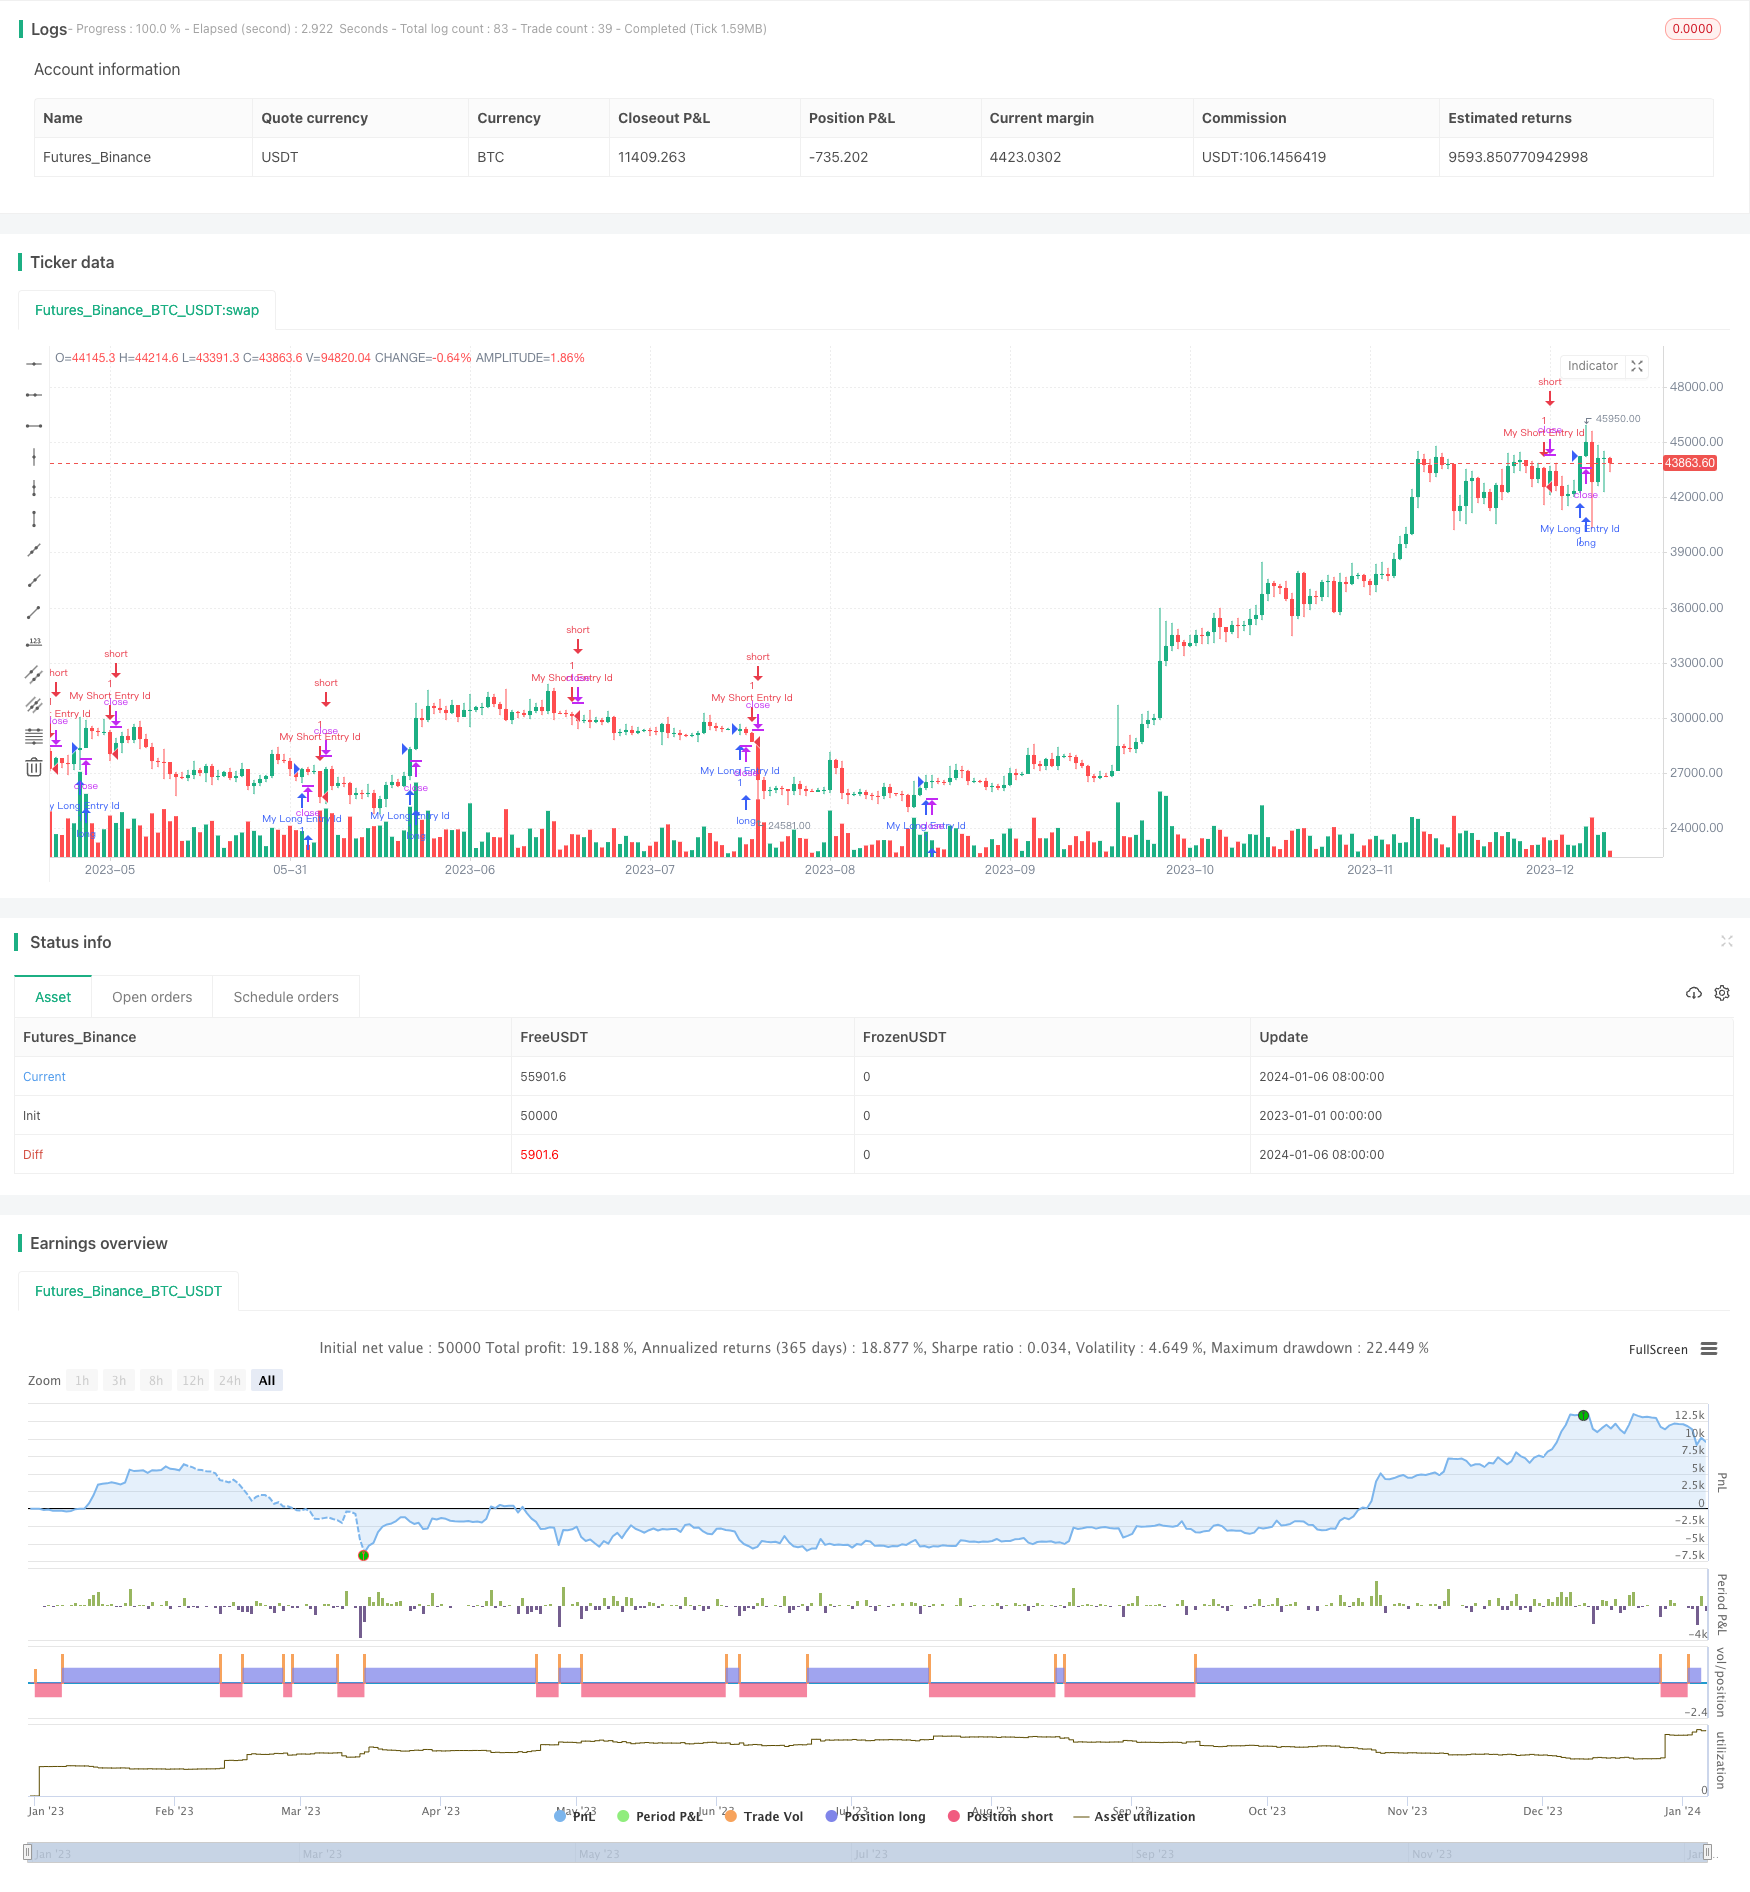
اس حکمت عملی کا بنیادی فنکشن ہر ماہ کی آمدنی کی کارکردگی کو اصل وقت میں ٹریک اور ظاہر کرنا ہے۔ یہ ایک ٹیبل میں ہر ماہ کی اصل آمدنی اور نقصان کو اپ ڈیٹ کرتا ہے۔
اصول
اس حکمت عملی میں ماہانہ آمدنی کی کارکردگی کو درج ذیل مراحل کے ذریعے ٹریک کیا گیا ہے۔
- متغیر کی وضاحت کریں کہ آیا اس مہینے میں کوئی تجارت غیر مساوی ہے یا نہیں۔
- متغیر ریکارڈ ماہانہ مخصوص منافع اور نقصان کی مقدار کی وضاحت کریں.
- متغیر ریکارڈ وقت کے مطابق مہینے کی وضاحت کریں۔
- جب اس مہینے میں کوئی کھلی پوزیشن ہو تو ، اس مہینے کے منافع اور نقصان کو اس مہینے کے مطابق صف میں ریکارڈ کریں۔
- ٹیبل میں دی گئی جگہ پر مہینے کا عنوان دکھائیں۔
- مہینے کے دوران منافع اور نقصان کی صف ، ٹیبل میں اسی مہینے کے لئے منافع اور نقصان کی قیمت ظاہر کریں۔
- اس کے ساتھ ساتھ متعلقہ سال کی معلومات بھی دکھائی جاتی ہیں۔
- سالانہ منافع اور نقصان کا خلاصہ۔
- رنگوں کا استعمال کرتے ہوئے منافع اور نقصان کا مثبت منفی
یہ اس حکمت عملی کے بنیادی اقدامات اور اس کے کام کرنے کے اصول ہیں۔
طاقت کا تجزیہ
ماہانہ منافع اور نقصان کی اس حکمت عملی کے کچھ فوائد ہیں:
- ریئل ٹائم اپ ڈیٹس، آپ کو ماہانہ منافع اور نقصان کی تازہ ترین معلومات کسی بھی وقت مل سکتی ہیں۔
- اس کے علاوہ، یہ ایک سادہ اور آسان طریقہ ہے جس میں آپ کو ہر مہینے کے منافع اور نقصان کو ظاہر کرنے کے لئے استعمال کیا جا سکتا ہے.
- اس کے علاوہ، اس میں بہت سے ایسے عناصر بھی ہیں جن کی مدد سے آپ ہر مہینے کی تفصیلات واضح طور پر دیکھ سکتے ہیں۔
- انٹرو موازنہ کے لئے ، رنگوں کا استعمال کرنا مہینے کے منافع اور نقصان کا موازنہ کرنے کے لئے زیادہ بدیہی ہے۔
- صدارتی الیکشن کے بعد ، ہر سال کے منافع اور نقصان کی مجموعی معلومات فراہم کی جاتی ہیں۔
- اپنی مرضی کے مطابق ڈسپلے، آپ کو میز کی پوزیشن، سائز وغیرہ کو ایڈجسٹ کر سکتے ہیں.
خطرے کا تجزیہ
اس حکمت عملی کے کچھ خطرات بھی ہیں:
- حساب کتاب کی منطق پیچیدہ ہے اور غلطیوں سے اعداد و شمار کی غلطیاں ہوتی ہیں۔
- اس طرح کی تبدیلیوں سے کارکردگی متاثر ہوسکتی ہے۔
- سیٹ ڈیٹا اسٹوریج کی کم کارکردگی۔
- وقت اور مہینے کے تبادلوں کا حساب غلط ہو سکتا ہے۔
مندرجہ ذیل طریقوں سے خطرے کو کم کیا جا سکتا ہے:
- کوڈ کی سخت جانچ پڑتال، اس بات کا یقین کرنے کے لئے کہ حساب کی منطق درست ہے.
- فارم کی تازہ کاری کی تعدد کو بہتر بنائیں اور اس سے زیادہ تازہ کاری کو روکیں۔
- زیادہ موثر ڈیٹا اسٹوریج ڈھانچے کو تبدیل کریں۔
- وقت اور مہینے کے تبادلوں کو شامل کرنے کی غیر معمولی کارروائی
حکمت عملی کی اصلاح
اس حکمت عملی کو مندرجہ ذیل پہلوؤں سے بہتر بنایا جاسکتا ہے:
- مہینے کے اعداد و شمار کو ذخیرہ کرنے کے لئے لغت جیسے زیادہ موثر ڈیٹا ڈھانچے کا استعمال کریں۔
- سالانہ آمدنی کی شرح میں اضافے کا حساب۔
- بڑھتی ہوئی اتار چڑھاؤ اور دیگر پیمائش کے اشارے۔
- آمدنی کے منحنی خطوط کو دکھائیں۔
- اپنی مرضی کے مطابق شروع اور اختتام کے اعدادوشمار کی مدت کی حمایت کریں.
- CSV فائلوں کو ڈیٹا برآمد کرنے کی حمایت کرتا ہے.
ان اصلاحات سے حکمت عملی کی کارکردگی بہتر اور زیادہ طاقتور ہوتی ہے اور صارف کا تجربہ بہتر ہوتا ہے۔
خلاصہ کریں۔
اس حکمت عملی کا استعمال ایک صف اور ٹیبل کے انداز میں کیا جاتا ہے ، جس سے ماہانہ آمدنی کی اصل وقت کی نگرانی اور نمائش کی بنیادی صلاحیت کو حاصل کیا جاسکتا ہے۔ یہ آسان ، موثر اور استعمال میں آسان ہے۔ اس کے ساتھ ساتھ کچھ فوائد بھی ہیں ، لیکن کچھ خطرات سے بچنے کی بھی ضرورت ہے۔ اس حکمت عملی کو کچھ کمپیوٹنگ منطق اور کارکردگی کی اصلاح کے ذریعہ زیادہ کامل اور طاقتور بنایا جاسکتا ہے۔
/*backtest
start: 2023-01-01 00:00:00
end: 2024-01-07 00:00:00
period: 1d
basePeriod: 1h
exchanges: [{"eid":"Futures_Binance","currency":"BTC_USDT"}]
*/

// This source code is subject to the terms of the Mozilla Public License 2.0 at https://mozilla.org/MPL/2.0/
// © MAURYA_ALGO_TRADER

//@version=5
strategy("Monthly Performance", overlay=true)

period = input(20, "Length")

longCondition =   close > high[20]  //ta.crossover(ta.sma(close, 14), ta.sma(close, 28))
if (longCondition)
    strategy.entry("My Long Entry Id", strategy.long)

shortCondition = close < low[20]  //ta.crossunder(ta.sma(close, 14), ta.sma(close, 28))
if (shortCondition)
    strategy.entry("My Short Entry Id", strategy.short)


// Copy below code to end of the desired strategy script
///////////////////////////////////////////////////////////////////////////////////////////////////////////////////////
//                                 monthly pnl performance  by Dr. Maurya @MAURYA_ALGO_TRADER                        //
///////////////////////////////////////////////////////////////////////////////////////////////////////////////////////
show_performance = input.bool(true, 'Show Monthly Monthly Performance ?', group='Monthly Performance')

dash_loc_mp = input("Bottom Right","Location"  ,options=["Top Right","Bottom Right","Top Left","Bottom Left", "Middle Right","Bottom Center"]  ,group='Monthly Performance', inline = "performance")

text_size_mp = input('Small',"Size"  ,options=["Tiny","Small","Normal","Large"]  ,group='Monthly Performance', inline = "performance")

var table_position_mp = dash_loc_mp == 'Top Left' ? position.top_left :
  dash_loc_mp == 'Bottom Left' ? position.bottom_left :
  dash_loc_mp == 'Middle Right' ? position.middle_right :
  dash_loc_mp == 'Bottom Center' ? position.bottom_center :
  dash_loc_mp == 'Top Right' ? position.top_right : position.bottom_right

var table_text_size_mp = text_size_mp == 'Tiny' ? size.tiny :
  text_size_mp == 'Small' ? size.small :
  text_size_mp == 'Normal' ? size.normal : size.large

/////////////////
text_c = color.white

/////////////////////////////////////////////

// var bool new_month = na
new_month = ta.change(month) //> 0 ? true : false
newest_month = new_month and strategy.closedtrades >= 1
strategy.initial_capital = 50000
// profit
only_profit = strategy.netprofit
initial_balance = strategy.initial_capital

// month number
var int month_number = na
month_number := (ta.valuewhen(newest_month, month(time), 0)) //and month(time) > 1 ? (ta.valuewhen(newest_month, month(time), 0) - 1) :  12 //1 to 12

//month_year
var int month_time = na
month_time := ta.valuewhen(newest_month, time, 0) - 2419200000


var int m_counter = 0
if newest_month
    m_counter += 1


// current month values
var bool new_year = na
new_year := ta.change(year)
curr_m_pnl = only_profit - nz(ta.valuewhen(newest_month, only_profit, 0), 0)
curr_m_number = newest_month ? ta.valuewhen(newest_month, month(time), 0) : month(time)
curr_y_pnl = (only_profit - nz(ta.valuewhen(new_year, only_profit, 0),0))


var float [] net_profit_array = array.new_float()
var int [] month_array = array.new_int()
var int [] month_time_array = array.new_int()


if newest_month
    array.push(net_profit_array, only_profit)
    array.push(month_array, month_number)
    array.push(month_time_array, month_time)


var float [] y_pnl_array = array.new_float()
var int [] y_number_array = array.new_int()
var int [] y_time_array = array.new_int()

newest_year = ta.change(year) and strategy.closedtrades >= 1
get_yearly_pnl = nz(ta.valuewhen(newest_year, strategy.netprofit, 0) - nz(ta.valuewhen(newest_year, strategy.netprofit, 1), 0), 0)
get_m_year = ta.valuewhen(newest_year, year(time), 1)
get_y_time = ta.valuewhen(newest_year, time, 0)

if newest_year
    array.push(y_pnl_array, get_yearly_pnl)
    array.push(y_number_array, get_m_year)
    array.push(y_time_array, get_y_time)
var float monthly_profit = na
var int column_month_number = na
var int row_month_time = na


var testTable = table.new(position = table_position_mp, columns = 14, rows = 40, bgcolor = color.rgb(7, 226, 242, 38), border_color = color.white, border_width = 1)
if barstate.islastconfirmedhistory and show_performance
    table.cell(table_id = testTable, column = 0, row = 0, text = "YEAR", text_color = text_c, text_size=table_text_size_mp)
    table.cell(table_id = testTable, column = 1, row = 0, text = "JAN", text_color = text_c, text_size=table_text_size_mp)
    table.cell(table_id = testTable, column = 2, row = 0, text = "FEB", text_color = text_c, text_size=table_text_size_mp)
    table.cell(table_id = testTable, column = 3, row = 0, text = "MAR", text_color = text_c, text_size=table_text_size_mp)
    table.cell(table_id = testTable, column = 4, row = 0, text = "APR", text_color = text_c, text_size=table_text_size_mp)
    table.cell(table_id = testTable, column = 5, row = 0, text = "MAY", text_color = text_c, text_size=table_text_size_mp)
    table.cell(table_id = testTable, column = 6, row = 0, text = "JUN", text_color = text_c, text_size=table_text_size_mp)
    table.cell(table_id = testTable, column = 7, row = 0, text = "JUL", text_color = text_c, text_size=table_text_size_mp)
    table.cell(table_id = testTable, column = 8, row = 0, text = "AUG", text_color = text_c, text_size=table_text_size_mp)
    table.cell(table_id = testTable, column = 9, row = 0, text = "SEP", text_color = text_c, text_size=table_text_size_mp)
    table.cell(table_id = testTable, column = 10, row = 0, text = "OCT", text_color = text_c, text_size=table_text_size_mp)
    table.cell(table_id = testTable, column = 11, row = 0, text = "NOV", text_color = text_c, text_size=table_text_size_mp)
    table.cell(table_id = testTable, column = 12, row = 0, text = "DEC", text_color = text_c, text_size=table_text_size_mp)
    table.cell(table_id = testTable, column = 13, row = 0, text = "YEAR P/L", text_color = text_c, text_size=table_text_size_mp)

    for i = 0 to (array.size(y_number_array) == 0 ? na : array.size(y_number_array) - 1)
        row_y = year(array.get(y_time_array, i)) - year(array.get(y_time_array, 0)) + 1
        table.cell(table_id = testTable, column = 13, row = row_y, text = str.tostring(array.get(y_pnl_array , i), "##.##") + '\n' + '(' + str.tostring(array.get(y_pnl_array , i)*100/initial_balance, "##.##") + ' %)', bgcolor = array.get(y_pnl_array , i) > 0 ? color.green : array.get(y_pnl_array , i) < 0 ? color.red : color.gray, text_color = color.rgb(0, 0, 0), text_size=table_text_size_mp)
    curr_row_y = array.size(month_time_array) == 0 ? 1 : (year(array.get(month_time_array, array.size(month_time_array) - 1))) - (year(array.get(month_time_array, 0))) + 1
    table.cell(table_id = testTable, column = 13, row = curr_row_y, text = str.tostring(curr_y_pnl, "##.##") + '\n' + '(' + str.tostring(curr_y_pnl*100/initial_balance, "##.##") + ' %)', bgcolor = curr_y_pnl > 0 ? color.green : curr_y_pnl < 0 ? color.red : color.gray, text_color = color.rgb(0, 0, 0), text_size=table_text_size_mp)


    for i = 0 to (array.size(net_profit_array) == 0 ? na : array.size(net_profit_array) - 1)
        monthly_profit := i > 0 ? ( array.get(net_profit_array, i) - array.get(net_profit_array, i - 1) ) : array.get(net_profit_array, i)
        column_month_number := month(array.get(month_time_array, i))
        row_month_time :=((year(array.get(month_time_array, i))) - year(array.get(month_time_array, 0)) ) + 1
        table.cell(table_id = testTable, column = column_month_number, row = row_month_time, text = str.tostring(monthly_profit, "##.##") + '\n' + '(' + str.tostring(monthly_profit*100/initial_balance, "##.##") + ' %)', bgcolor = monthly_profit > 0 ? color.green : monthly_profit < 0 ? color.red : color.gray, text_color = text_c, text_size=table_text_size_mp)
        table.cell(table_id = testTable, column = 0, row =row_month_time, text = str.tostring(year(array.get(month_time_array, i)), "##.##"), text_color = text_c, text_size=table_text_size_mp)

    curr_row_m = array.size(month_time_array) == 0 ? 1 : (year(array.get(month_time_array, array.size(month_time_array) - 1))) - (year(array.get(month_time_array, 0))) + 1
    table.cell(table_id = testTable, column = curr_m_number, row = curr_row_m, text = str.tostring(curr_m_pnl, "##.##") + '\n' + '(' + str.tostring(curr_m_pnl*100/initial_balance, "##.##") + ' %)', bgcolor = curr_m_pnl > 0 ? color.green : curr_m_pnl < 0 ? color.red : color.gray, text_color = text_c, text_size=table_text_size_mp)
    table.cell(table_id = testTable, column = 0, row =curr_row_m, text = str.tostring(year(time), "##.##"), text_color = text_c, text_size=table_text_size_mp)

//============================================================================================================================================================================