مقداری رجحان کی حکمت عملی متعدد عوامل کو یکجا کرتی ہے۔
جائزہ
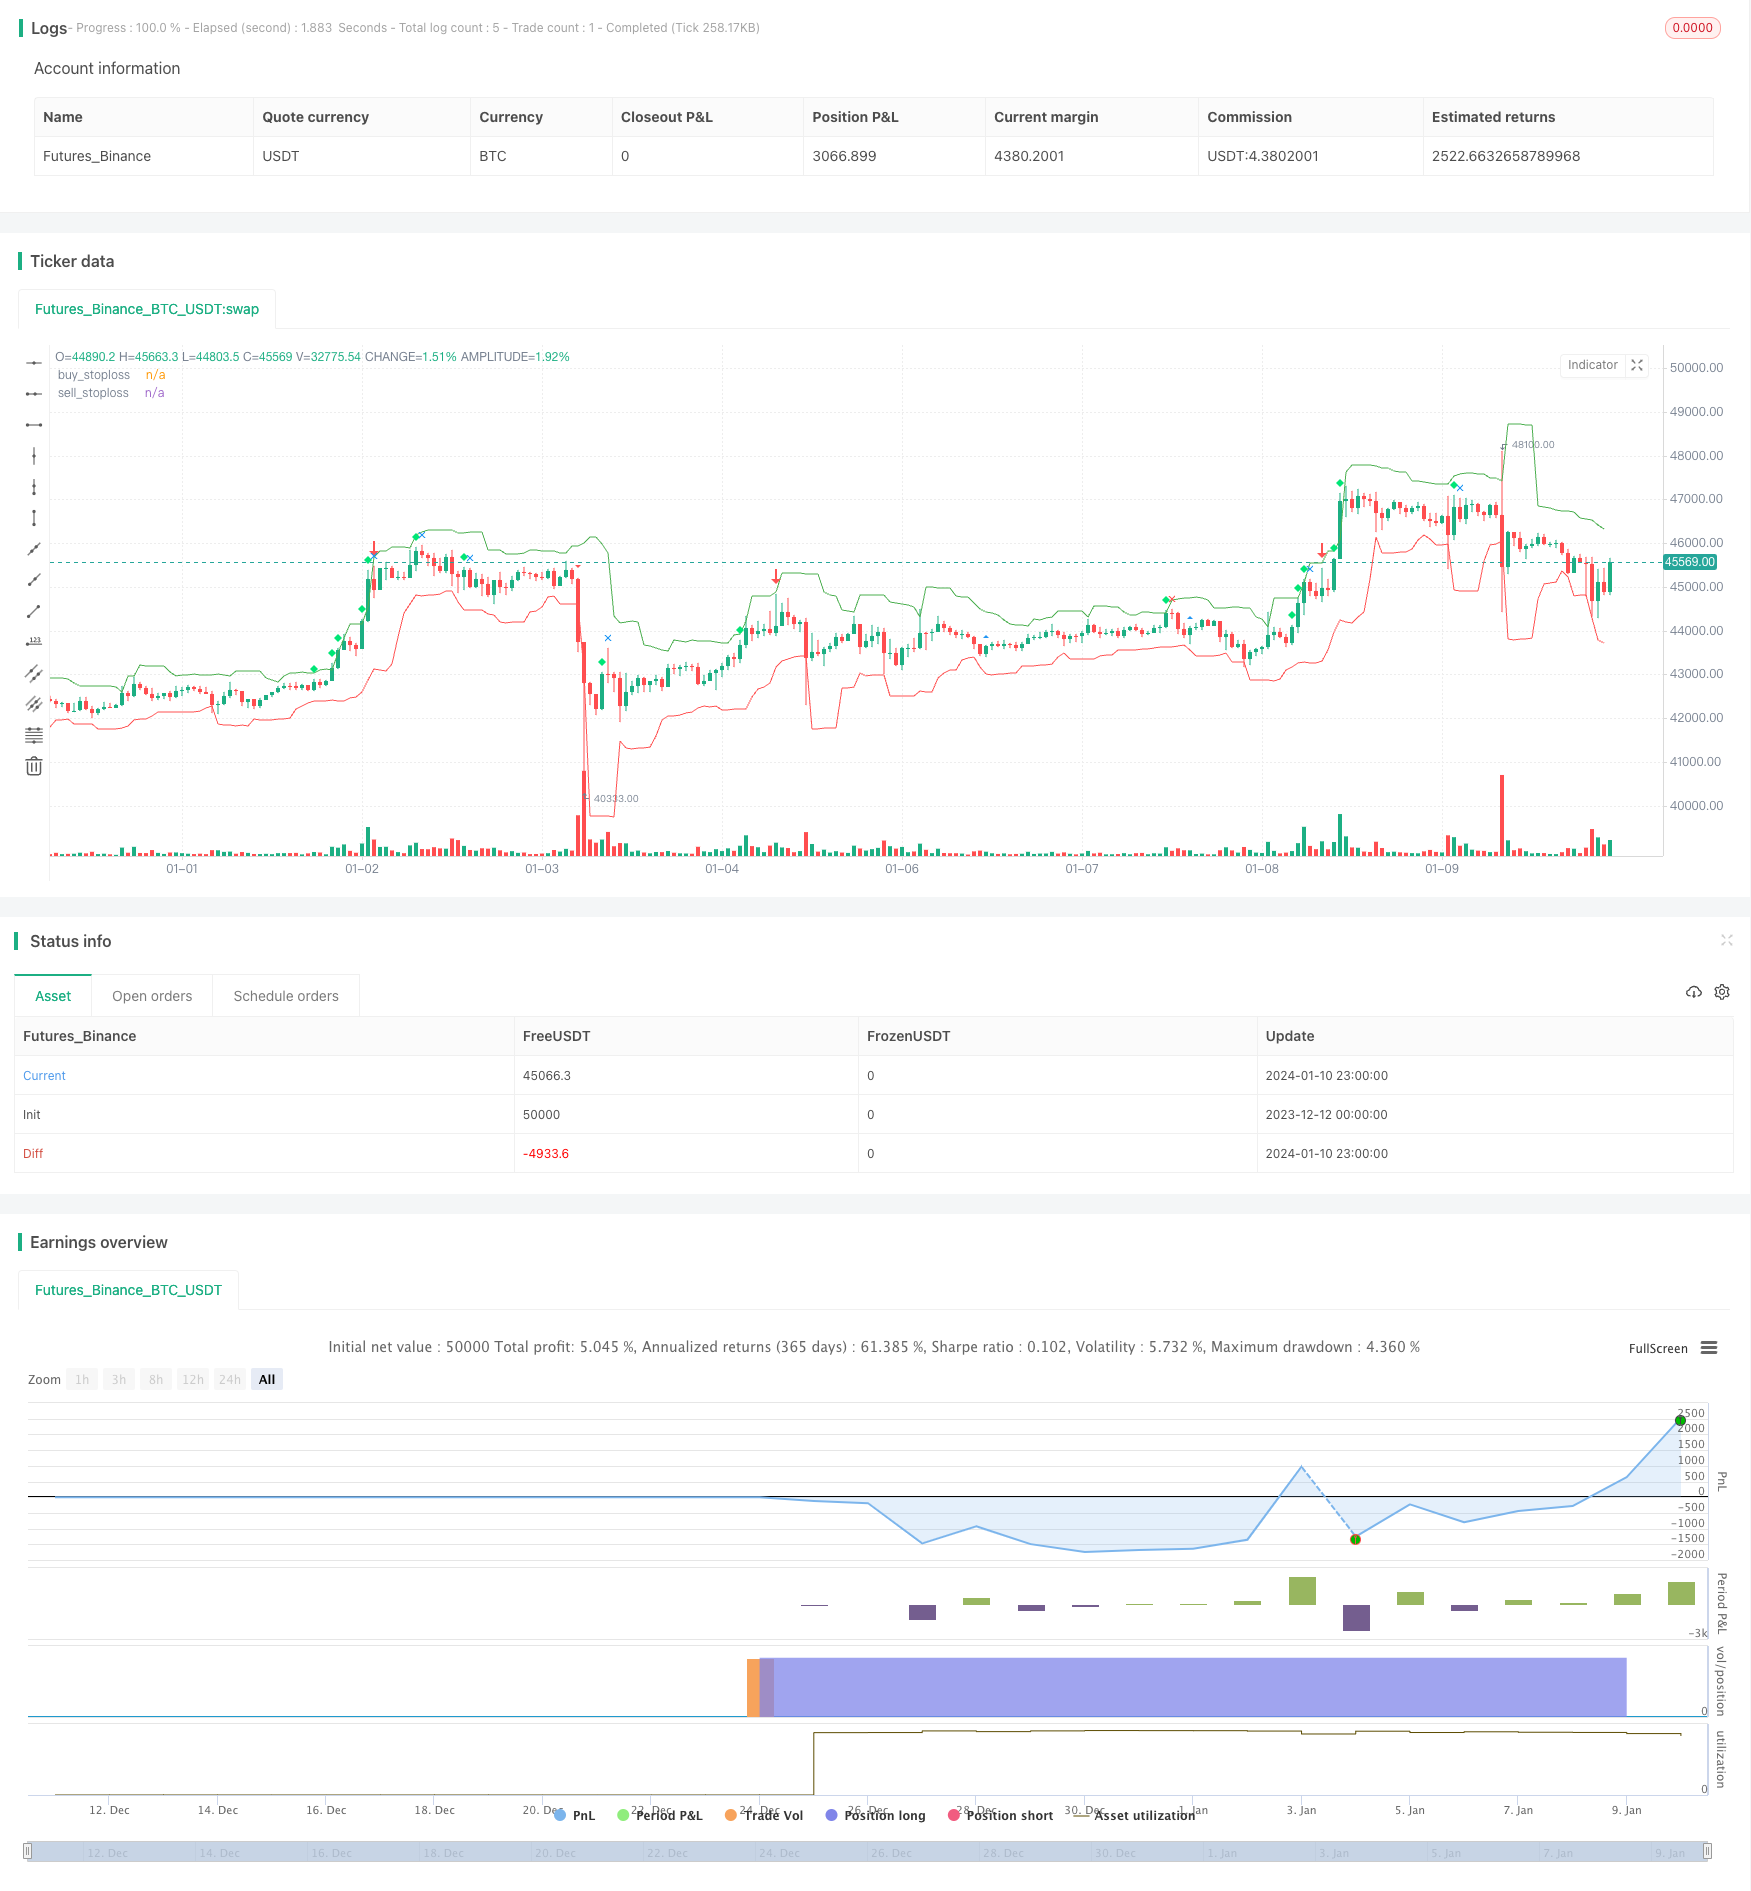
اس حکمت عملی کے مجموعی طور پر ٹریڈنگ کے مواقع کی شناخت کے لئے متعدد عوامل جیسے حجم ، اتار چڑھاؤ کی حد ، اختتامی مقام ، رجحانات وغیرہ کو مدنظر رکھتے ہوئے ، یہ ایک عام کثیر عنصر کی مقدار کی حکمت عملی ہے۔
حکمت عملی کا اصول
اس حکمت عملی کا بنیادی خیال یہ ہے کہ خرید و فروخت کے مقامات کی نشاندہی کرنے کے لئے متعدد عوامل کو یکجا کیا جائے ، بشمول غیر معمولی توڑ ، اختتامی پوزیشن اور اتار چڑھاؤ کی حد۔
خاص طور پر ، حکمت عملی ماضی کے عرصے میں اوسط تجارت کی مقدار کا حساب لگاتی ہے ، اور جب موجودہ دور میں تجارت کی مقدار میں واضح طور پر غیر معمولی خرابی ہوتی ہے تو اس سے رجحان کی تبدیلی کا اشارہ ہوسکتا ہے۔ اس کے علاوہ ، اگر اختتامی قیمت اتار چڑھاؤ کی حد کے قریب اوپر یا نیچے کی طرف ہے تو اس کا مطلب یہ ہے کہ موجودہ رجحان کا رخ موڑ سکتا ہے۔ تجارت اور اختتامی پوزیشن کے دونوں عوامل کو ملا کر ، ابتدائی طور پر خرید و فروخت کا مقام طے کیا جاسکتا ہے۔
خرید و فروخت کے مقامات کی توثیق کرنے کے لئے ، یہ حکمت عملی اتار چڑھاؤ کی وسعت کے اشارے کے ساتھ مل کر بھی کام کرتی ہے۔ اگر اتار چڑھاؤ پچھلے عرصے کی اوسط سے تجاوز کرتا ہے تو ، خرید و فروخت کے سگنل کی پہلی شرط تشکیل دی جاتی ہے۔ اس کے بعد ، اگر بڑھتی ہوئی مدت کے اختتامی قیمت اتار چڑھاؤ کی وسعت کے نچلے حصے میں ہے اور لین دین میں اضافہ ہوا ہے تو ، فروخت کا سگنل پیدا ہوتا ہے۔ اس کے برعکس ، اگر زوال کی مدت کے اختتامی قیمت اتار چڑھاؤ کی وسعت کے اوپری حصے میں ہے اور لین دین میں کمی واقع ہوئی ہے تو ، خریدنے کا سگنل پیدا ہوتا ہے۔
اس کے علاوہ ، اس حکمت عملی میں مجموعی رجحان کا اندازہ لگانے کے لئے مساوی لائن کے اشارے بھی شامل ہیں ، اور اگر لمبی اور درمیانی لائنوں میں رجحان کی تبدیلی ہوتی ہے تو ، یہ خرید و فروخت کے سگنل پیدا کرنے کی شرط بھی ہوگی۔
یہ حکمت عملی مندرجہ بالا اشارے کے مجموعے کے ذریعہ مارکیٹ کے خرید و فروخت کے وقت کا مکمل اندازہ لگانے کے قابل ہے۔
اسٹریٹجک فوائد
اس حکمت عملی کا سب سے اہم فائدہ یہ ہے کہ متعدد عوامل کو جامع طور پر مدنظر رکھا جائے ، جس سے نتائج کو زیادہ قابل اعتماد بنایا جاسکے۔ خاص طور پر ، اس میں مندرجہ ذیل فوائد ہیں:
- ٹرانزٹ کی غیر معمولی خرابیوں پر غور کریں تاکہ رجحانات میں تبدیلی کے اشارے پہلے سے ہی معلوم ہوسکیں۔
- مختصر مدت کے بازار کے شور سے گمراہ ہونے سے بچنے کے لئے ، اتار چڑھاؤ کی شدت اور اختتامی پوزیشنوں کے ذریعہ حقیقی رجحانات کا اندازہ لگائیں۔
- مجموعی رجحان کی سمت کا اندازہ لگانے کے لئے درمیانی اور طویل مدتی اوسط کے ساتھ مل کر ، اس بات کو یقینی بنائیں کہ حکمت عملی بڑے بازار کے رجحانات کے مطابق چل رہی ہے۔
- کثیر عنصر مجموعی فیصلے سے حکمت عملی زیادہ مستحکم اور قابل اعتماد ہوتی ہے اور بڑے نقصانات سے بچا جاتا ہے۔
اسٹریٹجک رسک
اس حکمت عملی کے کچھ خطرات بھی ہیں جن کے بارے میں آگاہ ہونا ضروری ہے:
- اس کے علاوہ، یہ ایک پیچیدہ فیصلہ ہے، پیرامیٹر ٹیوننگ مشکل ہے.
- اس کے علاوہ ، یہ بھی کہا گیا ہے کہ اس طرح کے جعلی انکوائری سے غیر ضروری لین دین سے مکمل طور پر بچا نہیں جاسکتا ہے۔
- اگر مرکزی رجحانات کو غلط سمجھا جاتا ہے تو ، مجموعی طور پر آپریشنل اثر کو چھوٹ دیا جاتا ہے۔
- اتار چڑھاؤ کی شرح پیرامیٹرز کی ترتیب مختلف مارکیٹ کے حالات کے مطابق ایڈجسٹ کرنے کی ضرورت ہے.
اصلاح کی سمت
اس حکمت عملی میں کچھ اہم اصلاحات بھی ہیں:
- مشین لرننگ جیسے طریقوں کا استعمال کرتے ہوئے پیرامیٹرز کو خود بخود بہتر بنائیں۔
- اسٹاپ نقصان کی حکمت عملی میں شامل ہوں
- اس کے علاوہ ، اس میں مزید عوامل شامل ہیں ، جیسے کہ فنڈز کی آمدنی اور اس طرح کے اہم رجحانات کا تعین کرنا۔
- خود بخود اتار چڑھاؤ کی شرح پیرامیٹرز کے مطابق ڈیزائن کریں.
خلاصہ کریں۔
اس حکمت عملی میں تجارت کے مواقع کی شناخت کے لئے متعدد عوامل پر غور کیا گیا ہے۔ اس حکمت عملی کا فائدہ یہ ہے کہ اس کا فیصلہ جامع ، مستحکم اور قابل اعتماد ہے۔ پیرامیٹرز کی نشاندہی اور اہم رجحانات کے فیصلے میں بنیادی خطرہ غلطی ہے۔ مستقبل میں پیرامیٹرز کو مشین لرننگ وغیرہ کے ذریعہ بہتر بنایا جاسکتا ہے۔ مجموعی طور پر ، اس حکمت عملی کا نظریہ معقول ہے ، اور اس کے عملی نتائج کی توقع کی جاسکتی ہے۔
/*backtest
start: 2023-12-12 00:00:00
end: 2024-01-11 00:00:00
period: 1h
basePeriod: 15m
exchanges: [{"eid":"Futures_Binance","currency":"BTC_USDT"}]
*/

//@version=3
strategy("volume spread analysis ", overlay=true)

volavg = sma(volume,40)
c= close
l=low
h=high
v=volume

volmean 			= 	stdev(volavg,30)
volupband3 			= 	volavg + 3*volmean
volupband2 			= 	volavg + 2*volmean
volupband1 			= 	volavg + 1*volmean
voldnband1 			= 	volavg -1*volmean
voldnband2 			= 	volavg -2*volmean
midprice			=	(high+low)/2
spread				=	(high-low)
avgspread			=	sma(spread,80)
avgspreadbar     	=   spread > avgspread
widerangebar		=	spread>(1.5*avgspread)
narrowrangebar	    =	spread<(0.7*avgspread)
lowvolume			=	volume<volume[1] and volume<volume[2]
upbar				=	close>close[1]
downbar			    =	close<close[1]
highvolume			=	volume>volume[1] and volume[1]>volume[2]
closefactor		    =	close-low
clsposition 		=	spread/closefactor

closeposition		=	iff(closefactor==0,avgspread,clsposition)
vb					=	volume>volavg or volume>volume[1]
upclose			    =	close>=((spread*0.7)+low)// close is above 70% of the bar
downclose			=	close<=((spread*0.3)+low)// close is below the 30% of the bar
aboveclose			=	close>((spread*0.5)+low)// close is between 50% and 70% of the bar
belowclose			=	close<((spread*0.5)+low)// close is between 50% and 30% of the bar
midclose			=	close>((spread*0.3)+low) and c<((spread*0.7)+l)// close is between 30% and 70% of the bar
verylowclose		=	closeposition>4//close is below 25% of the bar
veryhighclose		=	closeposition<1.35// close is above 80% of the bar
closepos			= 	iff(close<=((spread*0.2)+low),1,iff(close<=((spread*0.4)+low),2,iff(close<=((spread*0.6)+low),3,iff(close<=((spread*0.8)+low),4,5))))
                    // 1 = downclose, 2 = belowclose, 3 = midclose, 4 = aboveclose, 5 = upclose
volpos				=  	iff(volume>volavg*2,1,iff(volume>volavg*1.3,2,iff(volume>volavg,3,iff(volume<volavg and volume>volavg*0.7,4,5))))
                    //// 1 = very high, 2 = high, 3 = above average, 4 = less than average, 5 = low
freshgndhi          =  close > highestbars(h,5)
freshgndlo          =  close < lowestbars(l,5)


//========================trend estimation =========================
//jtrend=sma(close,5)
//trendlongterm     =  linreg(jtrend,40)
//trendmediumterm   =  linreg(jtrend,10)
//trendshortterm    =  linreg(jtrend,3)
//tls=linreg(jtrend,3)

minperiodsrwist = input(title="short term min periods",  defval=2, minval=1)
maxperiodsrwist = input(title="short term max periods",  defval=8, minval=1)


minperiodsrwilt = input(title="long term min periods",  defval=10, minval=1)
maxperiodsrwilt = input(title="long term max periods",  defval=40, minval=1)

rwhmins = (high - nz(low[minperiodsrwist])) / (atr(minperiodsrwist) * sqrt(minperiodsrwist))
rwhmaxs = (high - nz(low[maxperiodsrwist])) / (atr(maxperiodsrwist) * sqrt(maxperiodsrwist))
rwhs = max( rwhmins, rwhmaxs )

rwlmins = (nz(high[minperiodsrwist]) - low) / (atr(minperiodsrwist) * sqrt(minperiodsrwist))
rwlmaxs = (nz(high[maxperiodsrwist]) - low) / (atr(maxperiodsrwist) * sqrt(maxperiodsrwist))
rwls = max( rwlmins, rwlmaxs )


rwhminl = (high - nz(low[minperiodsrwilt])) / (atr(minperiodsrwilt) * sqrt(minperiodsrwilt))
rwhmaxl = (high - nz(low[maxperiodsrwilt])) / (atr(maxperiodsrwilt) * sqrt(maxperiodsrwilt))
rwhl = max( rwhminl, rwhmaxl )

rwlminl = (nz(high[minperiodsrwilt]) - low) / (atr(minperiodsrwilt) * sqrt(minperiodsrwilt))
rwlmaxl = (nz(high[maxperiodsrwilt]) - low) / (atr(maxperiodsrwilt) * sqrt(maxperiodsrwilt))
rwll = max( rwlminl, rwlmaxl )


ground = rwhs
sky    = rwls
j      = rwhs-rwls
k      = rwhl-rwll
j2     = rwhl
k2     = rwll
ja     = cross(j,1)
jb     = cross(1,j)
jc     = cross(-1,j)
jd     = cross(j,-1)
j2a    = cross(j2,1)
j2b    = cross(1,j2)
k2a    = cross(k2,1)
k2b    = cross(1,k2)
upmajoron   = j > 1 and ja[1]
upmajoroff  = j < 1 and jb[1]
upminoron   = j2 > 1 and j2a[1]
upminoroff  = j2 < 1 and j2b[1]
dnmajoron   = j < -1 and jc[1]
dnmajoroff  = j > -1 and jd[1]
dnminoron   = k2 > 1 and k2a[1]
dnminoroff  = k2 < 1 and k2b[1]
upimd       = iff(ground > 1, 1,0)
dnimd       = iff(sky > 1, 1, 0)
upmajor     = iff(j>1,1,iff(j<(-1),-1,0))
upminor     = iff(j2>1,1,-1)
dnminor     = iff(k2>1,1,-1)
//======================================================================|

Buy_stop = lowest(low[1],5) - atr(20)[1]
plot(Buy_stop, color=red, title="buy_stoploss")
Sell_stop = highest(high[1],5) + atr(20)[1]
plot(Sell_stop, color=green, title="sell_stoploss")

//======================================================================|

//upthrustbar		=	widerangebar and downclose  and upimd==1 and high>high[1]  //wrb and uhs and fresh ground
nut              	=       widerangebar and downclose  and freshgndhi and highvolume // new signal
bc               	=       widerangebar and aboveclose and volume == highest(volume,60) and upmajor==1  // new signal
upthrustbar		=	widerangebar and (closepos==1 or closepos==2) and upminor>0 and high>high[1] and (upimd>0or upmajor>0) and volpos <4// after minor up trend
upthrustbartrue		=	widerangebar and closepos==1 and upmajor>0 and high>high[1] and volpos <4//occurs after a major uptrend
upthrustcond1		=	upthrustbar[1] and downbar and not narrowrangebar
upthrustcond2		=	upthrustbar[1] and downbar and volpos == 2
upthrustcond3		=	upthrustbar and volpos ==1
toprevbar		=	volume[1]>volavg  and upbar[1] and widerangebar[1] and downbar and downclose and widerangebar and upmajor>0 and high==highest(high,10)
pseudoupthrust		=	upbar[1] and high>high[1] and volume[1]>1.5*volavg and downbar and downclose and  not upthrustbar
pseudoutcond		=	pseudoupthrust[1] and downbar and downclose and not upthrustbar
trendchange		=	upbar[1] and high==highest(high,5) and downbar and (downclose or midclose) and volume>volavg and upmajor>0 and upimd>0 and not widerangebar and not pseudoupthrust
nodemandbarut		=	upbar and narrowrangebar and lowvolume and closepos> 3 and ((upminor>0 and upimd>0)or (upminor<0 and upminor>0))//in a up market
nodemandbardt		=	upbar and narrowrangebar and lowvolume and closepos> 3 and (upminor<=0or upimd<=0)// in a down or sidewayss market
nosupplybar		=	downbar and narrowrangebar and lowvolume  and closepos<3 and ((upminor<1 and upimd<1)or (upminor>0 and upimd<1))
lowvoltest		=   	low==lowest(low,5) and upclose and lowvolume//lowvolume and l<low[1] and upclose
lowvoltest1		= 	low==lowest(low,5) and volume<volavg and low<low[1] and upclose and upminor>0 and upmajor>0// and widerangebar
lowvoltest2		= 	lowvoltest[1] and upbar and upclose
sellcond1		=	(upthrustcond1 or upthrustcond2 or upthrustcond3)
sellcond2		=	sellcond1[1]==0
sellcond		=	sellcond1 and sellcond2
strengthdown0		= 	upmajor<0 and volpos<4 and downbar[1] and upbar and closepos>3 and upminor<0 and upimd<=0// strength after a long down trend
strengthdown		= 	volpos<4 and downbar[1] and upbar and closepos>3 and upimd<=00 and upminor<0// strength after a down trend
strengthdown1		= 	upmajor<0 and volume>(volavg*1.5) and downbar[1] and upbar and closepos>3 and upminor<0 and upimd<=0//strength after downtrend . high volume
strengthdown2		=	upimd<=0 and volume[1]<volavg  and upbar and veryhighclose and volpos<4
buycond1		= 	strengthdown or strengthdown1
buycond			= 	upbar  and buycond1[1]
stopvolume		= 	low==lowest(low,5)  and (upclose or midclose) and v>1.5*volavg and upmajor<0
revupthrust		=	upmajor<0 and upbar and upclose and volume>volume[1] and volume>volavg and  widerangebar and downbar[1] and downclose[1] and upminor<0
effortup		=	high>high[1] and low>low[1] and close>close[1] and close>=((high-low)*0.7+low) and spread>avgspread and volpos<4//and open<=((high-low)*0.3+low)
effortupfail		=	effortup[1] and (upthrustbar or upthrustcond1 or upthrustcond2 or upthrustcond3 or (downbar and avgspreadbar))
effortdown		=	high<high[1] and low<low[1] and close<close[1] and  close<=((high-low)*0.25+low) and widerangebar and volume>volume[1]//o>=((high-low)*0.75+
effortdownfail  	=  	effortdown[1] and ((upbar and avgspreadbar)or revupthrust or buycond1)
upflag           	=  	(sellcond or buycond or effortup or effortupfail or stopvolume or effortdown or effortdownfail or revupthrust or nodemandbardt or nodemandbarut or nosupplybar or lowvoltest	or lowvoltest1 or lowvoltest2 or bc)
bullbar			=	(volume>volavg or volume>volume[1]) and closeposition <2 and upbar and not upflag
bearbar			=	vb  and downclose and downbar and spread>avgspread and not upflag
buy =	(upbar and revupthrust[1])or lowvoltest2
burely				=	strengthdown1 and stopvolume[1]or (upbar and revupthrust[1])or lowvoltest2
//buy				=	effortup and lowvoltest2[1]
//sell			=	upthrustbartrue
sell			=	effortup[1] and effortupfail and upthrustcond3 and upthrustbartrue and toprevbar

strategy.entry("simpleBuy", strategy.long, when= (upbar and revupthrust[1])or lowvoltest2 )
strategy.close("simpleBuy",when=upthrustbartrue )

//strategy.entry("simpleSell", strategy.short,when= upthrustbartrue )
//strategy.close("simpleSell",when= (upbar and revupthrust[1])or lowvoltest2)


//|============================================================================================|
//data = close >= open
//plotshape(true, style=shape.flag, color=data ? green : red)

plotshape((upthrustbar or upthrustbartrue)	,title="upthrustbaro"	,style=shape.arrowdown		,size=size.huge,color=red	)
//plotshape(toprevbar					        ,title="toprevbar"  	,style=shape.flag		,size=size.small,color=blue	)
//plotshape((pseudoupthrust)			    	,title="(pseudoupthrus"	,style=shape.circle		,size=size.small,color=blue	)
//plotshape((upthrustcond1 or upthrustcond2)	,title="upthrustcond1"	,style=shape.triangleup		,size=size.small,color=red	)
plotshape(trendchange		    			,title="trendchange"	,style=shape.xcross		,size=size.small,color=red	)
//plotshape((nodemandbardt)		    		,title="(nodemandbardt"	,style=shape.square		,size=size.small,color=orange	)
//plotshape(nosupplybar				    	,title="nosupplybar"	,style=shape.cross		,size=size.small,color=blue)
plotshape(revupthrust				    	,title="revupthrust"	,style=shape.arrowup		,size=size.huge,color=green	)
//plotshape((upthrustbar	or	upthrustbartrue)	,title="upthrustbaro"	,style=shape.cross		,size=size.small,color=red	)
//plotshape((upthrustcond1	or	upthrustcond2)	,title="upthrustcond1"	,style=shape.triangledown	,size=size.small,color=white	)
//plotshape((pseudoupthrust)				,title="(pseudoupthrus"	,style=shape.arrowup		,size=size.small,color=blue	)
//plotshape(nodemandbarut					,title="nodemandbarut"	,style=shape.labelup		,size=size.small,color=orange	)
//plotshape(nodemandbarut					,title="nodemandbarut"	,style=shape.labeldown		,size=size.small,color=yellow	)
//plotshape(nodemandbardt					,title="nodemandbardt"	,style=shape.diamond      	,size=size.small,color=yellow	)
//plotshape(nosupplybar					,title="nosupplybar"	,style=shape.xcross		,size=size.small,color=blue	)
plotshape(lowvoltest					,title="lowvoltest"	,style=shape.triangleup		,size=size.small,color=blue	)
//plotshape(lowvoltest2					,title="lowvoltest2"	,style=shape.triangledown	,size=size.small,color=yellow	)
//plotshape(strengthdown					,title="strengthdown"	,style=shape.flag		,size=size.small,color=green)
//plotshape(strengthdown					,title="strengthdown"	,style=shape.circle		,size=size.small,color=lime	)
//plotshape(strengthdown2					,title="strengthdown2"	,style=shape.arrowup		,size=size.small,color=silver	)
//plotshape(strengthdown2					,title="strengthdown2"	,style=shape.arrowdown		,size=size.small,color=red	)
//plotshape(stopvolume					,title="stopvolume"	,style=shape.labelup		,size=size.small,color=green	)
//plotshape(stopvolume					,title="stopvolume"	,style=shape.labeldown		,size=size.small,color=yellow	)
plotshape(effortup					,title="effortup"	,style=shape.diamond      	,size=size.small,color=lime	)
plotshape(effortupfail					,title="effortupfail"	,style=shape.xcross		,size=size.small,color=blue	)
//plotshape(effortupfail					,title="effortupfail"	,style=shape.cross		,size=size.small,color=white	)
plotshape(effortdown					,title="effortdown"	,style=shape.triangledown		,size=size.small,color=red	)
plotshape(effortdownfail				,title="effortdownfail"	,style=shape.xcross	,size=size.small,color=green	)
//plotshape(effortdownfail				,title="effortdownfail"	,style=shape.flag		,size=size.small,color=white	)
//plotshape(buycond					,title="buycond"	,style=shape.circle		,size=size.small,color=green	)
//plotshape(sellcond					,title="sellcond"	,style=shape.arrowup		,size=size.small,color=orange	)
//plotshape((nut)						,title="(nut)"		,style=shape.arrowdown		,size=size.small,color=lime	)
//plotshape((bc	)					,title="(bc"		,style=shape.labelup		,size=size.small,color=red	)
//plotshape(buy						,title="buy"		,style=shape.labeldown		,size=size.small,color=white	)