Momentum Weighted Moving Average Double Moving Average Crossover Strategy
تخلیق کی تاریخ:
2024-01-12 12:04:55
آخر میں ترمیم کریں:
2024-01-12 12:04:55
کاپی:
1
کلکس کی تعداد:
771
1
پر توجہ دیں
1750
پیروکار
جائزہ
یہ حکمت عملی متحرک توانائی سے چلنے والی اوسط ((MAEMA) کی حساب سے دو مختلف ادوار کی حساب سے ، جب وہ کراس کرتے ہیں تو خرید اور فروخت کے اشارے پیدا کرتے ہیں۔ اس میں ، مختصر دورانیہ کی لائن مارکیٹ کے رجحانات اور قلیل مدتی الٹ اشارے کا فیصلہ کرنے کے لئے استعمال کی جاتی ہے ، جبکہ طویل دورانیہ کی لائن اہم رجحانات کی سمت کا تعین کرنے کے لئے استعمال کی جاتی ہے۔
اصول
- حساب کریں فاسٹ لائن ((80 سیکنڈ) اور سست لائن ((144 سیکنڈ) کا MAEMA
- تیز لائنیں مختصر مدت کے رجحانات اور الٹ پوائنٹس کی عکاسی کرتی ہیں۔ سست لائنیں اہم رجحانات کی سمت کی عکاسی کرتی ہیں۔
- جب تیز لائن پر سست لائن کو پار کرتے ہیں تو ، خریدنے کا اشارہ پیدا ہوتا ہے۔ جب تیز لائن کے نیچے سست لائن کو پار کرتے ہیں تو ، فروخت کا اشارہ پیدا ہوتا ہے۔
- اس حکمت عملی میں ایک ہی وقت میں تین پیش گوئی پوائنٹس کا نقشہ تیار کیا گیا ہے ، جو اگلے دور کی ممکنہ اقدار کی نمائندگی کرتے ہیں ، تاکہ مستقبل میں کراسنگ کے رجحانات کا اندازہ لگایا جاسکے۔
- اس حکمت عملی میں MAEMA اشارے کی متحرک اور پیش گوئی کی صلاحیتوں کو مکمل طور پر استعمال کیا گیا ہے۔
طاقت کا تجزیہ
- MAEMA خود ایک متحرک عنصر ہے جو رجحانات کی تبدیلیوں کو تیزی سے پکڑ سکتا ہے۔
- ڈبل اور یکساں حکمت عملی ، مختلف ٹائم فریموں میں رجحانات کی سمت کا تعین کرتی ہے۔
- اس کے علاوہ ، یہ بھی کہا گیا ہے کہ اس کی قیمتوں کا تعین کرنے کے لئے ، اس کی قیمتوں کا تعین کرنے کے لئے ، اس کی قیمتوں کا تعین کرنے کے لئے ، اس کی قیمتوں کا تعین کرنے کے لئے ، اس کی قیمتوں کا تعین کرنے کے لئے ، اس کی قیمتوں کا تعین کرنے کے لئے ، اس کی قیمتوں کا تعین کرنے کے لئے ، اس کی قیمتوں کا تعین کرنے کے لئے ، اس کی قیمتوں کا تعین کرنے کے لئے ، اس کی قیمتوں کا تعین کرنے کے لئے ، اس کی قیمتوں کا تعین کرنے کے لئے ، اس کی قیمتوں کا تعین کرنے کے لئے ، اس کی قیمتوں کا تعین کرنے کے لئے ، اس کی قیمتوں کا تعین کرنے کے لئے ، اس کی قیمتوں کا تعین کرنے کے لئے ، اس کی قیمتوں کا تعین کرنے کے لئے ، اس کی قیمتوں کا تعین کرنے کے لئے ، اس کی قیمتوں کا تعین کرنے کے لئے ، اس کی قیمتوں کا تعین کرنے کے لئے ، اس کی قیمتوں کا تعین کرنے کے لئے ، اس کی قیمتوں کا تعین کرنے کے لئے ، اس کی قیمتوں کا تعین کرنے کے لئے۔
- خود کار طریقے سے نقشہ مکمل طور پر، مارکیٹ کے اتار چڑھاو کی عکاسی کرتا ہے.
خطرے کا تجزیہ
- مارکیٹ میں غیر معمولی اتار چڑھاو کی صورت میں ، MAEMA اشارے کی حساسیت زیادہ ہوسکتی ہے ، جس سے غلط سگنل پیدا ہوتا ہے۔
- اوسط لکیری نظام افقی ڈسک مارکیٹ کے لئے جھوٹے سگنل پیدا کرنے کے لئے آسان ہے۔ اضافی فلٹر شامل کیا جاسکتا ہے۔
- تیز لائن اور سست لائن کے لئے دورانیہ کی ترتیب مختلف اقسام کے مطابق بہترین پیرامیٹرز کا تعین کرنے کی ضرورت ہے۔
اصلاح کی سمت
- MAEMA فاسٹ لائن اور سست لائن کے دورانیہ پیرامیٹرز کو بہتر بنائیں اور بہترین پیرامیٹرز کا مجموعہ تلاش کریں۔
- فلٹرنگ کی شرائط میں اضافہ کریں تاکہ ہنگامی حالات میں پوزیشن کھولنے سے گریز کیا جاسکے۔ مثال کے طور پر ڈی ایم آئی ، ایم اے سی ڈی اور دیگر فیصلے کی رجحان سازی متعارف کروائیں۔
- غلط مثبت کو کم کرنے اور خطرے کو کنٹرول کرنے کے لئے اے ٹی آر فیکٹر کو مسلسل ایڈجسٹ کریں اور اسٹاپ نقصان کو منتقل کریں۔
خلاصہ کریں۔
اس حکمت عملی میں مارکیٹ کے رجحانات میں تبدیلی کا اندازہ لگانے کے لئے متحرک وزن والے متحرک اوسط کے باہمی مساوی لائنوں کا استعمال کیا گیا ہے۔ اس کے بنیادی اصول واضح اور آسان ہیں۔ MAEMA کی اپنی حرکیات اور پیش گوئی کی خصوصیات کے ساتھ مل کر ، الٹ سگنل کی شناخت کا اثر بہتر ہے۔ پیرامیٹرز کی اصلاح پر توجہ دینے کے ساتھ ساتھ فلٹرنگ کے حالات کو مضبوط بنانے اور استحکام کو بڑھانے کی ضرورت ہے۔
حکمت عملی کا ماخذ کوڈ
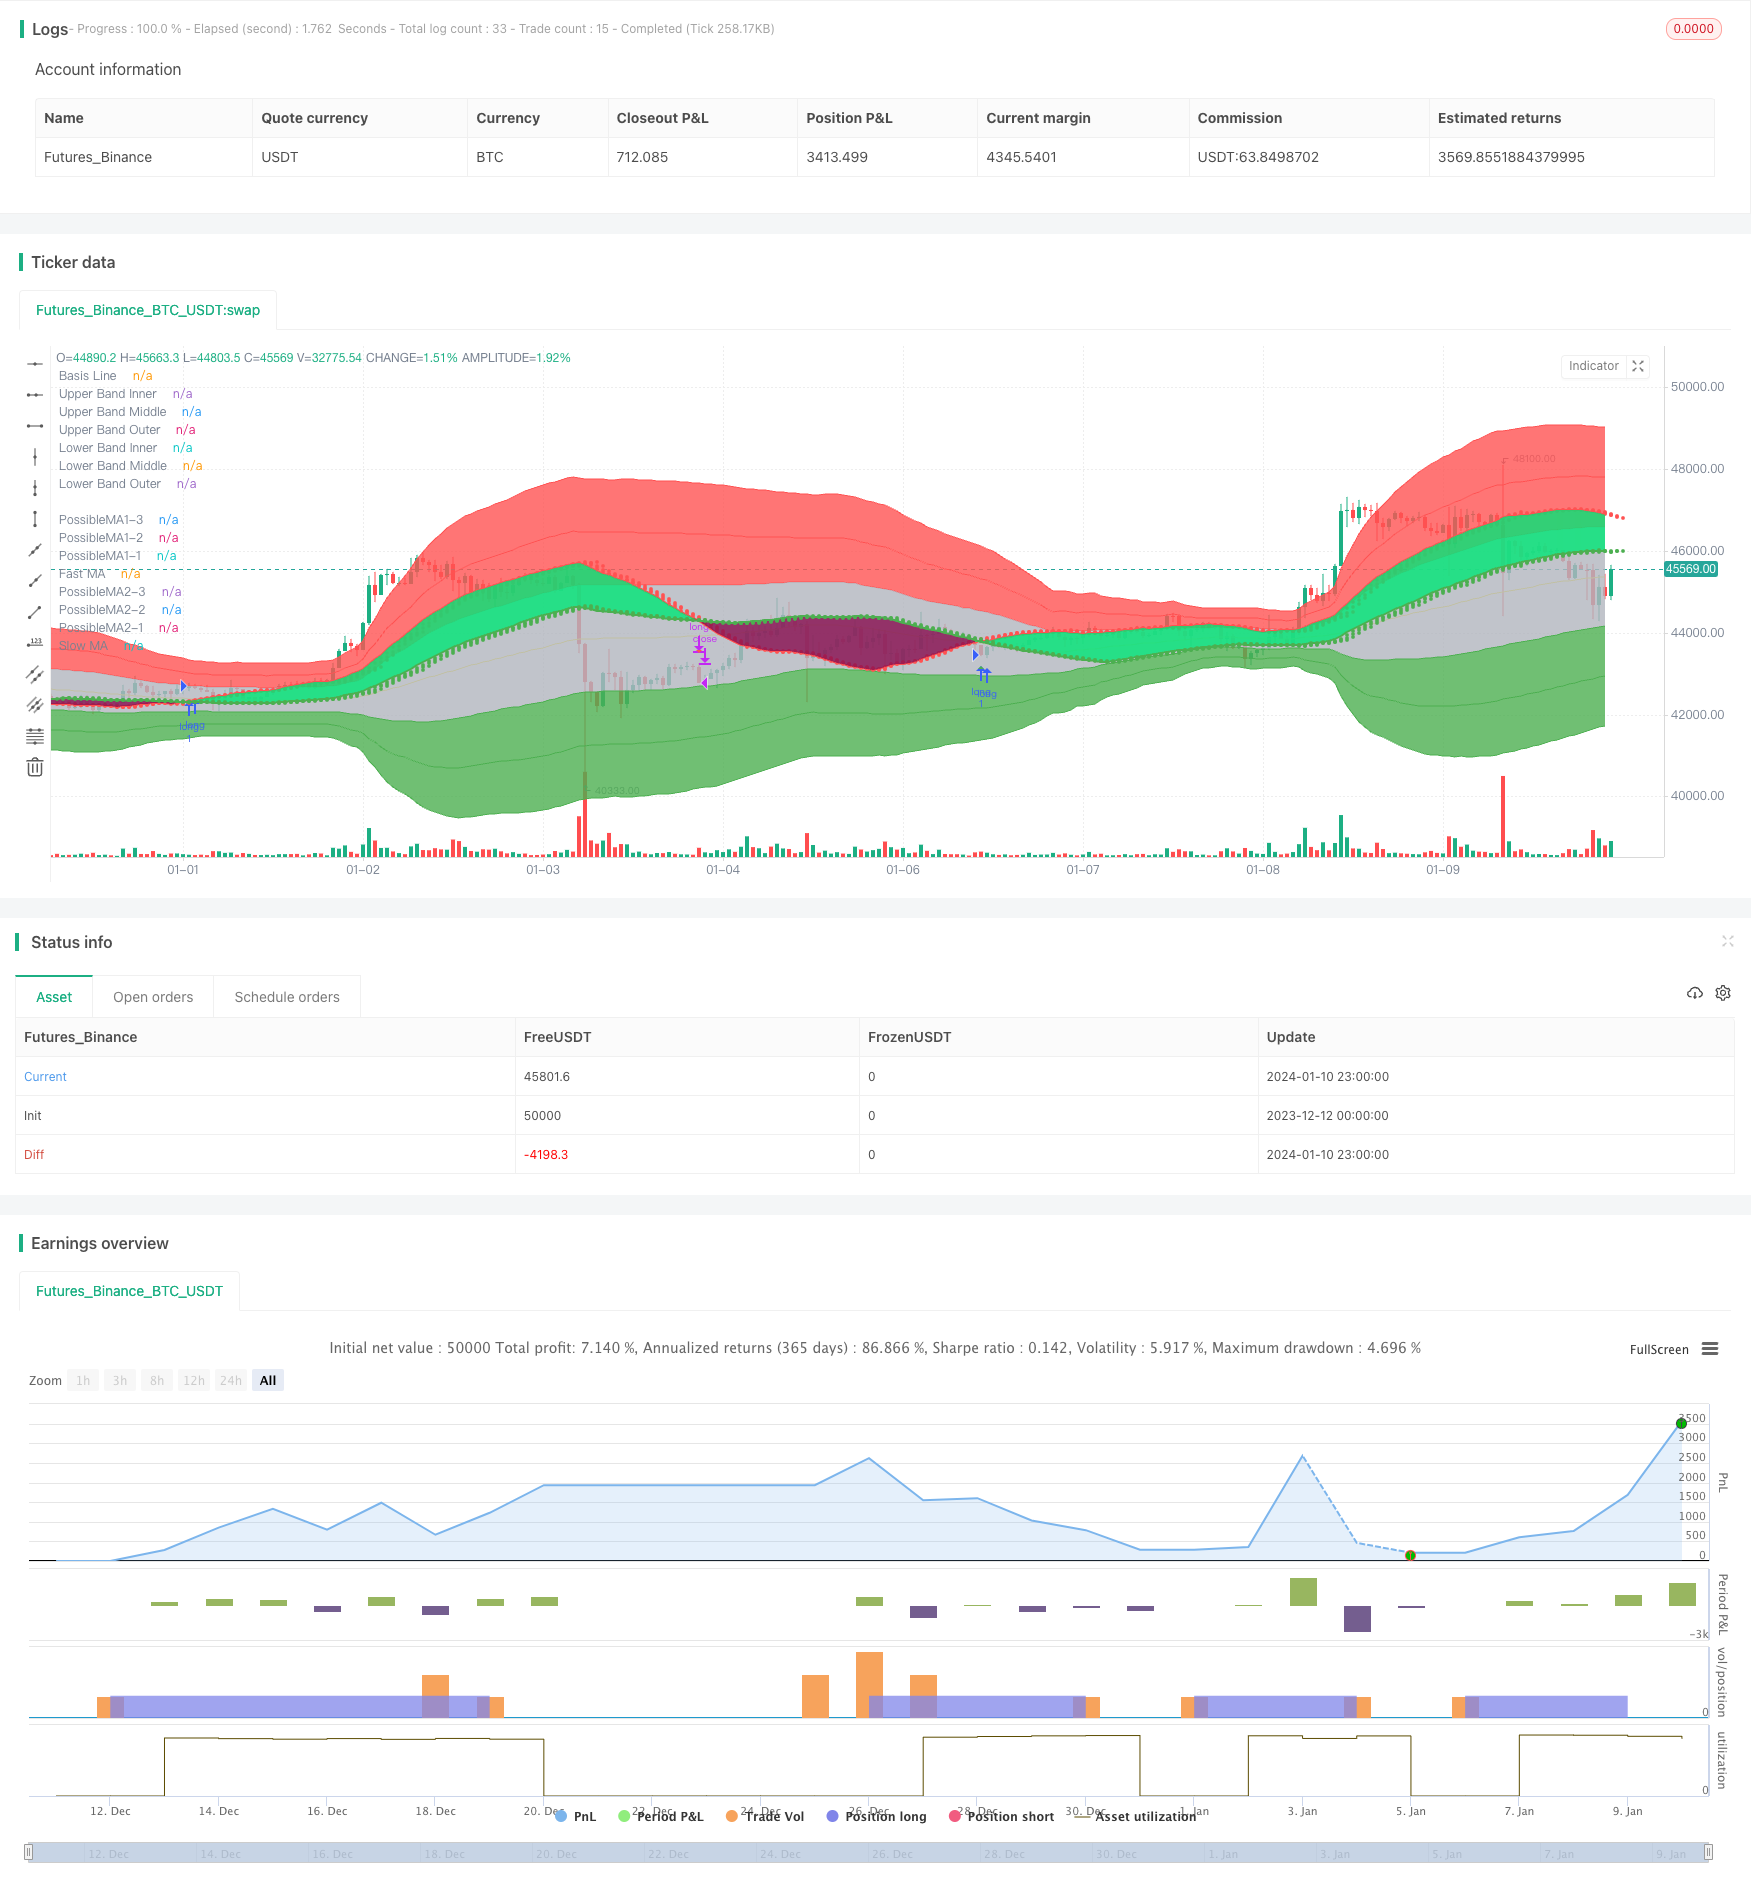
/*backtest
start: 2023-12-12 00:00:00
end: 2024-01-11 00:00:00
period: 1h
basePeriod: 15m
exchanges: [{"eid":"Futures_Binance","currency":"BTC_USDT"}]
*/

// © informanerd
//@version=4

strategy("MultiType Shifting Predictive MAs Crossover", shorttitle = "MTSPMAC + MBHB Strategy", overlay = true)

//inputs

predict = input(true, "Show MA Prediction Tails")
trendFill = input(true, "Fill Between MAs Based on Trend")
signal = input(true, "Show Cross Direction Signals")

showMA1 = input(true, "[ Show Fast Moving Average ]══════════")
type1 = input("MAEMA (Momentum Adjusted Exponential)", "Fast MA Type", options = ["MAEMA (Momentum Adjusted Exponential)", "DEMA (Double Exponential)", "EMA (Exponential)", "HMA (Hull)", "LSMA (Least Squares)", "RMA (Adjusted Exponential)", "SMA (Simple)", "SWMA (Symmetrically Weighted)", "TEMA (Triple Exponential)", "TMA (Triangular)", "VMA / VIDYA (Variable Index Dynamic Average)", "VWMA (Volume Weighted)", "WMA (Weighted)"])
src1 = input(high, "Fast MA Source")
len1 = input(80, "Fast MA Length", minval = 2)
shift1 = input(0, "Fast MA Shift")
maThickness1 = input(2, "Fast MA Thickness", minval = 1)
trendColor1 = input(false, "Color Fast MA Based on Detected Trend")
showBand1 = input(false, "Show Fast MA Range Band")
atrPer1 = input(20, "Fast Band ATR Lookback Period")
atrMult1 = input(3, "Fast Band ATR Multiplier")

showMA2 = input(true, "[ Show Slow Moving Average ]══════════")
type2 = input("MAEMA (Momentum Adjusted Exponential)", "Slow MA Type", options = ["MAEMA (Momentum Adjusted Exponential)", "DEMA (Double Exponential)", "EMA (Exponential)", "HMA (Hull)", "LSMA (Least Squares)", "RMA (Adjusted Exponential)", "SMA (Simple)", "SWMA (Symmetrically Weighted)", "TEMA (Triple Exponential)", "TMA (Triangular)", "VMA / VIDYA (Variable Index Dynamic Average)", "VWMA (Volume Weighted)", "WMA (Weighted)"])
src2 = input(close, "Slow MA Source")
len2 = input(144, "Slow MA Length", minval = 2)
shift2 = input(0, "Slow MA Shift")
maThickness2 = input(2, "Slow MA Thickness", minval = 1)
trendColor2 = input(false, "Color Slow MA Based on Detected Trend")
showBand2 = input(false, "Show Slow MA Range Band")
atrPer2 = input(20, "Slow Band ATR Lookback Period")
atrMult2 = input(3, "Slow Band ATR Multiplier")

//ma calculations

ma(type, src, len) =>
    if type == "MAEMA (Momentum Adjusted Exponential)"
        goldenRatio = (1 + sqrt(5)) / 2
        momentumLen = round(len / goldenRatio), momentum = change(src, momentumLen), probabilityLen = len / goldenRatio / goldenRatio
        ema(src + (momentum + change(momentum, momentumLen) * 0.5) * sum(change(src) > 0 ? 1 : 0, round(probabilityLen)) / probabilityLen, len)
    else if type == "DEMA (Double Exponential)"
        2 * ema(src, len) - ema(ema(src, len), len)
    else if type == "EMA (Exponential)"
        ema(src, len)
    else if type == "HMA (Hull)"
        wma(2 * wma(src, len / 2) - wma(src, len), round(sqrt(len)))
    else if type == "LSMA (Least Squares)"
        3 * wma(src, len) - 2 * sma(src, len)
    else if type == "RMA (Adjusted Exponential)"
        rma(src, len)
    else if type == "SMA (Simple)"
        sma(src, len)
    else if type == "SWMA (Symmetrically Weighted)"
        swma(src)
    else if type == "TEMA (Triple Exponential)"
        3 * ema(src, len) - 3 * ema(ema(src, len), len) + ema(ema(ema(src, len), len), len)
    else if type == "TMA (Triangular)"
        swma(wma(src, len))
    else if type == "VMA / VIDYA (Variable Index Dynamic Average)"
        smoothing = 2 / len, volIndex = abs(cmo(src, len) / 100)
        vma = 0., vma := (smoothing * volIndex * src) + (1 - smoothing * volIndex) * nz(vma[1])
    else if type == "VWMA (Volume Weighted)"
        vwma(src, len)
    else if type == "WMA (Weighted)"
        wma(src, len)

ma1 = ma(type1, src1, len1)
ma2 = ma(type2, src2, len2)

//ma predictions

pma11 = len1 > 2 ? (ma(type1, src1, len1 - 1) * (len1 - 1) + src1 * 1) / len1 : na
pma12 = len1 > 3 ? (ma(type1, src1, len1 - 2) * (len1 - 2) + src1 * 2) / len1 : na
pma13 = len1 > 4 ? (ma(type1, src1, len1 - 3) * (len1 - 3) + src1 * 3) / len1 : na

pma21 = len2 > 2 ? (ma(type2, src2, len2 - 1) * (len2 - 1) + src2 * 1) / len2 : na
pma22 = len2 > 3 ? (ma(type2, src2, len2 - 2) * (len2 - 2) + src2 * 2) / len2 : na
pma23 = len2 > 4 ? (ma(type2, src2, len2 - 3) * (len2 - 3) + src2 * 3) / len2 : na

//ma range bands

r1 = atr(atrPer1) * atrMult1
hBand1 = ma1 + r1
lBand1 = ma1 - r1

r2 = atr(atrPer2) * atrMult2
hBand2 = ma2 + r2
lBand2 = ma2 - r2

//drawings

ma1Plot = plot(showMA1 ? ma1 : na, "Fast MA", trendColor1 and ma1 > src1 ? color.maroon : trendColor1 and ma1 < src1 ? color.lime : trendColor1 ? color.gray : color.red, maThickness1, offset = shift1)
ma2Plot = plot(showMA2 ? ma2 : na, "Slow MA", trendColor2 and ma2 > src2 ? color.maroon : trendColor2 and ma2 < src2 ? color.lime : trendColor2 ? color.gray : color.green, maThickness2, offset = shift2)
fill(ma1Plot, ma2Plot, trendFill and ma1 > ma2 ? color.lime : trendFill and ma1 < ma2 ? color.maroon : na, 90)

plot(showMA1 and predict ? pma11 : na, "PossibleMA1-1", trendColor1 and ma1 > src1 ? color.maroon : trendColor1 and ma1 < src1 ? color.lime : trendColor1 ? color.gray : color.red, style = plot.style_circles, offset = shift1 + 1, show_last = 1)
plot(showMA1 and predict ? pma12 : na, "PossibleMA1-2", trendColor1 and ma1 > src1 ? color.maroon : trendColor1 and ma1 < src1 ? color.lime : trendColor1 ? color.gray : color.red, style = plot.style_circles, offset = shift1 + 2, show_last = 1)
plot(showMA1 and predict ? pma13 : na, "PossibleMA1-3", trendColor1 and ma1 > src1 ? color.maroon : trendColor1 and ma1 < src1 ? color.lime : trendColor1 ? color.gray : color.red, style = plot.style_circles, offset = shift1 + 3, show_last = 1)
plot(showMA2 and predict ? pma21 : na, "PossibleMA2-1", trendColor2 and ma2 > src2 ? color.maroon : trendColor2 and ma2 < src2 ? color.lime : trendColor2 ? color.gray : color.green, style = plot.style_circles, offset = shift2 + 1, show_last = 1)
plot(showMA2 and predict ? pma22 : na, "PossibleMA2-2", trendColor2 and ma2 > src2 ? color.maroon : trendColor2 and ma2 < src2 ? color.lime : trendColor2 ? color.gray : color.green, style = plot.style_circles, offset = shift2 + 2, show_last = 1)
plot(showMA2 and predict ? pma23 : na, "PossibleMA2-3", trendColor2 and ma2 > src2 ? color.maroon : trendColor2 and ma2 < src2 ? color.lime : trendColor2 ? color.gray : color.green, style = plot.style_circles, offset = shift2 + 3, show_last = 1)

plot(showBand1 ? hBand1 : na, "Fast Higher Band", trendColor1 and ma1 > src1 ? color.maroon : trendColor1 and ma1 < src1 ? color.lime : trendColor1 ? color.gray : color.red, offset = shift1)
plot(showBand1 ? lBand1 : na, "Fast Lower Band", trendColor1 and ma1 > src1 ? color.maroon : trendColor1 and ma1 < src1 ? color.lime : trendColor1 ? color.gray : color.red, offset = shift1)
plot(showBand2 ? hBand2 : na, "Slow Higher Band", trendColor2 and ma2 > src2 ? color.maroon : trendColor2 and ma2 < src2 ? color.lime : trendColor2 ? color.gray : color.green, offset = shift2)
plot(showBand2 ? lBand2 : na, "Slow Lower Band", trendColor2 and ma2 > src2 ? color.maroon : trendColor2 and ma2 < src2 ? color.lime : trendColor2 ? color.gray : color.green, offset = shift2)

//crosses & alerts

up = crossover(ma1, ma2)
down = crossover(ma2, ma1)

plotshape(signal ? up : na, "Buy", shape.triangleup, location.belowbar, color.green, offset = shift1, size = size.small)
plotshape(signal ? down : na, "Sell", shape.triangledown, location.abovebar, color.red, offset = shift1, size = size.small)

alertcondition(up, "Buy", "Buy")
alertcondition(down, "Sell", "Sell")

// @version=1

// Title: "Multi Bollinger Heat Bands - EMA/Breakout options".
// Author: JayRogers
//
// * Description *
//   Short: It's your Basic Bollinger Bands, but 3 of them, and some pointy things.
//
//   Long:  Three stacked sma based Bollinger Bands designed just to give you a quick visual on the "heat" of movement.
//          Set inner band as you would expect, then set your preferred additional multiplier increments for the outer 2 bands.
//          Option to use EMA as alternative basis, rather than SMA.
//          Breakout indication shapes, which have their own multiplier seperate from the BB's; but still tied to same length/period.

// strategy(shorttitle="[JR]MBHB_EBO", title="[JR] Multi Bollinger Heat Bands - EMA/Breakout options", overlay=true)

// Bollinger Bands Inputs
bb_use_ema = input(false, title="Use EMA Basis?")
bb_length = input(80, minval=1, title="Bollinger Length")
bb_source = input(close, title="Bollinger Source")
bb_mult = input(1.0, title="Base Multiplier", minval=0.001, maxval=50)
bb_mult_inc = input(1, title="Multiplier Increment", minval=0.001, maxval=2)
// Breakout Indicator Inputs
break_mult = input(3, title="Breakout Multiplier", minval=0.001, maxval=50)
breakhigh_source = input(high, title="High Break Source")
breaklow_source = input(low, title="Low Break Source")

bb_basis = bb_use_ema ? ema(bb_source, bb_length) : sma(bb_source, bb_length)

// Deviation
// * I'm sure there's a way I could write some of this cleaner, but meh.
dev = stdev(bb_source, bb_length)
bb_dev_inner = bb_mult * dev
bb_dev_mid = (bb_mult + bb_mult_inc) * dev
bb_dev_outer = (bb_mult + (bb_mult_inc * 2)) * dev
break_dev = break_mult * dev

// Upper bands
inner_high = bb_basis + bb_dev_inner
mid_high = bb_basis + bb_dev_mid
outer_high = bb_basis + bb_dev_outer
// Lower Bands
inner_low = bb_basis - bb_dev_inner
mid_low = bb_basis - bb_dev_mid
outer_low = bb_basis - bb_dev_outer

// Breakout Deviation
break_high = bb_basis + break_dev
break_low = bb_basis - break_dev

// plot basis
plot(bb_basis, title="Basis Line", color=color.yellow, transp=50)

// plot and fill upper bands
ubi = plot(inner_high, title="Upper Band Inner", color=color.red, transp=90)
ubm = plot(mid_high, title="Upper Band Middle", color=color.red, transp=85)
ubo = plot(outer_high, title="Upper Band Outer", color=color.red, transp=80)
fill(ubi, ubm, title="Upper Bands Inner Fill", color=color.red, transp=90)
fill(ubm, ubo, title="Upper Bands Outer Fill",color=color.red, transp=80)

// plot and fill lower bands
lbi = plot(inner_low, title="Lower Band Inner", color=color.green, transp=90)
lbm = plot(mid_low, title="Lower Band Middle", color=color.green, transp=85)
lbo = plot(outer_low, title="Lower Band Outer", color=color.green, transp=80)
fill(lbi, lbm, title="Lower Bands Inner Fill", color=color.green, transp=90)
fill(lbm, lbo, title="Lower Bands Outer Fill", color=color.green, transp=80)

// center channel fill
fill(ubi, lbi, title="Center Channel Fill", color=color.silver, transp=100)

// plot breakouts
plotshape(breakhigh_source >= break_high, title="High Breakout", style=shape.triangledown, location=location.abovebar, size=size.tiny, color=color.white, transp=0)
plotshape(breaklow_source <= break_low, title="Low Breakout", style=shape.triangleup, location=location.belowbar, size=size.tiny, color=color.white, transp=0)
High_Break = breakhigh_source >= break_high
Low_Break = breaklow_source <= break_low

// Conditions
Stop_Momentum = low < ma1

//Strategy Tester

strategy.entry("long", strategy.long, when=(up and (hlc3 < inner_high)))
strategy.close("long", when=down)

strategy.entry("longwickdown", strategy.long, when=Low_Break)
strategy.close("longwickdown", when=(high > ma1))

//true signals test

//var winCount = 0, var loseCount = 0, testBarIndex = 1
//if (up[testBarIndex] and close > close[testBarIndex]) or (down[testBarIndex] and close < close[testBarIndex])
//    label.new(bar_index, 0, "W", yloc = yloc.abovebar, color = color.green)
//    winCount := winCount + 1
//else if (up[testBarIndex] and close < close[testBarIndex]) or (down[testBarIndex] and close > close[testBarIndex])
//    label.new(bar_index, 0, "L", yloc = yloc.abovebar, color = color.red)
//    loseCount := loseCount + 1
//winRate = label.new(time + (time - time[1]) * 2, ohlc4, tostring(round(winCount / (winCount + loseCount) * 100)) + "%", xloc = xloc.bar_time, color = color.orange, style = label.style_label_left)
//if not na(winRate[1])
//    label.delete(winRate[1])