قلیل مدتی رجحان کے بعد الٹ حکمت عملی
جائزہ
ٹرینڈ ٹریکنگ الٹ حکمت عملی ایک قلیل مدتی رجحان ٹریڈنگ حکمت عملی ہے جو 15 منٹ کی این کیو فیوچر پر مبنی ہے۔ یہ رجحان کی لہر اور الٹ موڈ کی شناخت کے ذریعہ تجارتی مواقع کی تلاش کرتی ہے۔ یہ حکمت عملی آسان اور موثر ہے ، جو مختصر لائن متحرک تاجروں کے لئے موزوں ہے۔
حکمت عملی کا اصول
یہ حکمت عملی مندرجہ ذیل اصولوں پر مبنی ہے:
8 سائیکل ای ایم اے کو بطور اہم رجحان فلٹرنگ اشارے استعمال کریں ، ای ایم اے اوپر زیادہ ہے ، ای ایم اے نیچے کم ہے۔
مخصوص K-لائن الٹ موڈ کو انٹری سگنل کے طور پر شناخت کریں ، بشمول لمبی لمبی لمبی لمبی لمبی لمبی لمبی لمبی لمبی لمبی لمبی لمبی لمبی لمبی لمبی لمبی لمبی لمبی لمبی لمبی لمبی لمبی لمبی لمبی لمبی لمبی لمبی لمبی لمبی لمبی لمبی لمبی لمبی لمبی لمبی لمبی لمبی لمبی لمبی لمبی لمبی لمبی لمبی لمبی لمبی لمبی لمبی لمبی لمبی لمبی لمبی لمبی لمبی لمبی لمبی لمبی لمبی لمبی لمبی لمبی لمبی لمبی لمبی لمبی لمبی لمبی لمبی لمبی لمبی لمبی لمبی لمبی لمبی لمبی لمبی لمبی لمبی لمبی لمبی لمبی لمبی لمبی لمبی لمبی لمبی لمبی لمبی لمبی لمبی لمبی لمبی لمبی لمبی لمبی لمبی لمبی لمبی لمبی لمبی لمبی لمبی لمبی لمبی لمبی لمبی لمبی لمبی لمبی لمبی لمبی لمبی لمبی لمبی لمبی لمبی لمبی لم
انٹری پوائنٹ کو الٹ K لائن کی اونچائی یا نچلے حصے کے قریب ، اور اسٹاپ نقصان کو الٹ K لائن کی اونچائی یا نچلے حصے کے طور پر ترتیب دیا گیا ہے ، جس سے اعلی خطرہ واپسی کا تناسب حاصل ہوتا ہے۔
K لائن انٹیٹیٹ رشتہ کا استعمال کرتے ہوئے الٹا سگنل کی تاثیر کا فیصلہ کریں ، جیسے کہ نائن لائن اوپن قیمت پچھلے K لائن انٹیٹ سے زیادہ ہے ، جس میں مکمل طور پر شامل ہے اور اسی طرح کے قواعد شور کو فلٹر کریں۔
صرف مخصوص تجارتی اوقات میں کام کرنے کی حکمت عملی ، مارکیٹ میں اہم معاہدوں کی تبدیلی کے مہینے جیسے خاص اوقات سے گریز کریں ، غیر معمولی حالات سے غیر ضروری نقصانات کو روکیں۔
طاقت کا تجزیہ
اس حکمت عملی کے کچھ اہم فوائد یہ ہیں:
حکمت عملی کے اشارے سادہ اور موثر ہیں اور ان پر عمل درآمد کرنا آسان ہے۔
رجحانات اور الٹ کے فیصلے کی بنیاد پر ، گائے کی مارکیٹ اور ریچھ کی مارکیٹ کی دوہری ہلاکت سے بچیں۔
خطرے پر قابو پانے ، معقول اسٹاپ نقصان کی ترتیب ، فنڈ مینجمنٹ کے لئے موزوں۔
ڈیٹا کی ضرورت کم ہے ، مختلف سافٹ ویئر اور پلیٹ فارم کے استعمال کے لئے موزوں ہے۔
اعلی تجارتی تعدد ، جو سرمایہ کاروں کے لئے موزوں ہے جو مختصر لائن متحرک تجارت کے شوقین ہیں۔
خطرات اور ان کا مقابلہ
اس حکمت عملی کے ساتھ کچھ خطرات بھی ہیں، جن میں سے کچھ یہ ہیں:
ریورس شکل کے مواقع کم ہیں ، سگنل کم ہیں۔ ریورس فیصلے کے قواعد کو مناسب طریقے سے نرمی دی جاسکتی ہے۔
جعلی توڑنے کے مسئلے کے وقت ہوتا ہے۔ مزید فلٹرنگ اشارے شامل کیے جاسکتے ہیں تاکہ مشترکہ فیصلہ کیا جاسکے۔
نائٹ ڈسک اور غیر مرکزی دھارے کے وقت میں عدم استحکام ہے۔ صرف امریکی ٹریڈنگ کے اوقات میں کام کرنے کے لئے سیٹ کیا جاسکتا ہے۔
پیرامیٹرز کو بہتر بنانے کے لئے جگہ محدود ہے۔ بہتر پیرامیٹرز تلاش کرنے کے لئے مشین لرننگ اور دیگر تکنیکوں کو آزمائیں۔
اصلاح کی سمت
اس حکمت عملی کو بہتر بنانے کے لئے کچھ جگہ موجود ہے۔ اس میں مندرجہ ذیل اہم نکات شامل ہیں:
طویل عرصے تک ای ایم اے پیرامیٹرز کی جانچ پڑتال اور رجحانات کو بہتر بنانے کے لئے.
اضافی رجحان فلٹرنگ اشارے کے طور پر اسٹاک مارکیٹ انڈیکس میں اضافہ کرنا۔
مشین لرننگ جیسی ٹیکنالوجیز کا استعمال کرتے ہوئے خود کار طریقے سے داخلے اور اسٹاپ نقصان کے مقامات کو بہتر بنانا۔
پوزیشنوں میں اضافے اور اتار چڑھاؤ پر مبنی اسٹاپ نقصانات کے لئے متحرک ایڈجسٹمنٹ میکانزم۔
کثیر قسم کے اربیٹری کی کوشش کریں تاکہ ایک ہی قسم کے سسٹم کے خطرے کو مزید تقسیم کیا جاسکے۔
خلاصہ کریں۔
رجحان کا سراغ لگانے کی الٹ حکمت عملی مجموعی طور پر ایک بہت ہی عملی مختصر لائن حکمت عملی کا خیال ہے ، جس میں آسان پیرامیٹرز کم ہیں ، عملی طور پر چلانے میں آسان ہے ، ذاتی خطرے پر اچھی طرح سے قابو پا سکتا ہے ، جو فعال قسم کے مختصر لائن تاجروں کے لئے موزوں ہے۔ اس حکمت عملی میں ایک خاص اصلاح کی گنجائش ہے ، تحقیق اور ترقی کی ایک خاص مقدار میں سرمایہ کاری کی جاسکتی ہے ، یہاں تک کہ یہ درمیانے اور لمبی لائن فنڈز کے لئے بھی موزوں ہے۔
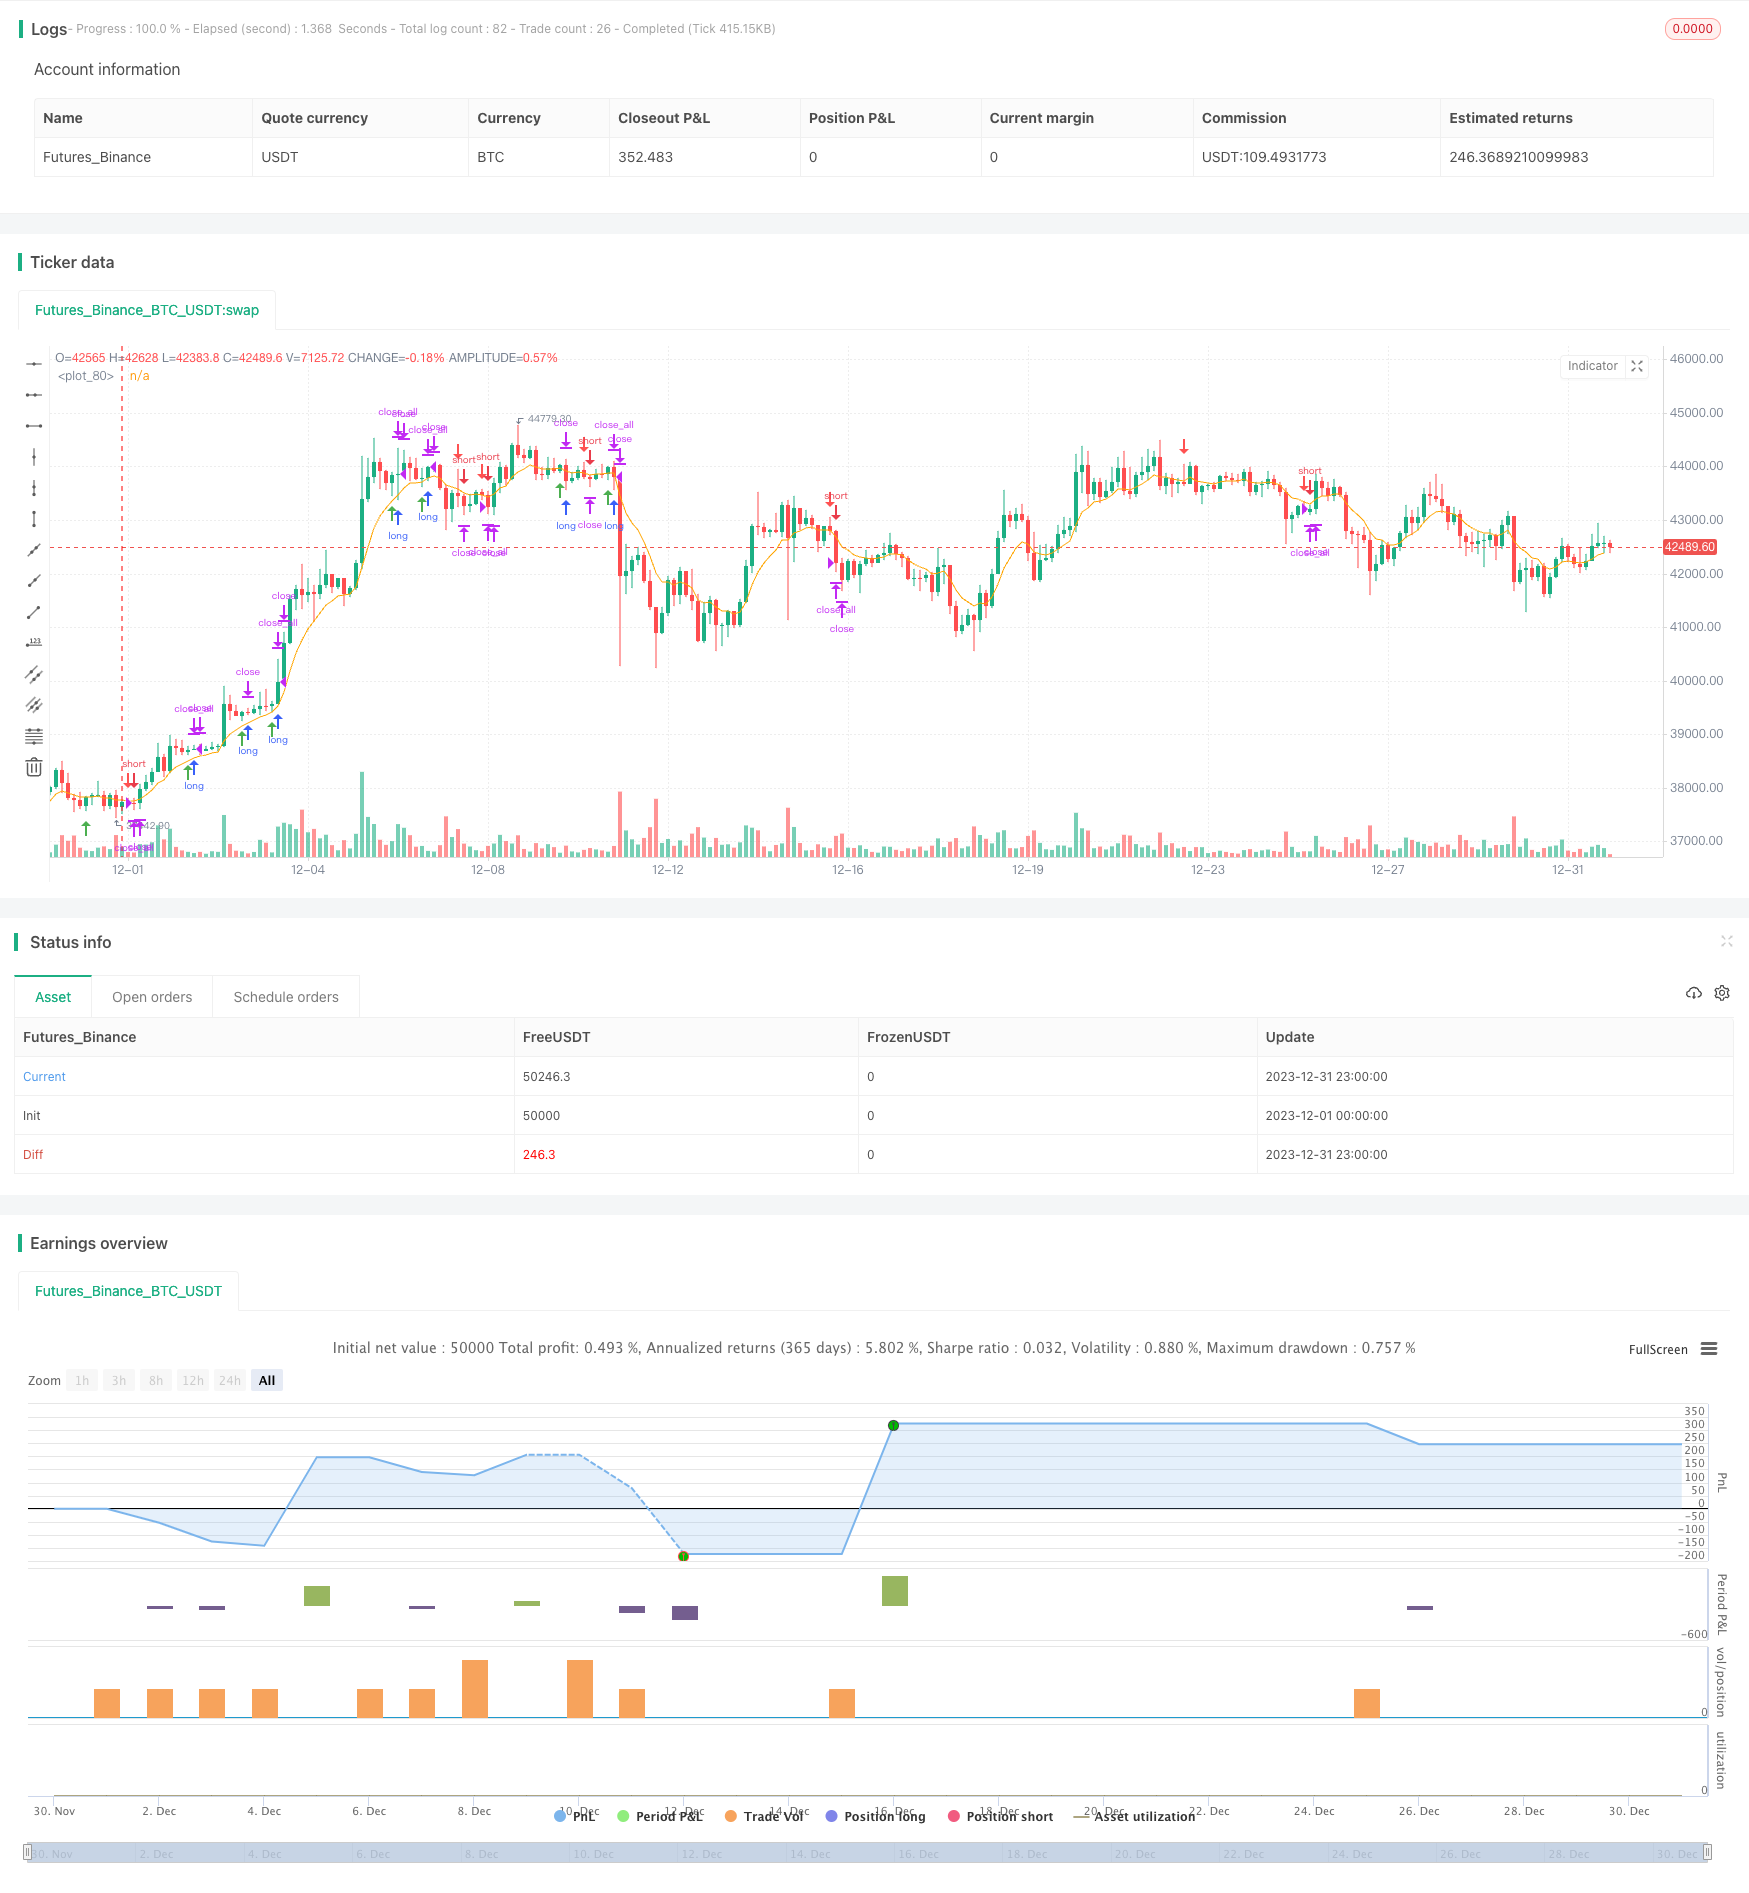
/*backtest
start: 2023-12-01 00:00:00
end: 2023-12-31 23:59:59
period: 3h
basePeriod: 15m
exchanges: [{"eid":"Futures_Binance","currency":"BTC_USDT"}]
*/

// This Pine Script™ code is subject to the terms of the Mozilla Public License 2.0 at https://mozilla.org/MPL/2.0/
// © bdrex95

//@version=5

// Rob Reversal Strategy - Official
// Using Rob Reversal Indicator: Original
// Description
// This indicator is based on the strategy created by Trader Rob on the NQ 15m chart.
//
// Timeframe for trading is 8:30am-1:15pm Central.
//
// Above the EMA line, look for a long position. You will have a short candle, then a long candle that opens below the short candle. It will have a lower high and a lower low. Once the long candle closes, your entry will be 1 tick above the wick (green line) and stop loss will be at the bottom of the bottom wick (red line).
//
// Below the EMA line, look for a short position. You will have a long candle, then a short candle that opens above the long candle. It will have a higher high and a higher low. Once the short candle closes, your entry will be 1 tick below the wick (green line) and stop loss will be at the top of the top wick (red line).
//

strategy("Trader Rob Reversal Strategy NQ 15min", shorttitle="Official Rob Rev Strat", overlay=true)


//--- Session Input ---
sess = input(defval = "0930-1415", title="Trading Session")
t = time(timeframe.period, sess)
sessionOpen = na(t) ? false : true

flat_time = input(defval = "1515-1558", title="Close All Open Trades")
ft = time(timeframe.period, flat_time)
flatOpen = na(ft) ? false : true


// Calculate start/end date and time condition
startDate = input(timestamp('2018-12-24T00:00:00'),group = "ALL STRATEGY SETTINGS BELOW")
finishDate = input(timestamp('2029-02-26T00:00:00'),group = "ALL STRATEGY SETTINGS BELOW")
time_cond = true


emaColor = input.color(color.orange, title="EMA Color")
emaLength = input.int(8, title="EMA Length")


emaInd = ta.ema(close, emaLength)


rr = input(1.0,"Enter RR",group = "TP/SL CONDITION INPUTS HERE")


sellShapeInput = input.string("Arrow", title="Sell Entry Shape", options=["Arrow", "Triangle"])
buyShapeInput = input.string("Arrow", title="Buy Entry Shape", options=["Arrow", "Triangle"])


sellShapeOption = switch sellShapeInput
    "Arrow" => shape.arrowdown
    "Triangle" => shape.triangledown

buyShapeOption = switch buyShapeInput
    "Arrow" => shape.arrowup
    "Triangle" => shape.triangleup


O = open
C = close
H = high
L = low


sellEntry = (C[1] > O[1]) and (C < O) and (H[1] < H) and (C < H[1]) and (C > L[1]) and (L > L[1]) and (C < emaInd) and sessionOpen and time_cond
buyEntry = (C[1] < O[1]) and (C > O) and (H[1] > H) and (L[1] > L) and (C < H[1]) and (C > L[1]) and (C > emaInd) and sessionOpen and time_cond


sellEntry_index = ta.valuewhen(sellEntry,bar_index,0)
sellEntry_hi = ta.valuewhen(sellEntry,high,0)
sellEntry_low = ta.valuewhen(sellEntry,low,0)
buyEntry_index = ta.valuewhen(buyEntry,bar_index,0)
buyEntry_hi = ta.valuewhen(buyEntry,high,0)
buyEntry_lo = ta.valuewhen(buyEntry,low,0)


plotshape(buyEntry, color = color.green, location = location.belowbar, style = buyShapeOption, size = size.small)
plotshape(sellEntry, color = color.red, location = location.abovebar, style = sellShapeOption, size = size.small)
plot(emaInd, color=emaColor)


// Risk Management
entry_price_long = (buyEntry_hi + syminfo.mintick)
entry_price_short = (sellEntry_low - syminfo.mintick)
long_sl_price = (buyEntry_lo-syminfo.mintick)
short_sl_price = (sellEntry_hi + syminfo.mintick)
long_tp_price = ((entry_price_long - long_sl_price)*rr) + entry_price_long
short_tp_price = entry_price_short - ((short_sl_price - entry_price_short)*rr)


long_sl_ticks = (entry_price_long - long_sl_price) / syminfo.mintick
short_sl_ticks = (short_sl_price - entry_price_short) / syminfo.mintick


long_tp_ticks = (long_tp_price - entry_price_long) / syminfo.mintick
short_tp_ticks = (entry_price_short - short_tp_price) / syminfo.mintick


// Positions
if (buyEntry)
    strategy.entry("Long", strategy.long,stop = H + syminfo.mintick)
if strategy.position_size > 0
    strategy.exit("Long Ex","Long", loss = long_sl_ticks, profit = long_tp_ticks, comment_loss = "SL Long", comment_profit = "TP Long")


if (sellEntry)
    strategy.entry("Short", strategy.short,stop = L - syminfo.mintick)
if strategy.position_size < 0
    strategy.exit("Short Ex","Short",loss = short_sl_ticks, profit = short_tp_ticks, comment_loss = "SL Short", comment_profit = "TP Short")


// Cancel order if close beyond ema
if (C < emaInd)
    strategy.cancel("Long")


if (C > emaInd)
    strategy.cancel("Short")


// Go flat at close (for futures funded account)
if strategy.position_size > 0 and flatOpen
    strategy.close_all(comment = "EOD Flat")
if strategy.position_size < 0 and flatOpen
    strategy.close_all(comment = "EOD Flat")

//END