کیپٹل کریو پر مبنی پوزیشن مینجمنٹ کی حکمت عملی
حکمت عملی کا جائزہ
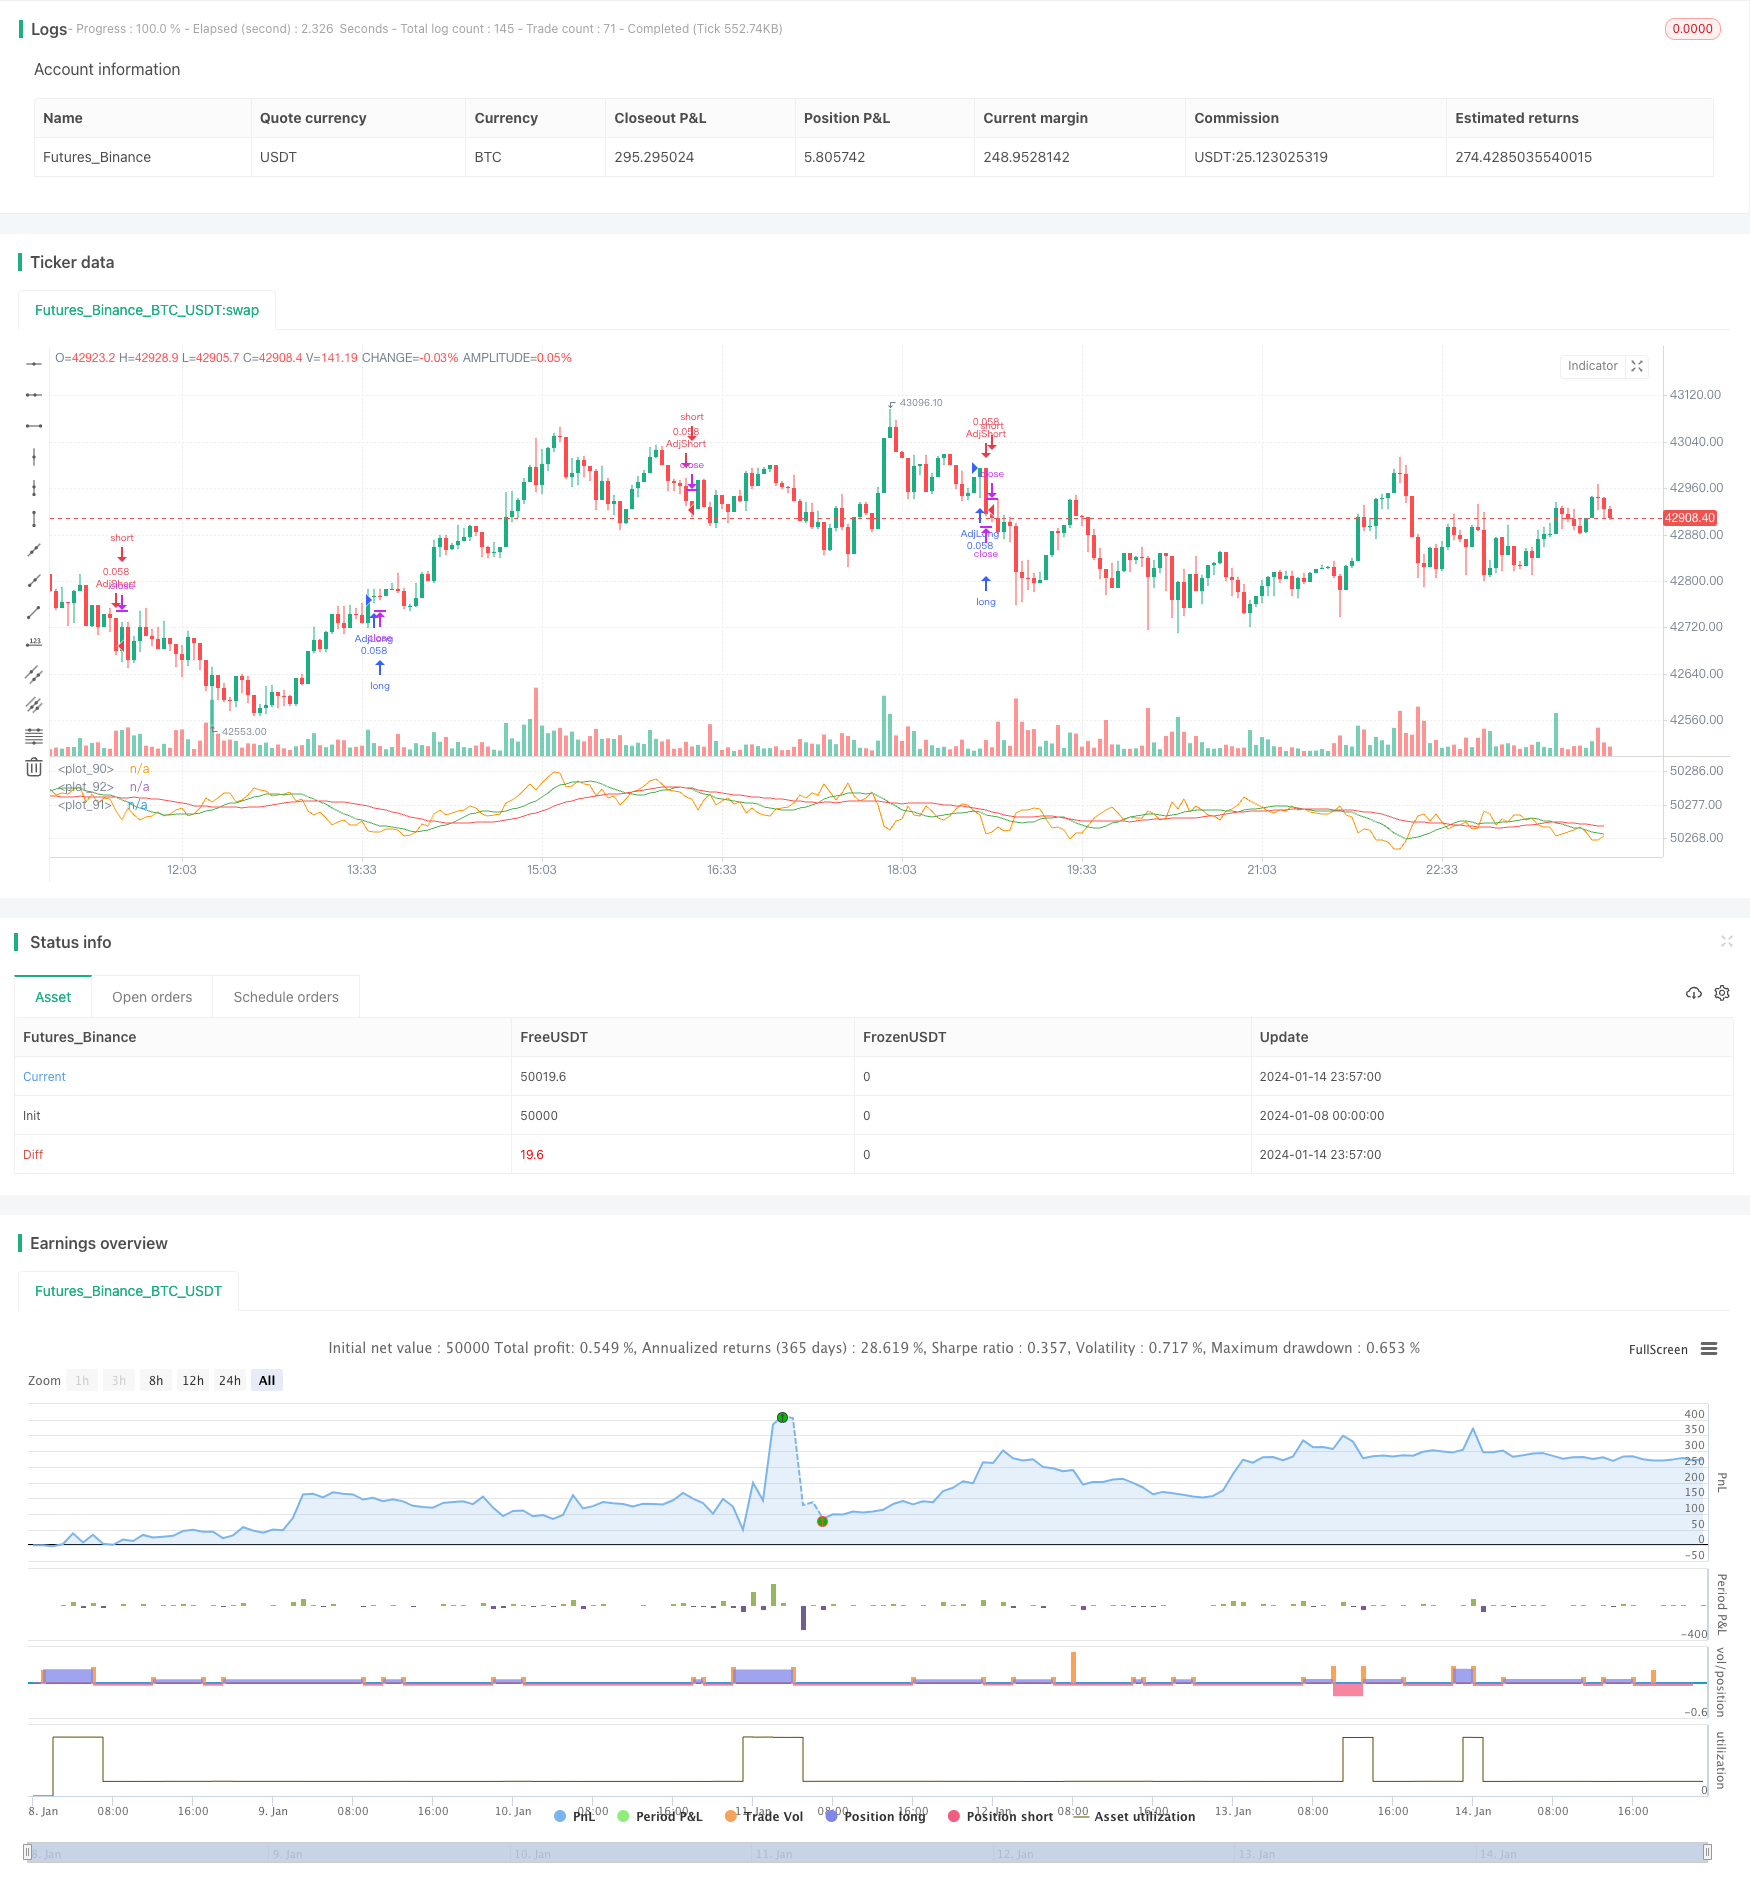
اس حکمت عملی کا بنیادی نظریہ یہ ہے کہ پوزیشنوں کو متحرک طور پر پیسے کی منحنی خطوط کے مطابق ایڈجسٹ کیا جائے ، جب منافع ہوتا ہے تو پوزیشنوں کو بڑھا دیا جائے ، اور جب نقصان ہوتا ہے تو پوزیشنوں کو کم کیا جائے ، تاکہ مجموعی خطرے کو کنٹرول کیا جاسکے۔ اس حکمت عملی میں تجارتی سگنل کی شناخت کے لئے ایک ہی وقت میں چانڈے کی حرکیات ، سپر ٹرینڈ اشارے اور حرکیات کے اشارے شامل ہیں۔
حکمت عملی کا اصول
اس حکمت عملی میں دو طریقوں کا استعمال کیا گیا ہے تاکہ یہ معلوم کیا جاسکے کہ آیا سرمایہ کاری کا منحنی خطوط نیچے کی طرف جارہا ہے: 1) سرمایہ کاری کا منحنی خطوط تیز اور سست سادہ حرکت پذیر اوسط کا حساب لگائیں ، اگر تیز SMA سست SMA سے کم ہے تو ، اسے نیچے کی طرف فیصلہ کیا جائے۔) 2) سرمایہ کاری کا منحنی خطوط اپنے آپ میں طویل دورانیے کی سادہ حرکت پذیر اوسط کا حساب لگائیں ، اگر سرمایہ کاری کا منحنی خطوط اس حرکت پذیر اوسط سے کم ہے تو ، اسے نیچے کی طرف فیصلہ کیا جائے۔
جب پیسے کی منحنی خطوط کو نیچے جانے کا فیصلہ کیا جاتا ہے تو ، پوزیشن سیٹ کے مطابق ایک خاص تناسب میں کمی یا اضافہ کرے گی۔ مثال کے طور پر ، اگر 50٪ کی کمی کا تعین کیا گیا ہے تو ، پہلے سے 10٪ پوزیشن 5٪ تک کم ہوجائے گی۔ اس حکمت عملی سے پوزیشن کا سائز بڑھ جاتا ہے جب منافع ہوتا ہے ، اور مجموعی خطرے کو کنٹرول کرنے کے لئے پوزیشن کا سائز کم ہوجاتا ہے۔
اسٹریٹجک فوائد
- سرمایہ کاری کے منحنی خطوط کا استعمال کرتے ہوئے نظام کے مجموعی نقصانات کا اندازہ لگانا ، پوزیشنوں کو متحرک طور پر ایڈجسٹ کرنا خطرے کو کنٹرول کرنے میں مدد کرتا ہے
- ایک سے زیادہ اشارے کے ساتھ شامل ہونے سے منافع کے امکانات میں اضافہ ہوتا ہے
- اپنی مرضی کے مطابق پوزیشن ایڈجسٹ کرنے کے پیرامیٹرز، مختلف خطرے کی ترجیحات کے مطابق
اسٹریٹجک رسک
- جب پوزیشن بڑھ جاتی ہے تو نقصان بھی بڑھ جاتا ہے
- پیرامیٹرز کی غلط ترتیب سے پوزیشن میں بہت زیادہ تبدیلی ہوسکتی ہے
- پوزیشن مینجمنٹ سسٹم کے خطرے سے مکمل طور پر بچ نہیں سکتی
آپٹمائزیشن
- مختلف پوزیشن ایڈجسٹمنٹ پیرامیٹرز کے اثرات کی جانچ
- پیسے کے منحنی خطوط کے بارے میں دیگر اشارے کے مجموعے کی کوشش کریں
- داخلے کی شرائط کو بہتر بنانا اور کامیابی کی شرح کو بہتر بنانا
خلاصہ کریں۔
اس حکمت عملی کا مجموعی نظریہ واضح ہے ، سرمایہ کاری کے منحنی خطوط کو متحرک طور پر پوزیشن میں ایڈجسٹ کرنے کے لئے استعمال کیا جاتا ہے ، خطرے کو مؤثر طریقے سے کنٹرول کیا جاسکتا ہے ، مزید جانچ اور اصلاح کے قابل ہے۔ پیرامیٹرز کی ترتیب اور نقصان کو روکنے کی حکمت عملی کو بھی کافی غور کرنے کی ضرورت ہے ، تاکہ شدت پسندی سے متعلق خطرات سے بچ سکے۔
/*backtest
start: 2024-01-08 00:00:00
end: 2024-01-15 00:00:00
period: 3m
basePeriod: 1m
exchanges: [{"eid":"Futures_Binance","currency":"BTC_USDT"}]
*/

// This source code is subject to the terms of the Mozilla Public License 2.0 at https://mozilla.org/MPL/2.0/
// © shardison
//@version=5

//EXPLANATION
//"Trading the equity curve" as a risk management method is the
//process of acting on trade signals depending on whether a system’s performance
//is indicating the strategy is in a profitable or losing phase.
//The point of managing equity curve is to minimize risk in trading when the equity curve is  in a downtrend.
//This strategy has two modes to determine the equity curve downtrend:
//By creating two simple moving averages of a portfolio's equity curve - a short-term
//and a longer-term one - and acting on their crossings. If the fast SMA is below
//the slow SMA, equity downtrend is detected (smafastequity < smaslowequity).
//The second method is by using the crossings of equity itself with the longer-period SMA (equity < smasloweequity).
//When "Reduce size by %" is active, the position size will be reduced by a specified percentage
//if the equity is "under water" according to a selected rule. If you're a risk seeker, select "Increase size by %"
//- for some robust systems, it could help overcome their small drawdowns quicker.

strategy("Use Trading the Equity Curve Postion Sizing", shorttitle="TEC", default_qty_type = strategy.percent_of_equity, default_qty_value = 10, initial_capital = 100000)

//TRADING THE EQUITY CURVE INPUTS
useTEC           = input.bool(true, title="Use Trading the Equity Curve Position Sizing")
defulttraderule  = useTEC ? false: true
initialsize      = input.float(defval=10.0, title="Initial % Equity")
slowequitylength = input.int(25, title="Slow SMA Period")
fastequitylength = input.int(9, title="Fast SMA Period")
seedequity = 100000 * .10
if strategy.equity == 0
    seedequity
else
    strategy.equity
slowequityseed   = strategy.equity > seedequity ? strategy.equity : seedequity
fastequityseed   = strategy.equity > seedequity ? strategy.equity : seedequity
smaslowequity    = ta.sma(slowequityseed, slowequitylength)
smafastequity    = ta.sma(fastequityseed, fastequitylength)
equitycalc       = input.bool(true, title="Use Fast/Slow Avg", tooltip="Fast Equity Avg is below Slow---otherwise if unchecked uses Slow Equity Avg below Equity")
sizeadjstring    = input.string("Reduce size by (%)", title="Position Size Adjustment", options=["Reduce size by (%)","Increase size by (%)"])
sizeadjint       = input.int(50, title="Increase/Decrease % Equity by:")
equitydowntrendavgs = smafastequity < smaslowequity
slowequitylessequity = strategy.equity < smaslowequity

equitymethod = equitycalc ? equitydowntrendavgs : slowequitylessequity

if sizeadjstring == ("Reduce size by (%)")
    sizeadjdown = initialsize * (1 - (sizeadjint/100))
else
    sizeadjup = initialsize * (1 + (sizeadjint/100))
c = close
qty = 100000 * (initialsize / 100) / c
if useTEC and equitymethod
    if sizeadjstring == "Reduce size by (%)"
        qty := (strategy.equity * (initialsize / 100) * (1 - (sizeadjint/100))) / c
    else
        qty := (strategy.equity * (initialsize / 100) * (1 + (sizeadjint/100))) / c

//EXAMPLE TRADING STRATEGY INPUTS
CMO_Length = input.int(defval=9, minval=1, title='Chande Momentum Length')
CMO_Signal = input.int(defval=10, minval=1, title='Chande Momentum Signal')

chandeMO = ta.cmo(close, CMO_Length)
cmosignal = ta.sma(chandeMO, CMO_Signal)

SuperTrend_atrPeriod = input.int(10, "SuperTrend ATR Length")
SuperTrend_Factor = input.float(3.0, "SuperTrend Factor", step = 0.01)
Momentum_Length = input.int(12, "Momentum Length")
price = close

mom0 = ta.mom(price, Momentum_Length)
mom1 = ta.mom( mom0, 1)
[supertrend, direction] = ta.supertrend(SuperTrend_Factor, SuperTrend_atrPeriod)
stupind = (direction < 0 ? supertrend : na)
stdownind = (direction < 0? na : supertrend)

//TRADING CONDITIONS
longConditiondefault = ta.crossover(chandeMO, cmosignal) and (mom0 > 0 and mom1 > 0 and close > stupind) and defulttraderule
if (longConditiondefault)
    strategy.entry("DefLong", strategy.long, qty=qty)

shortConditiondefault = ta.crossunder(chandeMO, cmosignal) and (mom0 < 0 and mom1 < 0 and close < stdownind) and defulttraderule
if (shortConditiondefault)
    strategy.entry("DefShort", strategy.short, qty=qty)

longCondition = ta.crossover(chandeMO, cmosignal) and (mom0 > 0 and mom1 > 0 and close > stupind) and useTEC
if (longCondition)
    strategy.entry("AdjLong", strategy.long, qty = qty)

shortCondition = ta.crossunder(chandeMO, cmosignal) and (mom0 < 0 and mom1 < 0 and close < stdownind) and useTEC
if (shortCondition)
    strategy.entry("AdjShort", strategy.short, qty = qty)
plot(strategy.equity)
plot(smaslowequity, color=color.new(color.red, 0))
plot(smafastequity, color=color.new(color.green, 0))