ADX اشارے پر مبنی تجارتی حکمت عملی
جائزہ
اس حکمت عملی کا بنیادی مقصد مارکیٹ کے رجحانات کا اندازہ لگانے کے لئے ADX اشارے کا استعمال کرنا ہے ، اور DI + - اشارے کے فرق کے ساتھ خود بخود توڑ پھوڑ کی شناخت کرنا ہے ، تاکہ خود کار طریقے سے تجارت کی جاسکے۔ DI + اور ADX کے درمیان فرق طے شدہ حد سے زیادہ ہونے پر زیادہ کام کریں ، اور جب DI- اور ADX کے درمیان فرق طے شدہ حد سے زیادہ ہو تو خالی ہوجائیں۔ یہ حکمت عملی رجحانات کے توڑ پھوڑ کی خود بخود شناخت کرسکتی ہے ، جس میں انسانی مداخلت کی ضرورت نہیں ہے ، اور درمیانی لمبی لائن کے لئے موزوں ہے۔
حکمت عملی کا اصول
ٹرو رینج ، ڈائریکشنل موومنٹ کے اشارے کا حساب لگائیں ، اور DI + ، DI- ، DX اور ADX جیسے اشارے حاصل کریں۔
DI+ اور ADX کے فرق کی طول و عرض 1 کا موازنہ کریں ، DI- اور ADX کے فرق کی طول و عرض 2۔
جب طول و عرض 1 سیٹ کی حد سے زیادہ ہو تو کثیر سگنل پیدا ہوتا ہے (جیسے 10) ؛ جب طول و عرض 2 سیٹ کی حد سے زیادہ ہو تو خالی سگنل پیدا ہوتا ہے (جیسے 10).
اور ADX کو غلط سگنل کو فلٹر کرنے کے لئے DI+ اور DI- کے درمیان درمیانی ضرورت ہوتی ہے۔
اس طرح ، جب مارکیٹ رجحان کی حالت میں داخل ہوتا ہے تو ، DI + یا DI- ADX سے نمایاں طور پر آگے نکل جاتا ہے ، جس سے تجارت کا اشارہ ہوتا ہے۔ جب مارکیٹ کا رجحان ختم ہوتا ہے تو ، DI + ، DI- اور ADX دوبارہ قریب ہوجاتے ہیں ، اور اونچائی اور زوال کی پیروی سے بچ جاتے ہیں۔
اسٹریٹجک فوائد
ٹرانسمیشن کے نقطہ نظر کو خود کار طریقے سے پہچاننے کے لئے، انسانی فیصلے کی ضرورت نہیں.
مختلف مارکیٹ کے حالات کے مطابق ڈی آئی اور اے ڈی ایکس کے فرق کی قیمت کو لچکدار طریقے سے ایڈجسٹ کریں۔
ADX اشارے کے ساتھ مل کر ، غلط سگنل کو مؤثر طریقے سے فلٹر کریں۔
طویل عرصے سے اسٹاک ہولڈنگ ، زیادہ بار بار تجارت کی ضرورت نہیں ، فنڈز کا زیادہ استعمال۔
اس کے علاوہ، اس نے کہا کہ اس کی وجہ یہ ہے کہ اس کی وجہ سے اس کی وجہ سے اس کی وجہ سے ہے.
اسٹریٹجک رسک
ADX اشارے پیچھے رہ گئے ، ممکنہ طور پر شارٹ لائن ٹریڈنگ کے مواقع سے محروم ہوگئے۔ حساسیت کو بڑھانے کے لئے ADX کے پیرامیٹرز کو دوسرے اشارے یا کم کرنے کے ساتھ جوڑا جاسکتا ہے۔
زلزلے کے حالات میں آسانی سے سوٹ کیا جاسکتا ہے۔ آپ کو روکنے کی حکمت عملی متعارف کرانے یا ADX فلٹرنگ کی شرائط کو کم کرنے کے لئے سوٹ کی امکان کو کم کرنے کے لئے شامل کیا جاسکتا ہے۔
بڑے پیمانے پر رجحان کی تبدیلی کے دوران نقصان کا خطرہ بہت زیادہ ہوتا ہے۔ خطرے کو کنٹرول کرنے کے لئے موبائل اسٹاپ یا ٹریکنگ اسٹاپ قائم کیا جاسکتا ہے۔
حکمت عملی کی اصلاح
مختلف مارکیٹوں اور اقسام کی جانچ پڑتال کی جاسکتی ہے تاکہ بہترین پیرامیٹرز کا مجموعہ ایڈجسٹ کیا جاسکے۔
سگنل کی درستگی کو بہتر بنانے کے لئے دوسرے اشارے کے ساتھ مل کر غور کیا جاسکتا ہے۔ مثال کے طور پر MACD ، KD وغیرہ۔
واپسی اور زیادہ سے زیادہ نقصان کو کنٹرول کرنے کے لئے سٹاپ نقصان کی حکمت عملی میں اضافہ کریں.
پوزیشن مینجمنٹ متعارف کروانا ، مارکیٹ کے حالات کے مطابق تجارتی پوزیشنوں کو ایڈجسٹ کرنا۔
ٹرانزیکشن کے خطرات کو کم کرنے کے لئے داخلہ پوائنٹ کے انتخاب اور باہر نکلنے کے حالات کو بہتر بنائیں۔
خلاصہ کریں۔
اس حکمت عملی میں ADX اور DI اشارے کی خوبیوں کو مربوط کیا گیا ہے ، جس سے رجحانات کا موثر فیصلہ اور خود کو اپنانے کی تجارت ممکن ہے۔ اس میں بار بار مشق کرنے کی ضرورت نہیں ہے ، جو درمیانی لمبی لائن کے لئے موزوں ہے۔ اس کے ساتھ ہی کچھ خطرہ بھی موجود ہے ، جس میں معاون تکنیکی اشارے اور فنڈ مینجمنٹ کے ذرائع کو شامل کرنے کی ضرورت ہے۔ اس سے حکمت عملی کی استحکام میں بہتری آسکتی ہے۔ اس حکمت عملی کا نظریہ قابل اعتماد ، منطقی طور پر واضح ہے ، جو گہری تحقیق اور اطلاق کے قابل ہے۔
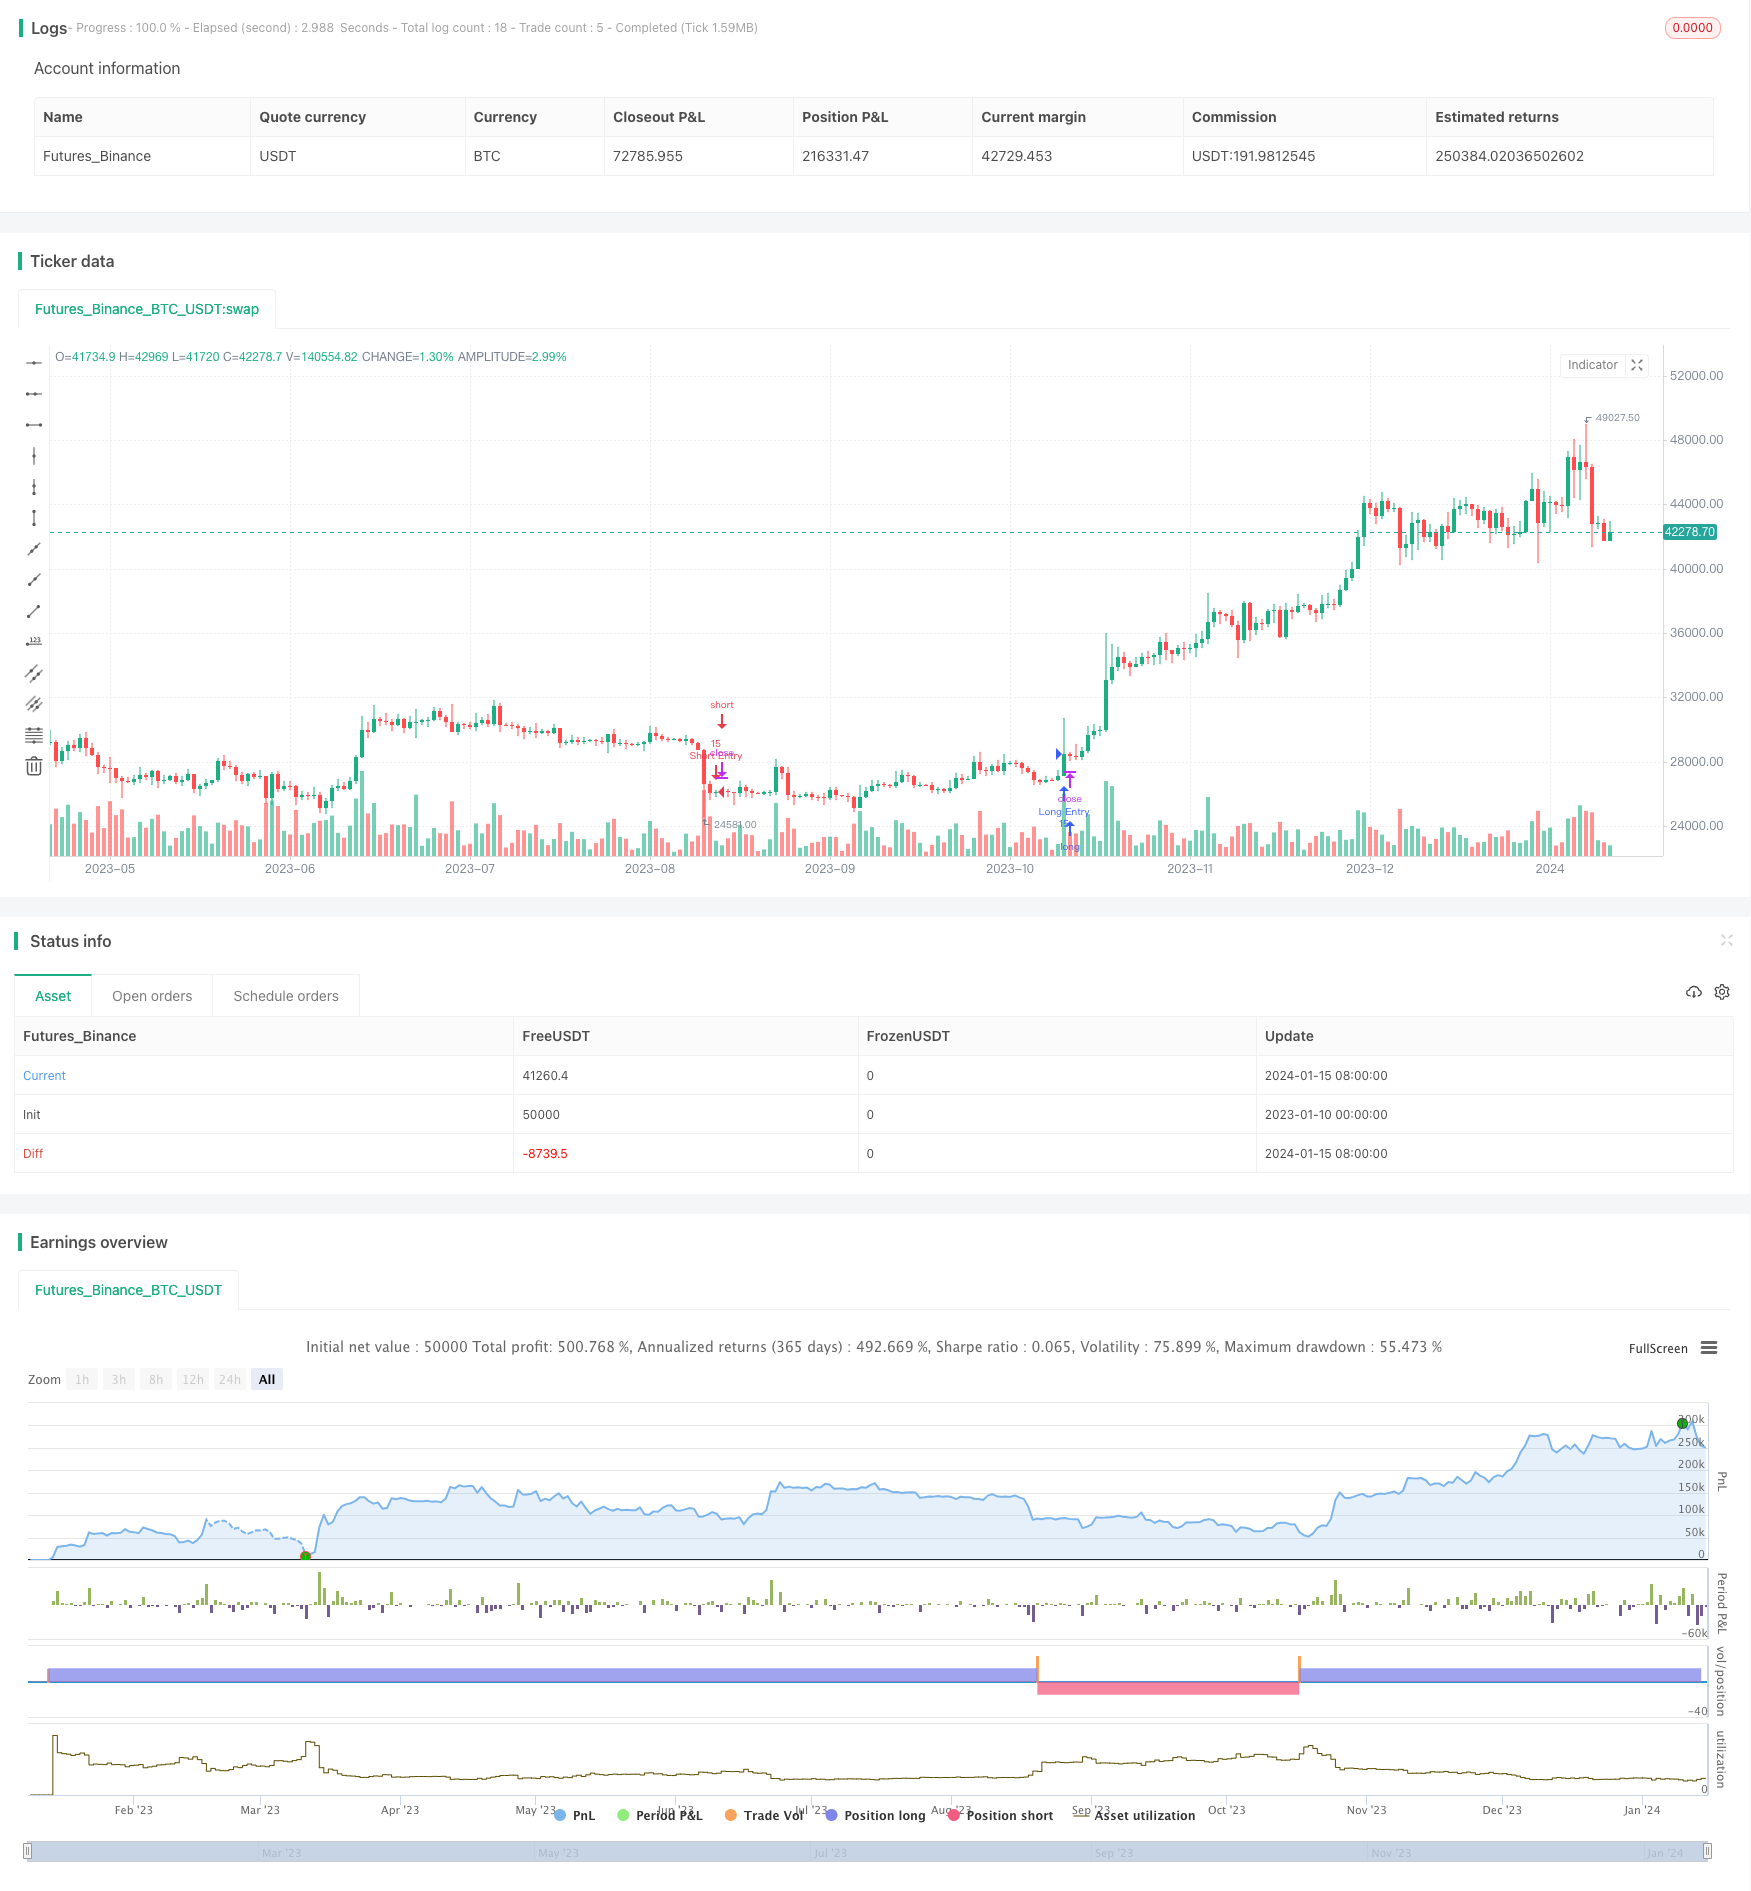
/*backtest
start: 2023-01-10 00:00:00
end: 2024-01-16 00:00:00
period: 1d
basePeriod: 1h
exchanges: [{"eid":"Futures_Binance","currency":"BTC_USDT"}]
*/

// This source code is subject to the terms of the Mozilla Public License 2.0 at https://mozilla.org/MPL/2.0/
// © MAURYA_ALGO_TRADER

//@version=5
strategy("Monthly Performance by Dr. Maurya", overlay=true, default_qty_value = 15, commission_type = strategy.commission.percent, commission_value = 0.1)


len = input(14)
th = input(20)

TrueRange = math.max(math.max(high - low, math.abs(high - nz(close[1]))), math.abs(low - nz(close[1])))
DirectionalMovementPlus = high - nz(high[1]) > nz(low[1]) - low ? math.max(high - nz(high[1]), 0) : 0
DirectionalMovementMinus = nz(low[1]) - low > high - nz(high[1]) ? math.max(nz(low[1]) - low, 0) : 0

SmoothedTrueRange = 0.0
SmoothedTrueRange := nz(SmoothedTrueRange[1]) - nz(SmoothedTrueRange[1]) / len + TrueRange

SmoothedDirectionalMovementPlus = 0.0
SmoothedDirectionalMovementPlus := nz(SmoothedDirectionalMovementPlus[1]) - nz(SmoothedDirectionalMovementPlus[1]) / len + DirectionalMovementPlus

SmoothedDirectionalMovementMinus = 0.0
SmoothedDirectionalMovementMinus := nz(SmoothedDirectionalMovementMinus[1]) - nz(SmoothedDirectionalMovementMinus[1]) / len + DirectionalMovementMinus

DIPlus = SmoothedDirectionalMovementPlus / SmoothedTrueRange * 100
DIMinus = SmoothedDirectionalMovementMinus / SmoothedTrueRange * 100
DX = math.abs(DIPlus - DIMinus) / (DIPlus + DIMinus) * 100
ADX = ta.sma(DX, len)


//diff_1 = math.abs(DIPlus - DIMinus)
diff_2 = math.abs(DIPlus-ADX)
diff_3 = math.abs(DIMinus - ADX)

long_diff = input(10, "Long Difference")
short_diff = input(10, "Short Difference")

buy_condition = diff_2 >=long_diff and diff_3 >=long_diff and (ADX < DIPlus and ADX > DIMinus)
sell_condition = diff_2 >=short_diff and diff_3 >=short_diff and (ADX > DIPlus and ADX < DIMinus)


if buy_condition
    strategy.entry("Long Entry", strategy.long, comment = "Long")
if sell_condition
    strategy.entry("Short Entry", strategy.short, comment = "Short")


// Copy below code to end of the desired strategy script
///////////////////////////////////////////////////////////////////////////////////////////////////////////////////////
//                                 monthly pnl performance  by Dr. Maurya @MAURYA_ALGO_TRADER                        //
///////////////////////////////////////////////////////////////////////////////////////////////////////////////////////
show_performance = input.bool(true, 'Show Monthly Monthly Performance ?', group='Monthly Performance')

dash_loc_mp = input("Bottom Right","Location"  ,options=["Top Right","Bottom Right","Top Left","Bottom Left", "Middle Right","Bottom Center"]  ,group='Monthly Performance', inline = "performance")

text_size_mp = input('Small',"Size"  ,options=["Tiny","Small","Normal","Large"]  ,group='Monthly Performance', inline = "performance")

bg_c = input.color( color.rgb(7, 226, 242, 38), "Background Color", group='Monthly Performance')

text_head_color = input.color( color.rgb(0,0,0), "Month/Year Heading Color", group='Monthly Performance')

tab_month_c = input.color( color.white, "Month PnL Data Color", group='Monthly Performance')

tab_year_c = input.color( color.rgb(0,0,0), "Year PnL Data Color", group='Monthly Performance')

border_c = input.color( color.white, "Table Border Color", group='Monthly Performance')


var table_position_mp = dash_loc_mp == 'Top Left' ? position.top_left :
  dash_loc_mp == 'Bottom Left' ? position.bottom_left :
  dash_loc_mp == 'Middle Right' ? position.middle_right :
  dash_loc_mp == 'Bottom Center' ? position.bottom_center :
  dash_loc_mp == 'Top Right' ? position.top_right : position.bottom_right

var table_text_size_mp = text_size_mp == 'Tiny' ? size.tiny :
  text_size_mp == 'Small' ? size.small :
  text_size_mp == 'Normal' ? size.normal : size.large

/////////////////
strategy.initial_capital =50000

/////////////////////////////////////////////

// var bool new_month = na
new_month = ta.change(month) //> 0 ? true : false
newest_month = new_month and strategy.closedtrades >= 1

// profit
only_profit = strategy.netprofit
initial_balance = strategy.initial_capital

// month number
var int month_number = na
month_number := (ta.valuewhen(newest_month, month(time), 0)) //and month(time) > 1 ? (ta.valuewhen(newest_month, month(time), 0) - 1) :  12 //1 to 12

//month_year
var int month_time = na
month_time := ta.valuewhen(newest_month, time, 0) - 2419200000


var int m_counter = 0
if newest_month
    m_counter += 1


// current month values
var bool new_year = na
new_year := ta.change(year)
curr_m_pnl = only_profit - nz(ta.valuewhen(newest_month, only_profit, 0), 0)
curr_m_number = newest_month ? ta.valuewhen(newest_month, month(time), 0) : month(time)
curr_y_pnl = (only_profit - nz(ta.valuewhen(new_year, only_profit, 0),0))


var float [] net_profit_array = array.new_float()
var int [] month_array = array.new_int()
var int [] month_time_array = array.new_int()


if newest_month
    array.push(net_profit_array, only_profit)
    array.push(month_array, month_number)
    array.push(month_time_array, month_time)


var float [] y_pnl_array = array.new_float()
var int [] y_number_array = array.new_int()
var int [] y_time_array = array.new_int()

newest_year = ta.change(year) and strategy.closedtrades >= 1
get_yearly_pnl = nz(ta.valuewhen(newest_year, strategy.netprofit, 0) - nz(ta.valuewhen(newest_year, strategy.netprofit, 1), 0), 0)
get_m_year = ta.valuewhen(newest_year, year(time), 1)
get_y_time = ta.valuewhen(newest_year, time, 0)

if newest_year
    array.push(y_pnl_array, get_yearly_pnl)
    array.push(y_number_array, get_m_year)
    array.push(y_time_array, get_y_time)
var float monthly_profit = na
var int column_month_number = na
var int row_month_time = na


var testTable = table.new(position = table_position_mp, columns = 14, rows = 40, bgcolor = bg_c, border_color = border_c, border_width = 1)
if barstate.islastconfirmedhistory and show_performance
    table.cell(table_id = testTable, column = 0, row = 0, text = "YEAR", text_color = text_head_color, text_size=table_text_size_mp)
    table.cell(table_id = testTable, column = 1, row = 0, text = "JAN", text_color = text_head_color, text_size=table_text_size_mp)
    table.cell(table_id = testTable, column = 2, row = 0, text = "FEB", text_color = text_head_color, text_size=table_text_size_mp)
    table.cell(table_id = testTable, column = 3, row = 0, text = "MAR", text_color = text_head_color, text_size=table_text_size_mp)
    table.cell(table_id = testTable, column = 4, row = 0, text = "APR", text_color = text_head_color, text_size=table_text_size_mp)
    table.cell(table_id = testTable, column = 5, row = 0, text = "MAY", text_color = text_head_color, text_size=table_text_size_mp)
    table.cell(table_id = testTable, column = 6, row = 0, text = "JUN", text_color = text_head_color, text_size=table_text_size_mp)
    table.cell(table_id = testTable, column = 7, row = 0, text = "JUL", text_color = text_head_color, text_size=table_text_size_mp)
    table.cell(table_id = testTable, column = 8, row = 0, text = "AUG", text_color = text_head_color, text_size=table_text_size_mp)
    table.cell(table_id = testTable, column = 9, row = 0, text = "SEP", text_color = text_head_color, text_size=table_text_size_mp)
    table.cell(table_id = testTable, column = 10, row = 0, text = "OCT", text_color = text_head_color, text_size=table_text_size_mp)
    table.cell(table_id = testTable, column = 11, row = 0, text = "NOV", text_color = text_head_color, text_size=table_text_size_mp)
    table.cell(table_id = testTable, column = 12, row = 0, text = "DEC", text_color =text_head_color, text_size=table_text_size_mp)
    table.cell(table_id = testTable, column = 13, row = 0, text = "YEAR P/L", text_color = text_head_color, text_size=table_text_size_mp)

    for i = 0 to (array.size(y_number_array) == 0 ? na : array.size(y_number_array) - 1)
        row_y = year(array.get(y_time_array, i)) - year(array.get(y_time_array, 0)) + 1
        table.cell(table_id = testTable, column = 13, row = row_y, text = str.tostring(array.get(y_pnl_array , i), "##.##") + '\n' + '(' + str.tostring(array.get(y_pnl_array , i)*100/initial_balance, "##.##") + ' %)', bgcolor = array.get(y_pnl_array , i) > 0 ? color.green : array.get(y_pnl_array , i) < 0 ? color.red : color.gray, text_color = tab_year_c, text_size=table_text_size_mp)
    curr_row_y = array.size(month_time_array) == 0 ? 1 : (year(array.get(month_time_array, array.size(month_time_array) - 1))) - (year(array.get(month_time_array, 0))) + 1
    table.cell(table_id = testTable, column = 13, row = curr_row_y, text = str.tostring(curr_y_pnl, "##.##") + '\n' + '(' + str.tostring(curr_y_pnl*100/initial_balance, "##.##") + ' %)', bgcolor = curr_y_pnl > 0 ? color.green : curr_y_pnl < 0 ? color.red : color.gray, text_color = tab_year_c, text_size=table_text_size_mp)


    for i = 0 to (array.size(net_profit_array) == 0 ? na : array.size(net_profit_array) - 1)
        monthly_profit := i > 0 ? ( array.get(net_profit_array, i) - array.get(net_profit_array, i - 1) ) : array.get(net_profit_array, i)
        column_month_number := month(array.get(month_time_array, i))
        row_month_time :=((year(array.get(month_time_array, i))) - year(array.get(month_time_array, 0)) ) + 1
        table.cell(table_id = testTable, column = column_month_number, row = row_month_time, text = str.tostring(monthly_profit, "##.##") + '\n' + '(' + str.tostring(monthly_profit*100/initial_balance, "##.##") + ' %)', bgcolor = monthly_profit > 0 ? color.green : monthly_profit < 0 ? color.red : color.gray, text_color = tab_month_c, text_size=table_text_size_mp)
        table.cell(table_id = testTable, column = 0, row =row_month_time, text = str.tostring(year(array.get(month_time_array, i)), "##.##"), text_color = text_head_color, text_size=table_text_size_mp)

    curr_row_m = array.size(month_time_array) == 0 ? 1 : (year(array.get(month_time_array, array.size(month_time_array) - 1))) - (year(array.get(month_time_array, 0))) + 1
    table.cell(table_id = testTable, column = curr_m_number, row = curr_row_m, text = str.tostring(curr_m_pnl, "##.##") + '\n' + '(' + str.tostring(curr_m_pnl*100/initial_balance, "##.##") + ' %)', bgcolor = curr_m_pnl > 0 ? color.green : curr_m_pnl < 0 ? color.red : color.gray, text_color = tab_month_c, text_size=table_text_size_mp)
    table.cell(table_id = testTable, column = 0, row =curr_row_m, text = str.tostring(year(time), "##.##"), text_color = text_head_color, text_size=table_text_size_mp)

//============================================================================================================================================================================