صبر کے ساتھ رجحان کی پیروی کرنے والی حکمت عملی پر عمل کریں۔
جائزہ
صبر سے رجحانات کی پیروی کرنے والی حکمت عملی ایک رجحانات کی پیروی کرنے والی حکمت عملی ہے۔ یہ حرکت پذیر اوسط کے اشارے کے مجموعے کا استعمال کرتے ہوئے رجحانات کی سمت کا تعین کرتی ہے ، اور اس کے ساتھ مل کر اوپریلوڈ اوپریلوڈ اشارے سی سی آئی کے ساتھ تجارت کا اشارہ کرتی ہے۔ یہ حکمت عملی بڑے رجحانات کی پیروی کرتی ہے ، جو زلزلے کے حالات میں مؤثر طریقے سے بیعانہ سے بچ سکتی ہے۔
حکمت عملی کا اصول
اس حکمت عملی میں 21 اور 55 ادوار کے ای ایم اے کا مجموعہ استعمال کیا گیا ہے تاکہ اس رجحان کی سمت کا تعین کیا جاسکے۔ جب قلیل مدتی ای ایم اے طویل مدتی ای ایم اے کے اوپر ہوتا ہے تو اسے اوپر کی طرف رجحان کے طور پر بیان کیا جاتا ہے اور جب قلیل مدتی ای ایم اے طویل مدتی ای ایم اے کے نیچے ہوتا ہے تو اسے نیچے کی طرف رجحان کے طور پر بیان کیا جاتا ہے۔
سی سی آئی اشارے کو اوورلوڈ اوور سیل کا فیصلہ کرنے کے لئے استعمال کیا جاتا ہے۔ سی سی آئی کے اوپر سے 100 لائن کے نیچے اوورلوڈ سگنل کے لئے ، نیچے سے 100 لائن کے نیچے اوورلوڈ سگنل کے لئے۔ سی سی آئی اشارے کی مختلف اوورلوڈ اوور سیل لائنوں کے مطابق ، حکمت عملی کو ٹریڈنگ سگنل کی طاقت کے تین درجوں میں تقسیم کیا گیا ہے۔
اگر سی سی آئی اشارے نے اوپر کی طرف مضبوط اوپری فروخت کا اشارہ کیا تو ، اس میں ایک سے زیادہ داخلہ لیا جائے گا۔ اگر سی سی آئی اشارے نے اوپر کی طرف مضبوط اوپری فروخت کا اشارہ کیا تو ، اس میں ایک سے زیادہ داخلہ لیا جائے گا۔
اسٹاپ نقصان لائن کو سپر ٹرینڈ اشارے کے طور پر مقرر کیا گیا ہے ، اور ہدف منافع کو ایک مقررہ تعداد میں پوائنٹس کے طور پر مقرر کیا گیا ہے۔
طاقت کا تجزیہ
اس حکمت عملی کے اہم فوائد یہ ہیں:
- بڑے رجحانات کو ٹریک کریں اور دھوکہ دہی سے بچیں
- سی سی آئی کے اشارے میں تبدیلی کے نقطہ نظر کا اندازہ لگانے میں مدد ملے گی
- سپر ٹرینڈ اسٹاپ لائن کی ترتیب معقول ہے
- فکسڈ سٹاپ نقصان اور فکسڈ سٹاپ، خطرے کو کنٹرول
خطرے کا تجزیہ
اس حکمت عملی میں مندرجہ ذیل خطرات شامل ہیں:
- بڑے رجحانات کے بارے میں غلط فہمی کا امکان
- سی سی آئی اشارے کے غلط سگنل کا امکان
- اسٹاپ نقصان کی حد سے زیادہ یا زیادہ گہرائی سے غیر ضروری نقصان کا امکان
- فکسڈ اسٹاپس کے ذریعہ رجحانات کی مسلسل پیروی نہ کرنے کا امکان
ان خطرات کے ل we ، ہم EMA سائیکل پیرامیٹرز ، CCI پیرامیٹرز اور اسٹاپ نقصان کی روک تھام کی جگہ کو ایڈجسٹ کرکے ان کو بہتر بناسکتے ہیں۔ اس کے ساتھ ہی ، حکمت عملی کے اشارے کی توثیق کے لئے مزید اشارے متعارف کروانا بھی ضروری ہے۔
اصلاح کی سمت
اس حکمت عملی میں مندرجہ ذیل اصلاحات شامل ہیں:
1۔ زیادہ سے زیادہ اشارے کے مجموعے کی جانچ کرنا تاکہ بہتر رجحانات کا تعین کیا جا سکے اور سگنل کی توثیق کے اشارے۔
2 ۔ اے ٹی آر کے متحرک سٹاپ نقصان کو بہتر طور پر رجحانات کی پیروی اور خطرے کو کنٹرول کرنے کے لئے استعمال کریں ۔
رجحانات کے امکانات کا اندازہ لگانے کے لئے تاریخی اعداد و شمار کی تربیت پر مبنی مشین لرننگ ماڈل متعارف کروائیں۔
مختلف اقسام کے پیرامیٹرز کے لئے ایڈجسٹمنٹ کو بہتر بنائیں۔
خلاصہ کریں۔
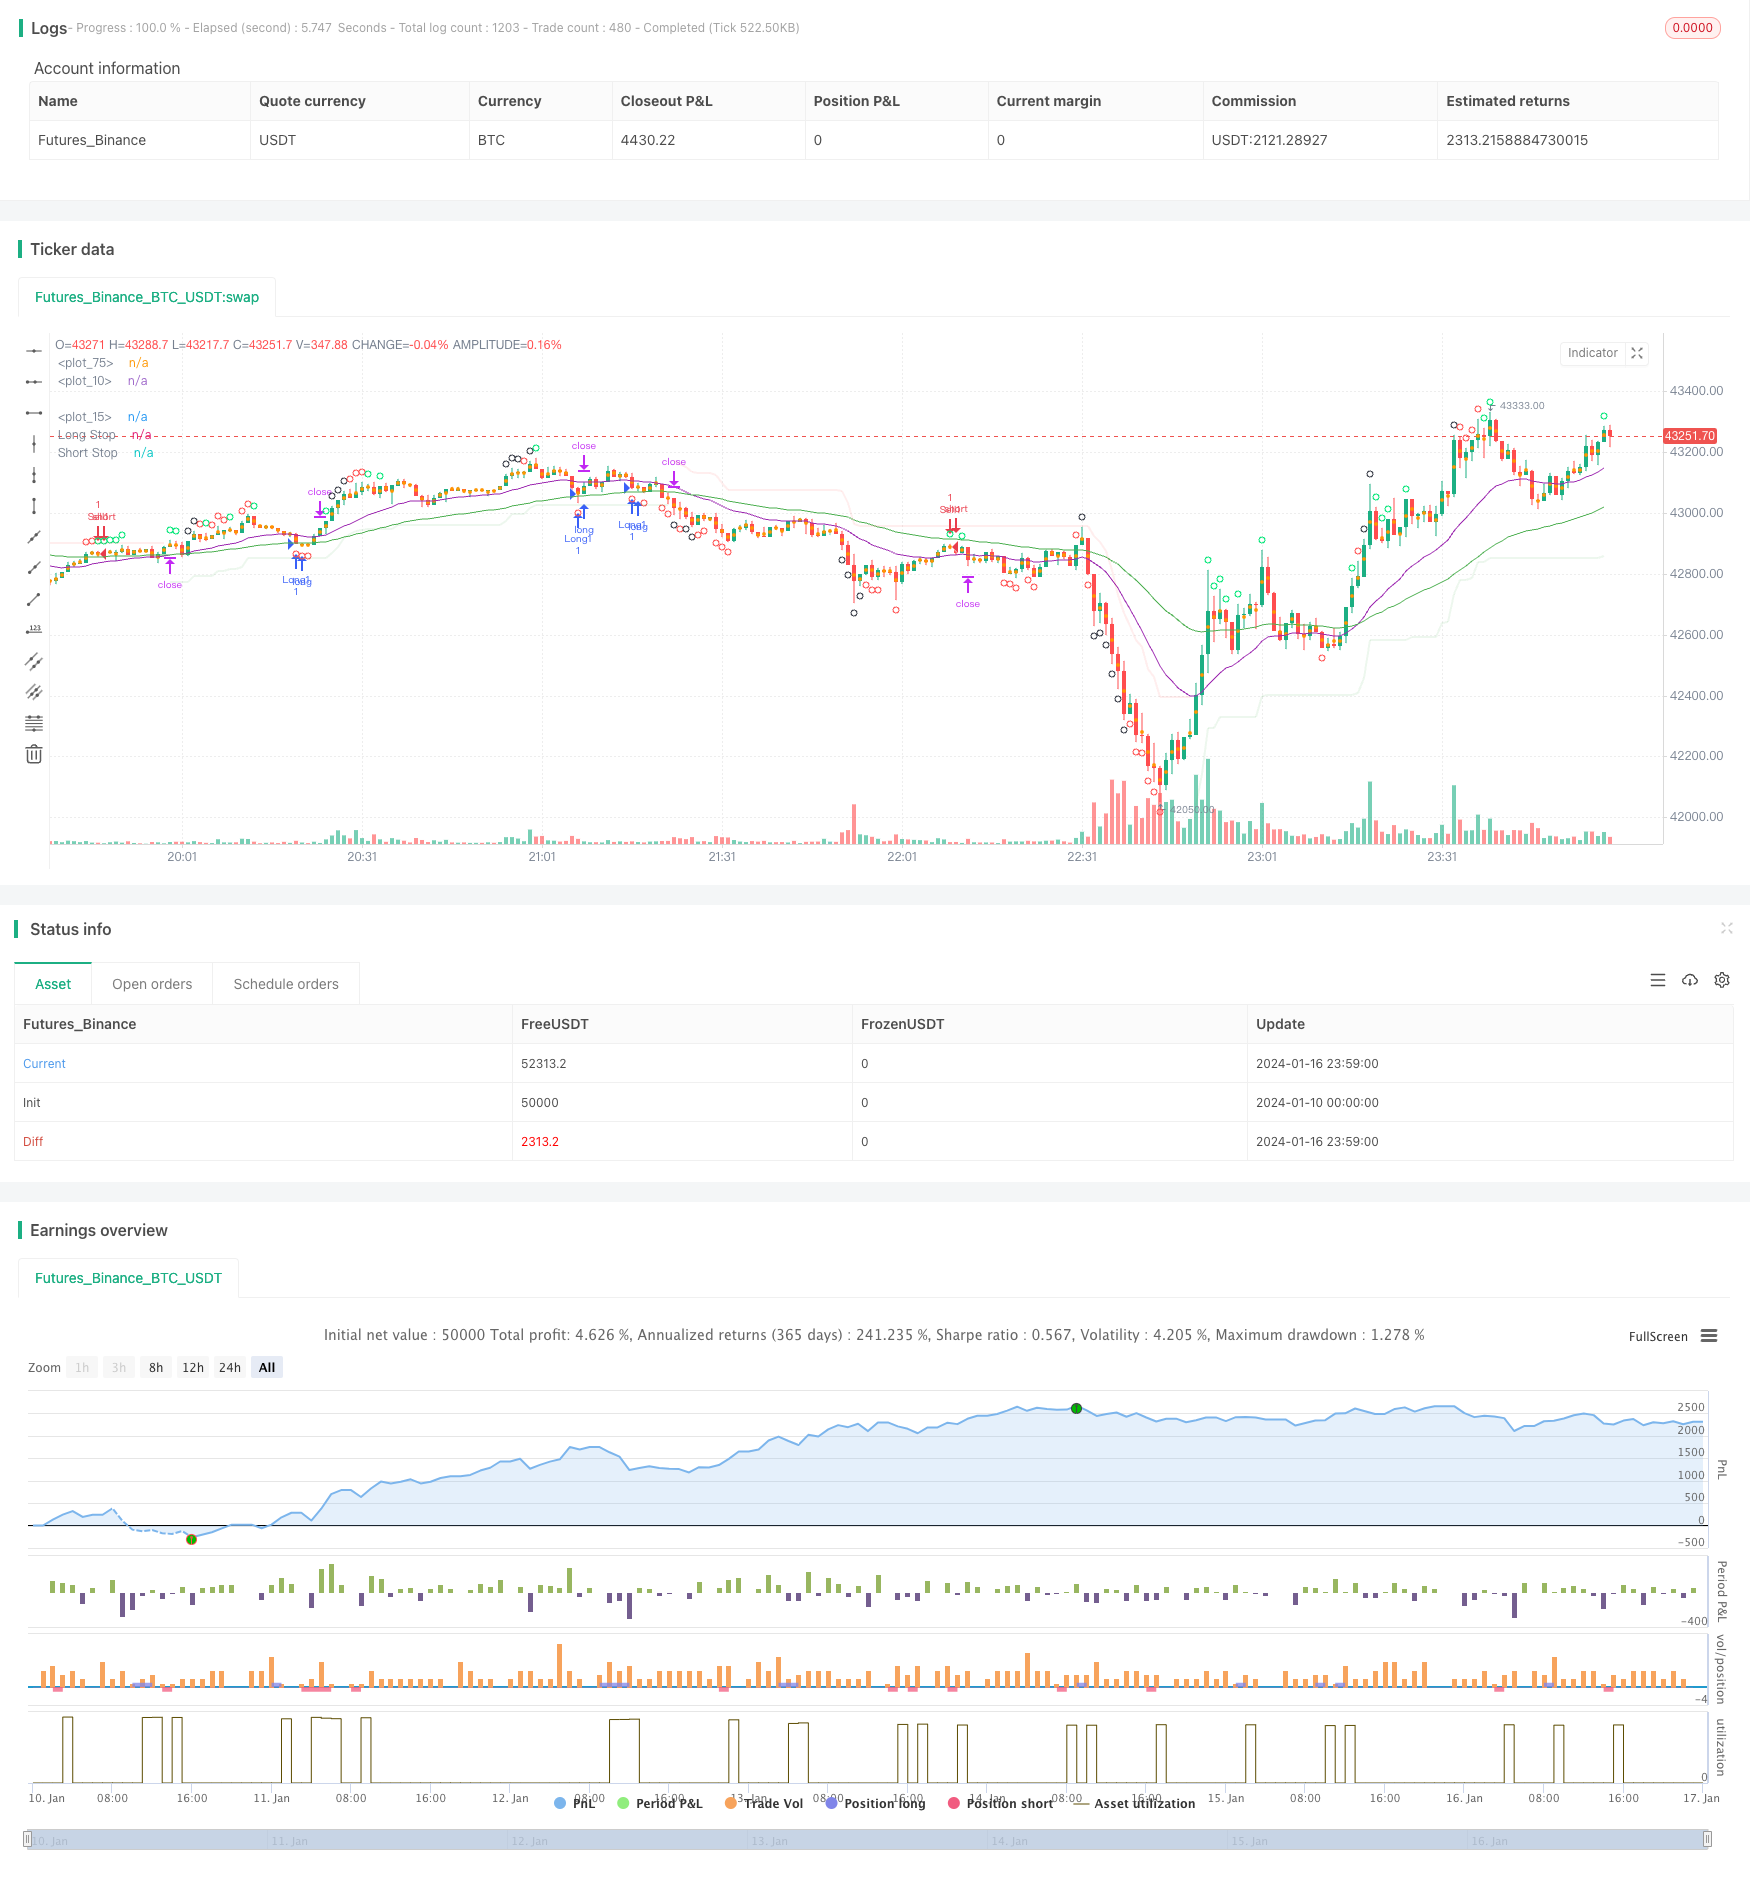
صبر سے رجحانات کی پیروی کرنے والی حکمت عملی مجموعی طور پر ایک بہت ہی عملی رجحانات کی پیروی کرنے والی حکمت عملی ہے۔ اس میں بڑے رجحانات کی سمت کا تعین کرنے کے لئے چلتی اوسط کا استعمال کیا جاتا ہے ، سی سی آئی اشارے نے الٹ پوائنٹ سگنل کا پتہ لگایا ہے ، اور سپر ٹرینڈ اسٹاپ لائن کی ترتیب معقول ہے۔ اس حکمت عملی کو پیرامیٹرز کی ایڈجسٹمنٹ اور کثیر اشارے کے مجموعے کی توثیق کے ذریعہ مزید بہتر بنایا جاسکتا ہے ، جو طویل مدتی ریئل اسٹیک ٹریکنگ کی توثیق کے قابل ہے۔
/*backtest
start: 2024-01-10 00:00:00
end: 2024-01-17 00:00:00
period: 1m
basePeriod: 1m
exchanges: [{"eid":"Futures_Binance","currency":"BTC_USDT"}]
*/

// This source code is subject to the terms of the Mozilla Public License 2.0 at https://mozilla.org/MPL/2.0/
// © greenmask9

//@version=4
strategy("Patient Trendfollower (7) Strategy", overlay=true)

// 21 EMA
emalength = input(21, title="Short EMA")
emashort = ema(close, emalength)
plot(emashort, color = color.purple, linewidth=1)

// 55 EMA
emalength2 = input(55, title="Long EMA")
ema = ema(close, emalength2)
plot(ema, color = color.green, linewidth=1)

//CCI calculation and inputs
lengthcci = input(20, minval=1, title="Overbought/sold detector period")
src = input(close, title="Overbought/sold detector source")
ma = sma(src, lengthcci)
ccivalue = (src - ma) / (0.015 * dev(src, lengthcci))


//CCI plotting
ccioverbought = input(defval=100, title="Overbought level 1")
ccioverbought2 = input(defval=140, title="Overbought level 2")
ccioverbought3 = input(defval=180, title="Overbought level 3")

ccioversold = input(defval=-100, title="Oversold level 1")
ccioversold2 = input(defval=-140, title="Oversold level 2")
ccioversold3 = input(defval=-180, title="Oversold level 3")

cciOB = (ccivalue >= ccioverbought and ccivalue < ccioverbought2)
plotshape(cciOB,  title= "Overbought", location=location.abovebar, color=color.lime, transp=0, style=shape.circle)
cciOS = (ccivalue <= ccioversold and ccivalue > ccioversold2)
plotshape(cciOS, title= "Oversold", location=location.belowbar, color=color.lime, transp=0, style=shape.circle)

cciOB2 = (ccivalue >= ccioverbought2 and ccivalue < ccioverbought3)
plotshape(cciOB2,  title= "Overbought", location=location.abovebar, color=color.red, transp=0, style=shape.circle)
cciOS2 = (ccivalue <= ccioversold and ccivalue > ccioversold3)
plotshape(cciOS2, title= "Oversold", location=location.belowbar, color=color.red, transp=0, style=shape.circle)

cciOB3 = (ccivalue >= ccioverbought3)
plotshape(cciOB3,  title= "Overbought", location=location.abovebar, color=color.black, transp=0, style=shape.circle)
cciOS3 = (ccivalue <= ccioversold3)
plotshape(cciOS3, title= "Oversold", location=location.belowbar, color=color.black, transp=0, style=shape.circle)

//Supertrend

length = input(title="ATR Period", type=input.integer, defval=55)
mult = input(title="ATR Multiplier", type=input.float, step=0.1, defval=5.0)
wicks = input(title="Take Wicks into Account ?", type=input.bool, defval=true)
illuminate = input(title="Illuminate Trend", type=input.bool, defval=true)

atr = mult * atr(length)

longStop = hl2 - atr
longStopPrev = nz(longStop[1], longStop)
longStop := (wicks ? low[1] : close[1]) > longStopPrev ? max(longStop, longStopPrev) : longStop

shortStop = hl2 + atr
shortStopPrev = nz(shortStop[1], shortStop)
shortStop := (wicks ? high[1] : close[1]) < shortStopPrev ? min(shortStop, shortStopPrev) : shortStop

dir = 1
dir := nz(dir[1], dir)
dir := dir == -1 and (wicks ? high : close) > shortStopPrev ? 1 : dir == 1 and (wicks ? low : close) < longStopPrev ? -1 : dir

longColor = color.new(color.green, 90)
shortColor = color.new(color.red, 90)
noneColor = color.new(color.white, 100)

longStopPlot = plot(dir == 1 ? longStop : na, title="Long Stop", style=plot.style_linebr, linewidth=2, color=longColor)
shortStopPlot = plot(dir == 1 ? na : shortStop, title="Short Stop", style=plot.style_linebr, linewidth=2, color=shortColor)
midPricePlot = plot(ohlc4, title="", style=plot.style_circles, linewidth=0)

longFillColor = illuminate ? (dir == 1 ? longColor : noneColor) : noneColor
shortFillColor = illuminate ? (dir == -1 ? shortColor : noneColor) : noneColor
fill(midPricePlot, longStopPlot, title="Long State Filling", color=longFillColor)
fill(midPricePlot, shortStopPlot, title="Short State Filling", color=shortFillColor)

//entries
uptrend = emashort>ema and dir == 1
upsignal = ccivalue<=ccioversold and ccivalue>ccioversold2
upsignal2 = ccivalue<=ccioversold2 and ccivalue>ccioversold3
upsignal3 = ccivalue<=ccioversold3
downtrend = emashort<ema and dir == -1
downsignal = ccivalue>=ccioverbought and ccivalue<ccioverbought2
downsignal2 = ccivalue>=ccioverbought2 and ccivalue<ccioverbought3
downsignal3 = ccivalue>=ccioverbought3

//adapts to the current bar, I need to save the bars number when the condition for buy was true, static number is spread
spread = input (0.00020, title="Spread")
upstoploss = longStop - spread
downstoploss = shortStop + spread
strategy.initial_capital = 50000
ordersize=floor(strategy.initial_capital/close)
testlong = input(title="Test longs", type=input.bool, defval=true)
testshort = input(title="Test shorts", type=input.bool, defval=true)
//new
degree = input(title="Test level 1 overbought/sold levels", type=input.bool, defval=true)
degree2 = input(title="Test level 2 overbought/sold levels", type=input.bool, defval=false)
degree3 = input(title="Test level 3 overbought/sold levels", type=input.bool, defval=false)

statictarget = input(title="Use static target", type=input.bool, defval=true)
statictargetvalue = input(title="Static target in pips", type=input.integer, defval=400)

//timetrade = input(title="Open trades only withing specified time", type=input.bool, defval=true)
//timtrade = input()

//přidat možnost TP podle ATR a sl podle ATR
buy1 = uptrend and upsignal and strategy.opentrades==0 and testlong and degree
x1 = barssince (buy1)
if (buy1)
//bodlo by zakázat atrtarget v tomto případě
    if (statictarget)
        strategy.entry("Long1", strategy.long, ordersize)
        strategy.exit( "Exitlong", from_entry="Long1" , profit=statictargetvalue,stop=upstoploss[x1])

buy2 = uptrend and upsignal2 and strategy.opentrades==0 and testlong and degree2
x2 = barssince (buy2)
if (buy2)
//bodlo by zakázat atrtarget v tomto případě
    if (statictarget)
        strategy.entry("Long2", strategy.long, ordersize)
        strategy.exit( "Exitlong", from_entry="Long2" , profit=statictargetvalue,stop=upstoploss[x2])

buy3 = uptrend and upsignal3 and strategy.opentrades==0 and testlong and degree3
x3 = barssince (buy3)
if (buy3)
//bodlo by zakázat atrtarget v tomto případě
    if (statictarget)
        strategy.entry("Long3", strategy.long, ordersize)
        strategy.exit( "Exitlong", from_entry="Long3" , profit=statictargetvalue,stop=upstoploss[x3])

sell1 = downtrend and downsignal and strategy.opentrades==0 and testshort and degree
y1 = barssince (sell1)
if (sell1)
    if (statictarget)
        strategy.entry("Sell1", strategy.short, ordersize)
        strategy.exit( "Exitshort", from_entry="Sell1" , profit=statictargetvalue,stop=downstoploss[y1])

sell2 = downtrend and downsignal2 and strategy.opentrades==0 and testshort and degree2
y2 = barssince (sell2)
if (sell2)
    if (statictarget)
        strategy.entry("Sell2", strategy.short, ordersize)
        strategy.exit( "Exitshort", from_entry="Sell2" , profit=statictargetvalue,stop=downstoploss[y2])

sell3 = downtrend and downsignal3 and strategy.opentrades==0 and testshort and degree3
y3 = barssince (sell3)
if (sell3)
    if (statictarget)
        strategy.entry("Sell3", strategy.short, ordersize)
        strategy.exit( "Exitshort", from_entry="Sell3" , profit=statictargetvalue,stop=downstoploss[y3])