مومنٹم انڈیکیٹر اور ڈر انڈیکس کراس اوور حکمت عملی
تخلیق کی تاریخ:
2024-01-23 14:27:23
آخر میں ترمیم کریں:
2024-01-23 14:27:23
کاپی:
3
کلکس کی تعداد:
665
1
پر توجہ دیں
1750
پیروکار
جائزہ
یہ حکمت عملی مارکیٹ کے رجحانات کا اندازہ لگانے کے لئے متحرک اشارے اور خوفناک اشارے کی کراسنگ کا حساب لگاتی ہے ، اور جب دونوں اشارے کسی خاص کراسنگ پر ہوتے ہیں تو فروخت کا اشارہ دیتے ہیں تاکہ بڑے پیمانے پر گرنے والے رجحانات کو پکڑ سکے۔
حکمت عملی کا اصول
- 50 سائیکل حرکیاتی اشارے کا حساب لگائیں۔ یہ 50 سائیکل سے پہلے کی قیمتوں کے مقابلے میں تبدیلی کی نمائندگی کرتا ہے۔
- 22 سائیکلوں کے لئے گھبراہٹ انڈیکس ترمیم کی قیمتوں کا حساب لگائیں۔ یہ مارکیٹ میں گھبراہٹ کے جذبات کو سب سے زیادہ قیمتوں اور کم قیمتوں کے تناسب سے ظاہر کرتا ہے۔
- جب متحرک اشارے خوفناک اشارے سے نیچے ہوتے ہیں تو ، مارکیٹ میں نیچے کی طرف دباؤ ہوتا ہے۔
- اگر انڈیکس خطرے کے علاقے میں گرنے کا سلسلہ جاری رکھتا ہے تو ، ایک مضبوط فروخت کا اشارہ دیا جاتا ہے۔
طاقت کا تجزیہ
- مارکیٹ میں ٹریڈنگ کے جذبات کے اشارے ، خوف و ہراس کے اشارے کا استعمال کرتے ہوئے ، مارکیٹ کی ساختی تبدیلیوں کا اندازہ لگانا ممکن ہے۔
- متحرک اشارے قیمتوں میں تبدیلی کی رفتار اور طاقت کا اندازہ لگانے میں مدد کرسکتے ہیں ، جس سے مارکیٹ کے رجحانات میں تبدیلی کا اندازہ لگایا جاسکتا ہے۔
- دو مختلف اقسام کے اشارے کے ساتھ مل کر ، اچانک واقعات کی شناخت کی درستگی کو بہتر بنایا جاسکتا ہے۔
- پیرامیٹرز کو ایڈجسٹ کرکے ، مختلف مارکیٹ کے حالات کے مطابق لچکدار ہونا۔
خطرے کا تجزیہ
- گھبراہٹ کے انڈیکس کو متحرک اشارے کے ساتھ جوڑنا ہر بار کافی کمی کی ضمانت نہیں دیتا ہے۔ حتمی فیصلے کے لئے دوسرے اشارے کو جوڑنے کی ضرورت ہے۔
- فروخت کے بعد کوئی اسٹاپ نقصان کی ترتیب نہیں ہے ، نقصان کو مؤثر طریقے سے کنٹرول نہیں کیا جاسکتا ہے۔
- واپسی اور دوبارہ مارکیٹ میں داخل ہونے کے بارے میں غور نہیں کیا گیا ہے۔ حکمت عملی صرف اچانک کمی کو پکڑنے کے لئے موزوں ہے۔
اصلاح کی سمت
- فروخت کے بعد نقصانات کو کنٹرول کرنے کے لئے ایک سٹاپ نقصان مقرر کریں.
- دوسرے اشارے کے فیصلے کو بڑھانا ، سگنل کی وشوسنییتا کو بہتر بنانا۔ جیسے ٹرانزیکشن حجم ، برلن لائن وغیرہ۔
- مارکیٹ میں واپسی کے سگنل کو بڑھانا تاکہ حکمت عملی طویل مدتی سائیکل کو مکمل طور پر چلانے کے قابل ہو۔
- پیرامیٹرز کو بہتر بنانے کے لئے ، بہترین پیرامیٹرز کا مجموعہ تلاش کریں۔
خلاصہ کریں۔
یہ حکمت عملی مارکیٹ میں کمی کی انتباہات کو متحرک اشارے اور گھبراہٹ کے اشارے کے ساتھ منسلک کرتی ہے۔ یہ مارکیٹ میں اچانک کمی کو مؤثر طریقے سے پکڑ سکتی ہے۔ تاہم ، یہ حکمت عملی صرف مختصر لائن کے استعمال کے لئے موزوں ہے ، جس میں کوئی باہر نکلنے کا طریقہ کار اور خطرہ کنٹرول نہیں ہے۔ مستقبل میں اسے بہتر بنانے کی ضرورت ہے ، تاکہ یہ ایک طویل لائن پائیدار حکمت عملی ہو۔
حکمت عملی کا ماخذ کوڈ
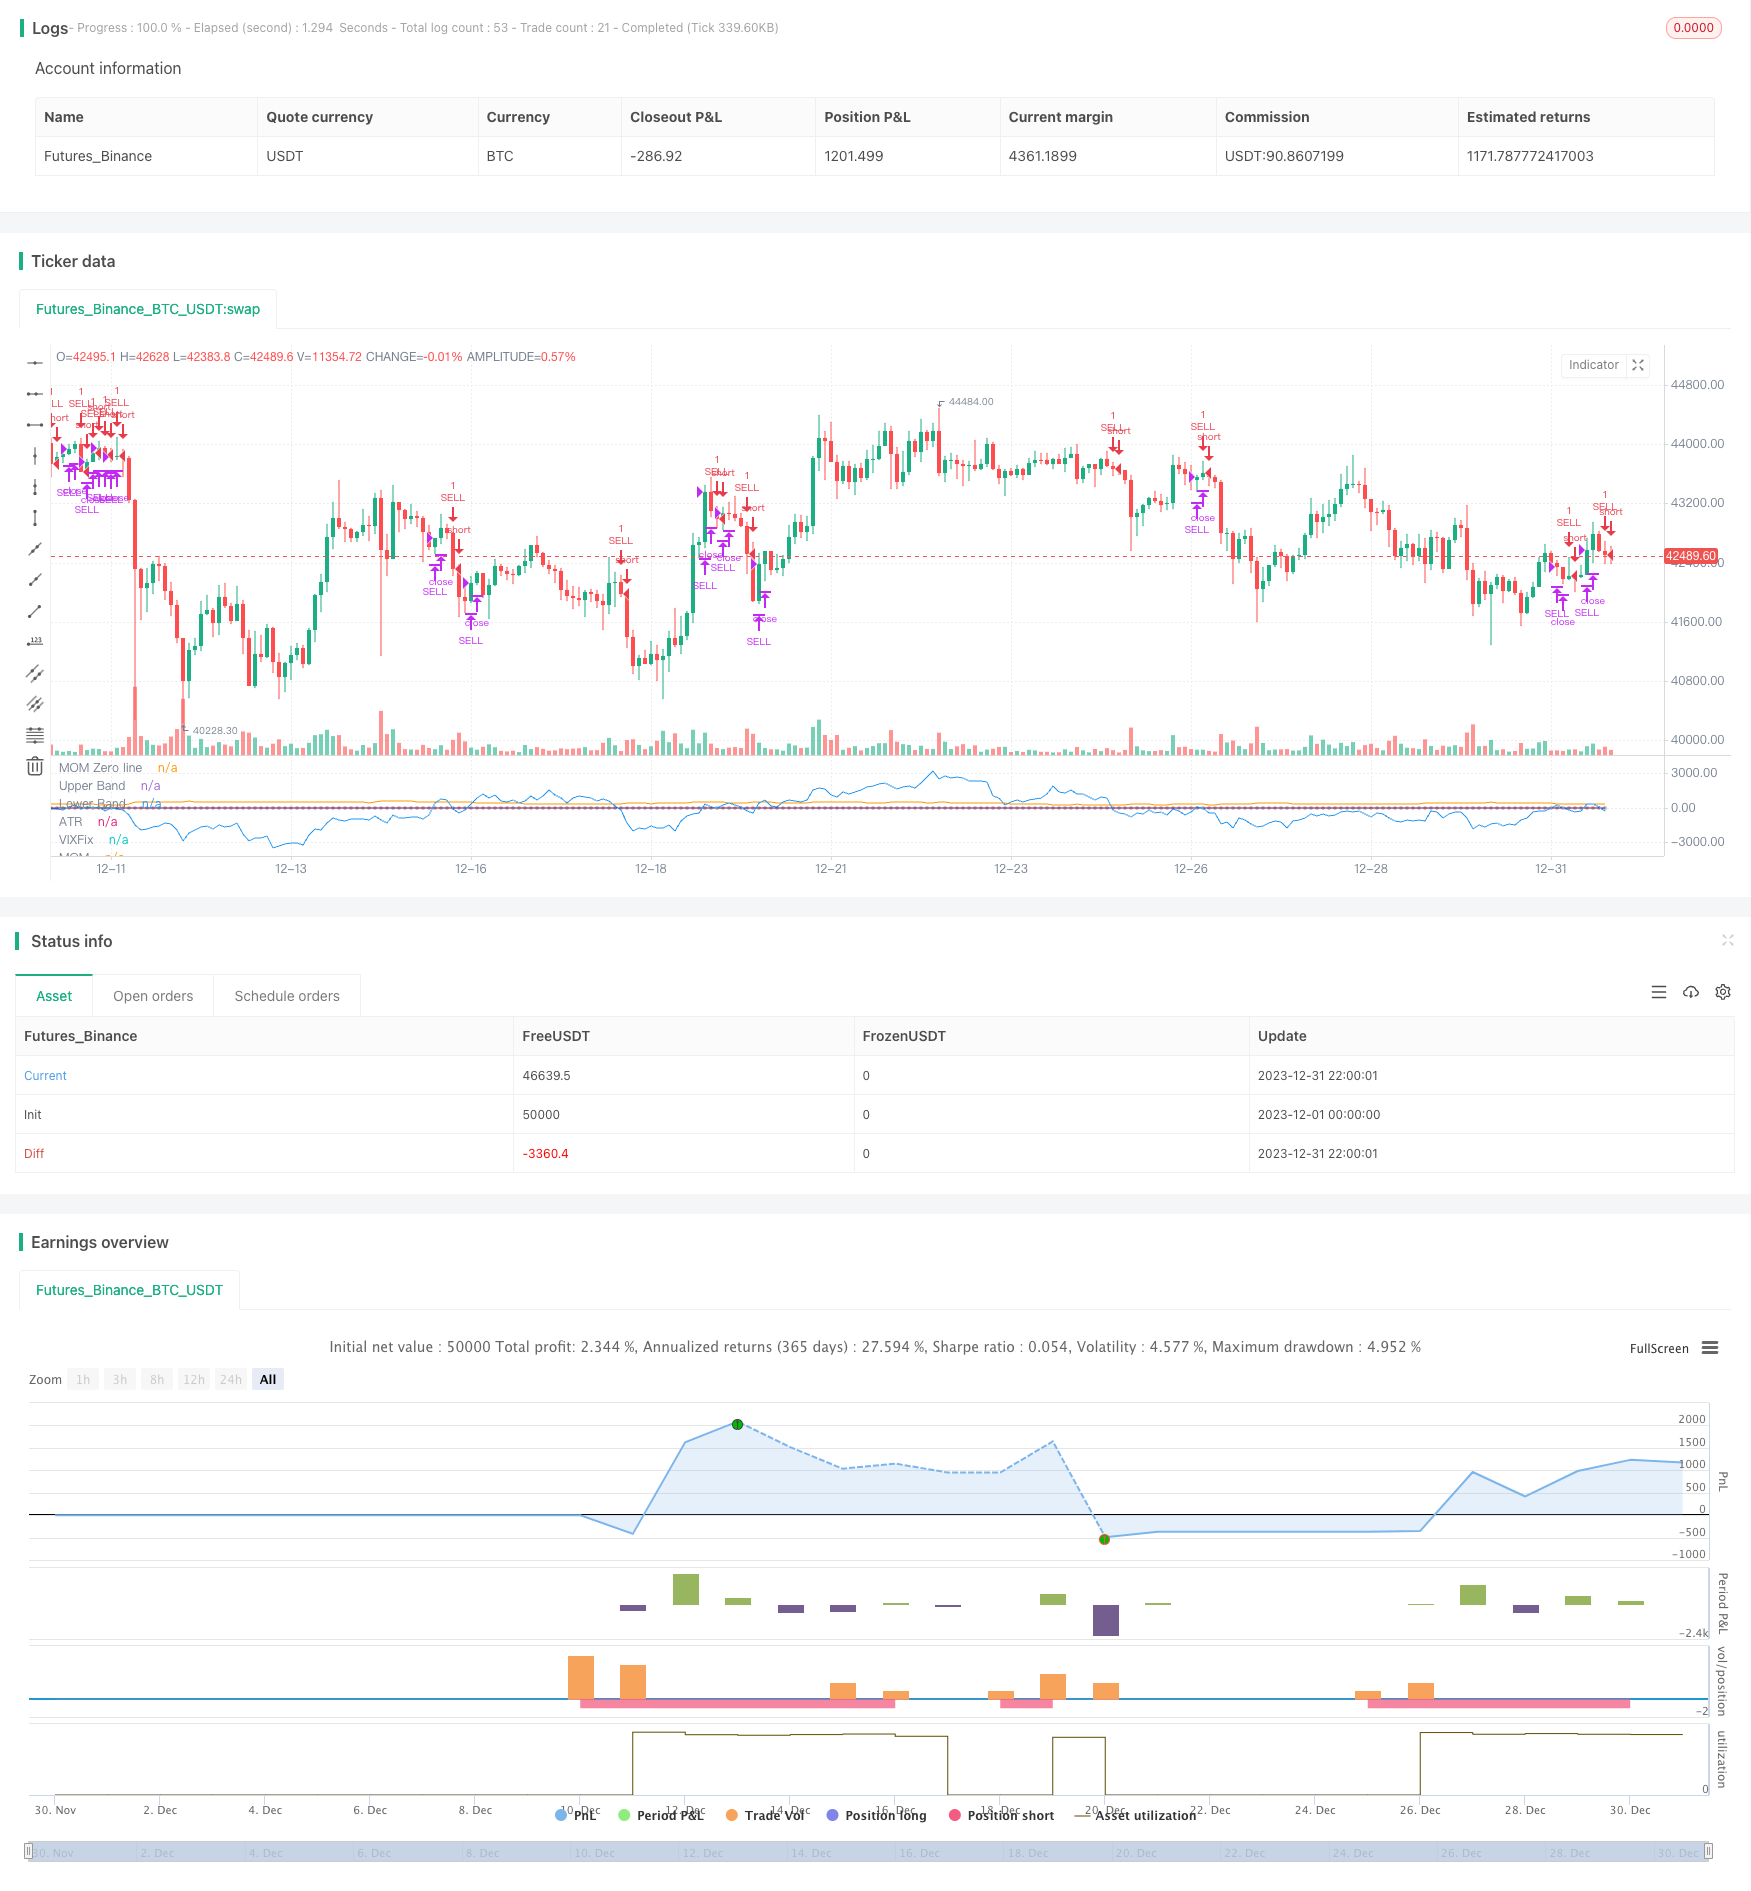
/*backtest
start: 2023-12-01 00:00:00
end: 2023-12-31 23:59:59
period: 2h
basePeriod: 15m
exchanges: [{"eid":"Futures_Binance","currency":"BTC_USDT"}]
*/

// This source code is subject to the terms of the Mozilla Public License 2.0 at https://mozilla.org/MPL/2.0/
// © gary_trades

//THIS SCRIPT HAS BEEN BUIL TO BE USED AS A S&P500 SPY CRASH INDICATOR (should not be used as a strategy).
//THIS SCRIPT HAS BEEN BUILT AS A STRATEGY FOR VISUALIZATION PURPOSES ONLY AND HAS NOT BEEN OPTIMISED FOR PROFIT.
//The script has been built to show as a lower indicator and also gives visual SELL signal on top when conditions are met. BARE IN MIND NO STOP LOSS, NOR ADVANCED EXIT STRATEGY HAS BEEN BUILT.
//As well as the chart SELL signal an alert has also been built into this script.
//The script utilizes a VIX indicator (marron line) and 50 period Momentum (blue line) and Danger/No trade zone(pink shading).
//When the Momentum line crosses down across the VIX this is a sell off but in order to only signal major sell offs the SELL signal only triggers if the momentum continues down through the danger zone.
//To use this indicator to identify ideal buying then you should only buy when Momentum line is crossed above the VIX and the Momentum line is above the Danger Zone.
//This is best used as a daily time frame indicator

//@version=4
strategy(title="S&P Bear Warning", shorttitle="Bear Warning" )

//Momentum
len = input(50, minval=1, title="Length")
src = input(close, title="Source")
bandUpper = input( 5)
bandLower = input(-5)
// ————— Control plotting of each signal. You could use the same technique to be able to turn acc/dist on/off.
showVixFix = input(true)
showMomentum = input(true)

mom = src - src[len]
myAtr = atr(14)
plot(showMomentum ? mom : na, color=color.blue, title="MOM")
plot(showMomentum ? 0 : na, color=color.silver, title="MOM Zero line", style=plot.style_circles, transp=100)
plot(showMomentum ? myAtr : na, color=color.orange, title="ATR", transp=90)

//VIX
VIXFixLength = input(22,title="VIX Fix Length")
VIXFix = (highest(close,VIXFixLength)-low)/(highest(close,VIXFixLength))*100
plot(showVixFix ? VIXFix : na, "VIXFix", color=color.maroon)

band1 = plot(showVixFix ? bandUpper : na, "Upper Band", color.red, 1, plot.style_line, transp=90)
band0 = plot(showVixFix ? bandLower : na, "Lower Band", color.red, 1, plot.style_line, transp=90)
fill(band1, band0, color=color.red, transp=85, title="Background")

//Identify Triggers
//Back Test Range
start = timestamp("America/New_York", 2000, 1, 1, 9,30)
end   = timestamp("America/New_York", 2020, 7, 1, 0, 0)

//Momentum
Long1 = mom > bandUpper
Short1 = mom < bandLower

//VIX
Long2  = crossover(mom, VIXFix)
Short2 = crossunder(mom, VIXFix)

//Warning Alert
SellAlert = Short1
alertcondition(SellAlert, title="Sell SPY", message="Warning Selling off {{ticker}}, price= {{close}}")

//Entry and Exit
if true
    strategy.entry("SELL", false, when = Short1)

strategy.close("SELL", when = Long2)