دو طرفہ انکولی رینج فلٹرنگ مومینٹم ٹریکنگ کی حکمت عملی
تخلیق کی تاریخ:
2024-01-24 11:31:51
آخر میں ترمیم کریں:
2024-01-24 11:32:23
کاپی:
1
کلکس کی تعداد:
705
1
پر توجہ دیں
1750
پیروکار
جائزہ
یہ حکمت عملی ایک دو طرفہ انکولی رینج فلٹر ہے جس میں قیمتوں کے اتار چڑھاؤ کو ٹریک کیا جاتا ہے۔ اس میں انکولی رینج فلٹر کا استعمال کیا جاتا ہے اور قیمتوں کی سمت کا تعین کرنے کے لئے مقدار کے ساتھ مل کر کم خرید و فروخت کی اجازت دی جاتی ہے۔
حکمت عملی کا اصول
- قیمتوں میں اتار چڑھاو کو ٹریک کرنے کے لئے اپنی مرضی کے مطابق رینج فلٹر کا استعمال کریں۔ فلٹر کا سائز صارف کے مقرر کردہ رینج کی مدت ، تعداد اور پیمانے کے مطابق اپنی مرضی کے مطابق ایڈجسٹ کریں۔
- فلٹرز کو ٹائپ 1 اور ٹائپ 2 کی دو اقسام میں تقسیم کیا گیا ہے۔ ٹائپ 1 معیاری رینج ٹریکنگ ٹائپ ہے ، ٹائپ 2 سیڑھی کے بارے میں مکمل ٹائپ ہے۔
- فلٹر اور اختتامی قیمت کے سائز کے تعلقات کے مطابق قیمت کے اتار چڑھاو کی سمت کا تعین کریں۔ قیمت اوپر کی ریل پر اچھال ہے ، نیچے کی ریل نیچے ہے۔
- قیمت کی سمت کا تعین کرنے کے لئے ، اختتامی قیمت کے پچھلے دن کے مقابلے میں گرنے اور گرنے کے تعلقات کو جوڑیں۔ قیمت میں اضافے کے ساتھ ، قیمت میں اضافے کے ساتھ ، قیمت میں کمی کے ساتھ۔
- جب قیمت ٹریک سے ٹکرا جاتی ہے اور قیمت بڑھ جاتی ہے تو خریدنے کا اشارہ ہوتا ہے۔ جب قیمت ٹریک سے ٹکرا جاتی ہے اور قیمت کم ہوتی ہے تو بیچنے کا اشارہ ہوتا ہے۔
طاقت کا تجزیہ
- انکولی رینج فلٹر مارکیٹ کے اتار چڑھاو کو درست طریقے سے پکڑ سکتا ہے۔
- دونوں قسم کے فلٹر مختلف تجارتی ترجیحات کو پورا کرسکتے ہیں۔
- مجموعی توانائی کے اشارے قدر کی سمت کو مؤثر طریقے سے پہچان سکتے ہیں۔
- حکمت عملی لچکدار ہے اور مارکیٹ کے مطابق پیرامیٹرز کو ایڈجسٹ کیا جا سکتا ہے.
- اپنی مرضی کے مطابق کریں مناسب ٹرانزیکشن کی شرائط کی منطق کو منتخب کریں
خطرے کا تجزیہ
- پیرامیٹرز کی غلط ترتیب سے زیادہ تجارت یا ضائع ہونے کا سبب بن سکتا ہے۔
- اس کے علاوہ ، یہ بھی کہا گیا ہے کہ اس کی وجہ یہ ہے کہ اس کی وجہ سے اس کی وجہ سے اس کی وجہ سے ہے.
- توانائی کی پیمائش کے اشارے میں کچھ کارٹن کا خطرہ ہے۔
- رینج توڑنے کے لئے آسان ہے.
خطرے سے بچاؤ:
- مناسب پیرامیٹرز کا مجموعہ منتخب کریں اور مناسب طریقے سے ایڈجسٹ کریں.
- دیگر اشارے کے ساتھ مل کر رجحانات کی نشاندہی کریں۔
- اہم نقطہ کے قریب اور رجحان کی تبدیلی کے دوران محتاط تجارت کریں۔
اصلاح کی سمت
- مختلف رینج سائز اور ہموار دورانیہ پیرامیٹرز کے مجموعے کو جانچیں اور بہترین مجموعہ تلاش کریں۔
- فلٹر کی مختلف اقسام کو آزمائیں اور اپنی پسند کی قسم منتخب کریں۔
- دیگر مقداری صلاحیت کے اشارے یا معاون تکنیکی اشارے کی جانچ پڑتال کریں.
- غیر منطقی تجارت کو کم کرنے کے لئے ٹرانزیکشن شرائط کے منطق کو بہتر اور ایڈجسٹ کریں۔
- مارکیٹ ٹائپنگ تھیوری کے ساتھ مل کر ایڈجسٹمنٹ شیڈولنگ تناسب طے کریں۔
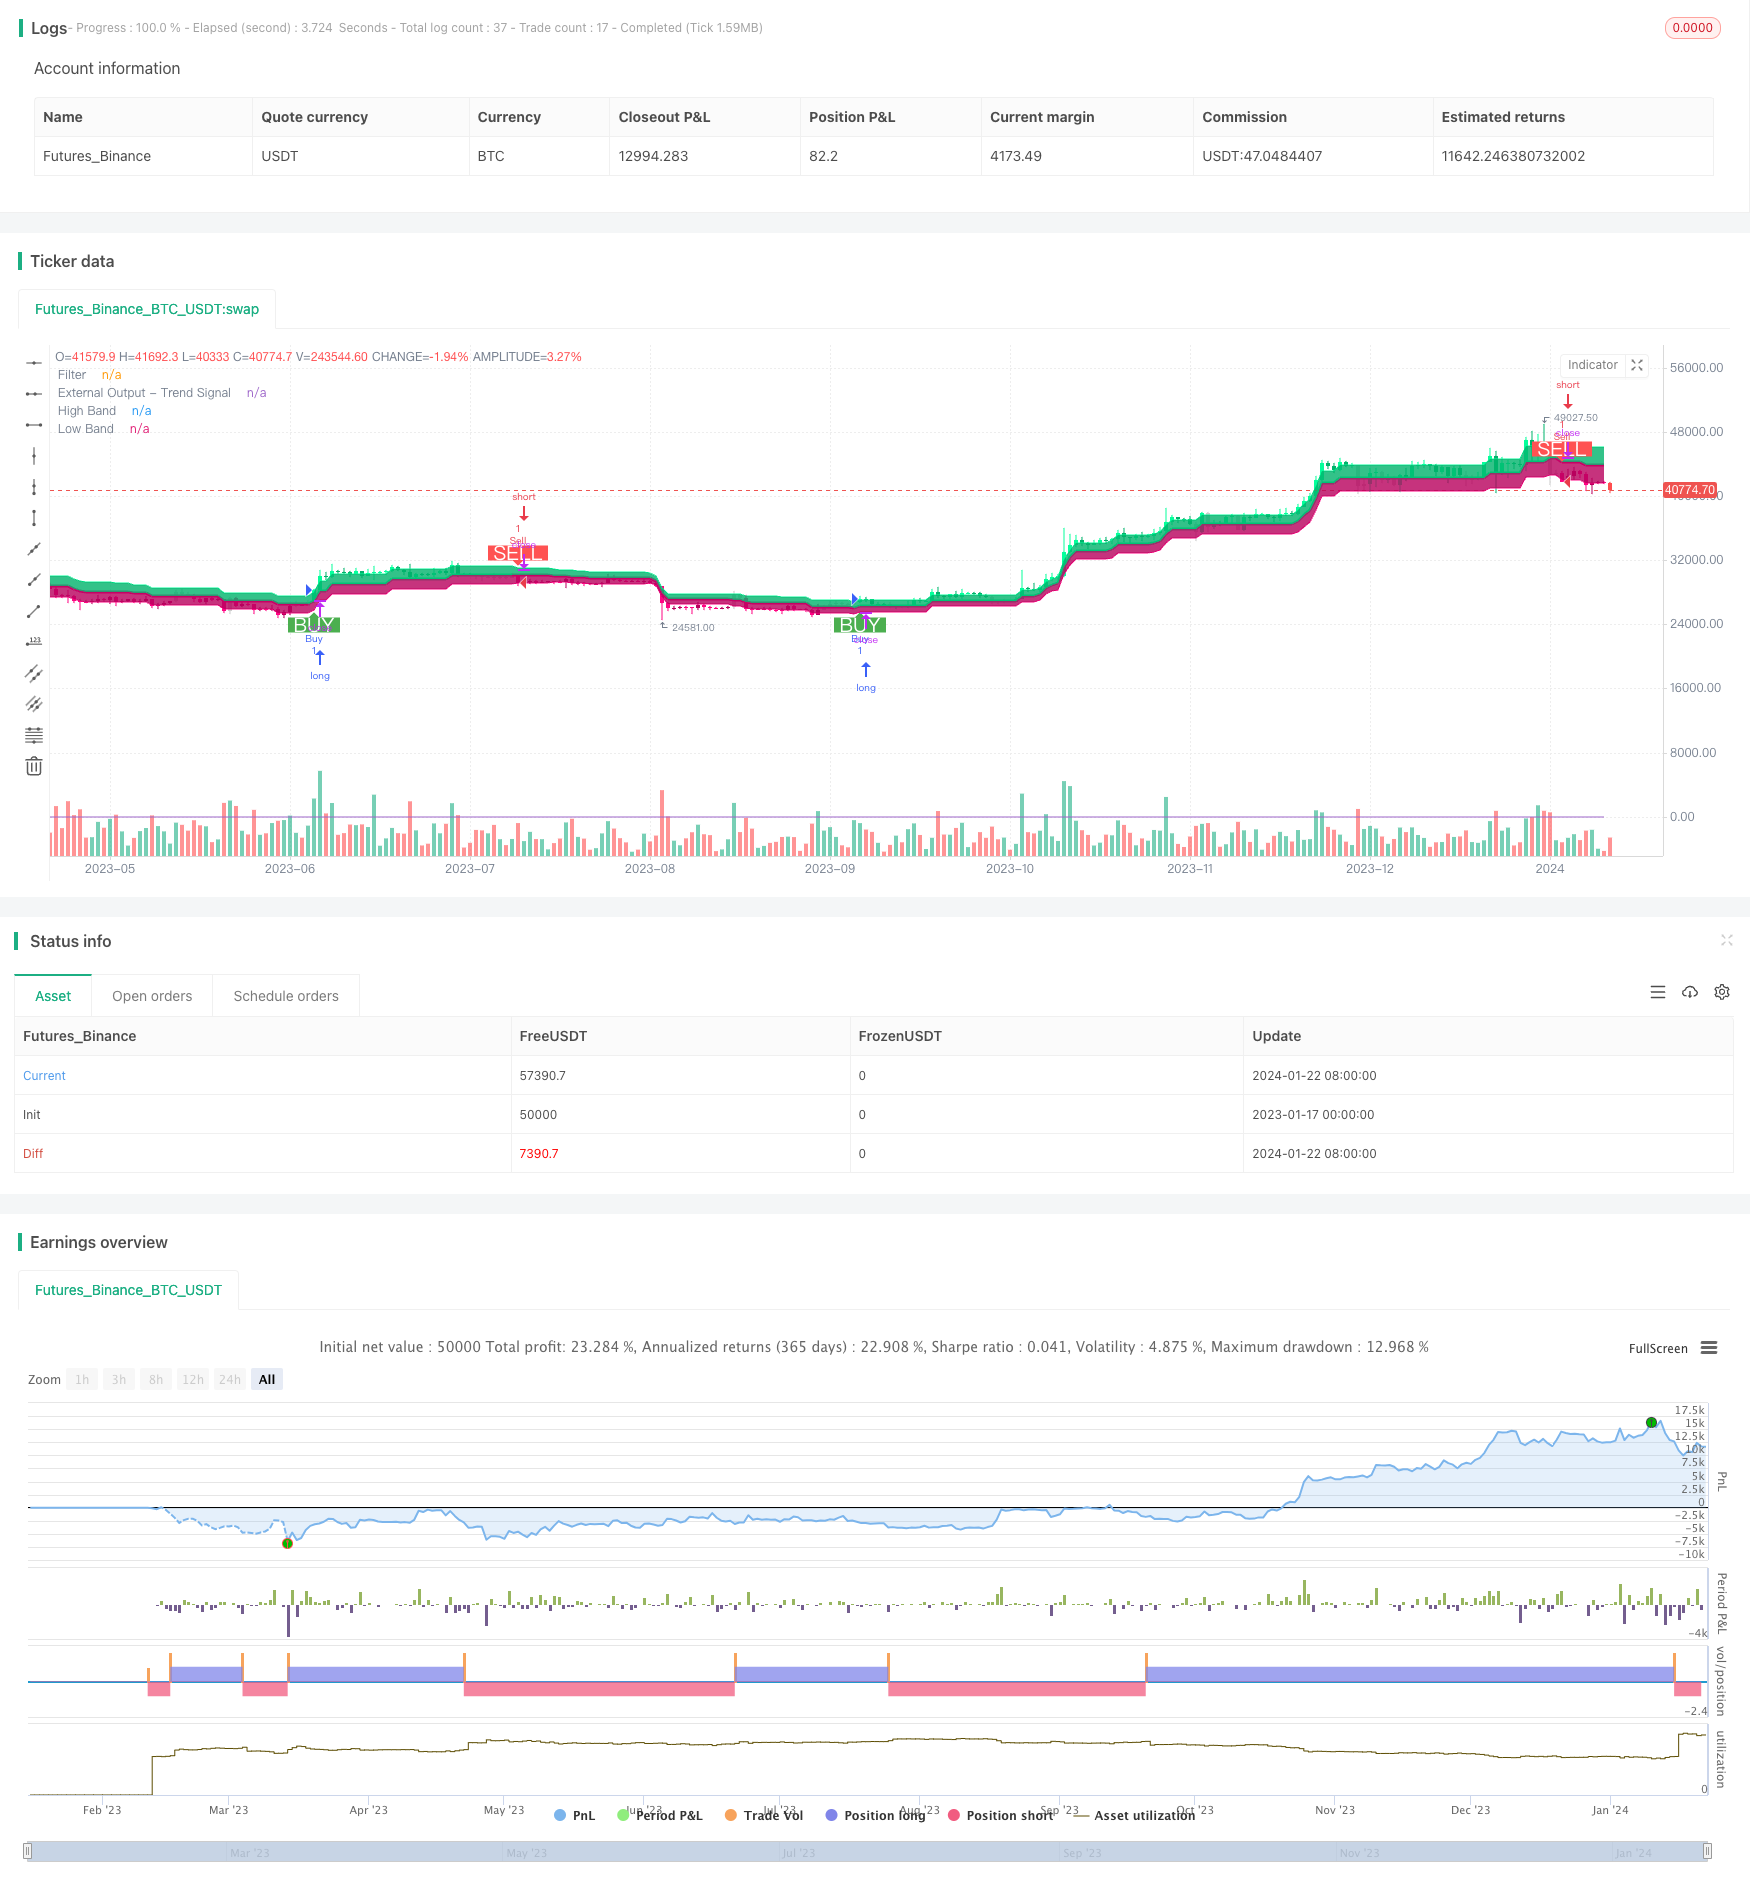
حکمت عملی کا ماخذ کوڈ
/*backtest
start: 2023-01-17 00:00:00
end: 2024-01-23 00:00:00
period: 1d
basePeriod: 1h
exchanges: [{"eid":"Futures_Binance","currency":"BTC_USDT"}]
*/

//@version=4
strategy("Range Filter [DW] & Labels", shorttitle="RF [DW] & Labels", overlay=true)


//Conditional Sampling EMA Function
Cond_EMA(x, cond, n)=>
    var val     = array.new_float(0)
    var ema_val = array.new_float(1)
    if cond
        array.push(val, x)
        if array.size(val) > 1
            array.remove(val, 0)
        if na(array.get(ema_val, 0))
            array.fill(ema_val, array.get(val, 0))
        array.set(ema_val, 0, (array.get(val, 0) - array.get(ema_val, 0))*(2/(n + 1)) + array.get(ema_val, 0))
    EMA = array.get(ema_val, 0)
    EMA

//Conditional Sampling SMA Function
Cond_SMA(x, cond, n)=>
    var vals = array.new_float(0)
    if cond
        array.push(vals, x)
        if array.size(vals) > n
            array.remove(vals, 0)
    SMA = array.avg(vals)
    SMA

//Standard Deviation Function
Stdev(x, n)=>
    sqrt(Cond_SMA(pow(x, 2), 1, n) - pow(Cond_SMA(x, 1, n), 2))

//Range Size Function
rng_size(x, scale, qty, n)=>
    ATR      = Cond_EMA(tr(true), 1, n)
    AC       = Cond_EMA(abs(x - x[1]), 1, n)
    SD       = Stdev(x, n)
    rng_size = scale=="Pips" ? qty*0.0001 : scale=="Points" ? qty*syminfo.pointvalue : scale=="% of Price" ? close*qty/100 : scale=="ATR" ? qty*ATR :
               scale=="Average Change" ? qty*AC : scale=="Standard Deviation" ? qty*SD : scale=="Ticks" ? qty*syminfo.mintick : qty

//Two Type Range Filter Function
rng_filt(h, l, rng_, n, type, smooth, sn, av_rf, av_n)=>
    rng_smooth = Cond_EMA(rng_, 1, sn)
    r          = smooth ? rng_smooth : rng_
    var rfilt  = array.new_float(2, (h + l)/2)
    array.set(rfilt, 1, array.get(rfilt, 0))
    if type=="Type 1"
        if h - r > array.get(rfilt, 1)
            array.set(rfilt, 0, h - r)
        if l + r < array.get(rfilt, 1)
            array.set(rfilt, 0, l + r)
    if type=="Type 2"
        if h >= array.get(rfilt, 1) + r
            array.set(rfilt, 0, array.get(rfilt, 1) + floor(abs(h - array.get(rfilt, 1))/r)*r)
        if l <= array.get(rfilt, 1) - r
            array.set(rfilt, 0, array.get(rfilt, 1) - floor(abs(l - array.get(rfilt, 1))/r)*r)
    rng_filt1 = array.get(rfilt, 0)
    hi_band1  = rng_filt1 + r
    lo_band1  = rng_filt1 - r
    rng_filt2 = Cond_EMA(rng_filt1, rng_filt1 != rng_filt1[1], av_n)
    hi_band2  = Cond_EMA(hi_band1, rng_filt1 != rng_filt1[1], av_n)
    lo_band2  = Cond_EMA(lo_band1, rng_filt1 != rng_filt1[1], av_n)
    rng_filt  = av_rf ? rng_filt2 : rng_filt1
    hi_band   = av_rf ? hi_band2 : hi_band1
    lo_band   = av_rf ? lo_band2 : lo_band1
    [hi_band, lo_band, rng_filt]

//-----------------------------------------------------------------------------------------------------------------------------------------------------------------
//Inputs
//-----------------------------------------------------------------------------------------------------------------------------------------------------------------

//Filter Type
f_type = input(defval="Type 1", options=["Type 1", "Type 2"], title="Filter Type")

//Movement Source
mov_src = input(defval="Close", options=["Wicks", "Close"], title="Movement Source")

//Range Size Inputs
rng_qty   = input(defval=2.618, minval=0.0000001, title="Range Size")
rng_scale = input(defval="Average Change", options=["Points", "Pips", "Ticks", "% of Price", "ATR", "Average Change", "Standard Deviation", "Absolute"], title="Range Scale")

//Range Period
rng_per = input(defval=14, minval=1, title="Range Period (for ATR, Average Change, and Standard Deviation)")

//Range Smoothing Inputs
smooth_range = input(defval=true, title="Smooth Range")
smooth_per   = input(defval=27, minval=1, title="Smoothing Period")

//Filter Value Averaging Inputs
av_vals    = input(defval=true, title="Average Filter Changes")
av_samples = input(defval=2, minval=1, title="Number Of Changes To Average")

//-----------------------------------------------------------------------------------------------------------------------------------------------------------------
//Definitions
//-----------------------------------------------------------------------------------------------------------------------------------------------------------------

//High And Low Values
h_val = mov_src=="Wicks" ? high : close
l_val = mov_src=="Wicks" ? low : close

//Range Filter Values
[h_band, l_band, filt] = rng_filt(h_val, l_val, rng_size((h_val + l_val)/2, rng_scale, rng_qty, rng_per), rng_per, f_type, smooth_range, smooth_per, av_vals, av_samples)

//Direction Conditions
var fdir = 0.0
fdir    := filt > filt[1] ? 1 : filt < filt[1] ? -1 : fdir
upward   = fdir==1 ? 1 : 0
downward = fdir==-1 ? 1 : 0

//Colors
filt_color = upward ? #05ff9b : downward ? #ff0583 : #cccccc
bar_color  = upward and (close > filt) ? (close > close[1] ? #05ff9b : #00b36b) :
             downward and (close < filt) ? (close < close[1] ? #ff0583 : #b8005d) : #cccccc

//-----------------------------------------------------------------------------------------------------------------------------------------------------------------
//Outputs
//-----------------------------------------------------------------------------------------------------------------------------------------------------------------

//Filter Plot
filt_plot = plot(filt, color=filt_color, transp=0, linewidth=3,  title="Filter")

//Band Plots
h_band_plot = plot(h_band, color=#05ff9b, transp=100, title="High Band")
l_band_plot = plot(l_band, color=#ff0583, transp=100, title="Low Band")

//Band Fills
fill(h_band_plot, filt_plot, color=#00b36b, transp=85, title="High Band Fill")
fill(l_band_plot, filt_plot, color=#b8005d, transp=85, title="Low Band Fill")

//Bar Color
barcolor(bar_color)

//External Trend Output
plot(fdir, transp=100, editable=false, display=display.none, title="External Output - Trend Signal")

// Trading Conditions Logic
longCond = close > filt and close > close[1] and upward > 0 or close > filt and close < close[1] and upward > 0
shortCond = close < filt and close < close[1] and downward > 0 or close < filt and close > close[1] and downward > 0

CondIni = 0
CondIni := longCond ? 1 : shortCond ? -1 : CondIni[1]
longCondition = longCond and CondIni[1] == -1
shortCondition = shortCond and CondIni[1] == 1

// Strategy Entry and Exit
strategy.entry("Buy", strategy.long, when = longCondition)
strategy.entry("Sell", strategy.short, when = shortCondition)

strategy.close("Buy", when = shortCondition)
strategy.close("Sell", when = longCondition)

// Plot Buy and Sell Labels
plotshape(longCondition, title = "Buy Signal", text ="BUY", textcolor = color.white, style=shape.labelup, size = size.normal, location=location.belowbar, color = color.green, transp = 0)
plotshape(shortCondition, title = "Sell Signal", text ="SELL", textcolor = color.white, style=shape.labeldown, size = size.normal, location=location.abovebar, color = color.red, transp = 0)

// Alerts
alertcondition(longCondition, title="Buy Alert", message = "BUY")
alertcondition(shortCondition, title="Sell Alert", message = "SELL")