سپورٹ اور ریزسٹنس سوئنگ ٹریڈنگ کی حکمت عملی
تخلیق کی تاریخ:
2024-01-25 15:53:06
آخر میں ترمیم کریں:
2024-01-25 15:53:06
کاپی:
2
کلکس کی تعداد:
603
1
پر توجہ دیں
1750
پیروکار
جائزہ
یہ حکمت عملی آر ایس آئی ، بے ترتیب اشارے کی کراس حکمت عملی کے ساتھ مل کر ، لیول پوائنٹ کو بہتر بنانے کی حکمت عملی کے ساتھ مل کر ، ٹریڈنگ منطق کے عین مطابق کنٹرول اور اسٹاپ نقصان کو درست طریقے سے روکنے کا احساس کرتی ہے۔ اس کے علاوہ ، سگنل کی اصلاح کو متعارف کرانے کے ذریعے ، رجحانات پر بہتر قابو پانا اور فنڈز کے مناسب انتظام کا احساس کرنا ممکن ہے۔
حکمت عملی کا اصول
- آر ایس آئی اشارے نے اوورلوڈ اوورلوڈ زون کا فیصلہ کیا ، جس میں بے ترتیب اشارے کے K اور D کی قیمتوں کے ساتھ گولڈ فورک ڈیڈ فورک ٹریڈنگ سگنل تیار کیا گیا تھا۔
- K لائنوں کے لئے ٹائپنگ کی شناخت متعارف کرایا، رجحان سگنل کا فیصلہ کرنے میں مدد، اور غلط تجارت سے بچنے کے لئے.
- ایس ایم اے اوسط لائن رجحان کی سمت کا تعین کرنے میں معاون ہے۔ جب قلیل مدتی اوسط لائن نیچے سے اوپر کی طرف سے طویل مدتی اوسط لائن کو توڑ دیتی ہے تو یہ اچھال کا اشارہ ہے۔
- فلیٹ پوزیشن سلائڈ پوائنٹ کی حکمت عملی ، جس میں کم سے کم قیمت کے اتار چڑھاو کی حد کے مطابق اسٹاپ نقصان کی قیمت طے کی جاتی ہے۔
طاقت کا تجزیہ
- RSI اشارے کے پیرامیٹرز کو بہتر بنایا گیا ہے تاکہ اوورلوڈ اور اوورلوڈ علاقوں کا اندازہ لگایا جاسکے اور غلط تجارت سے بچا جاسکے
- STO اشارے پیرامیٹرز کو بہتر بنانے ، ہموار پیرامیٹرز کو ایڈجسٹ کرنے ، شور کو ختم کرنے اور سگنل کے معیار کو بہتر بنانے کے لئے
- Heikin-Ashi تکنیکی تجزیہ کو متعارف کرانے کے لئے، ٹریڈنگ سگنل کی درستگی کو یقینی بنانے کے لئے K لائن اداروں کی سمت میں تبدیلی کی شناخت
- SMA اوسط لائن بڑے رجحانات کی سمت کا تعین کرنے میں معاون ہے ، اس کے برعکس تجارت سے بچنے کے لئے
- اسٹاپ اسٹاپ لوس سلائڈ پوائنٹ حکمت عملی کے ساتھ مل کر ، ہر تجارت پر منافع کو زیادہ سے زیادہ لاک کریں۔
خطرے کا تجزیہ
- بڑے بازاروں میں مسلسل کمی کے ساتھ ، فنڈز کو زیادہ خطرہ لاحق ہے
- ٹرانزیکشن فریکوئنسی زیادہ ہوسکتی ہے ، جس سے ٹرانزیکشن لاگت اور سلائڈ پوائنٹ لاگت میں اضافہ ہوتا ہے۔
- RSI اشارے جھوٹے سگنل بنانے کے لئے آسان ہے ، دوسرے اشارے کے ساتھ مل کر فلٹر کیا جانا چاہئے
حکمت عملی کی اصلاح
- RSI پیرامیٹرز کو ایڈجسٹ کریں تاکہ اوورلوڈ اور اوورلوڈ فیصلے کو بہتر بنایا جاسکے
- STO اشارے پیرامیٹرز ، ہموار اور سائیکل کو ایڈجسٹ کریں ، سگنل کے معیار کو بہتر بنائیں
- حرکت پذیری اوسط سائیکل کو ایڈجسٹ کریں اور رجحانات کو بہتر بنائیں
- مزید تکنیکی اشارے متعارف کرانے اور سگنل کی درستگی کو بہتر بنانا
- اسٹاپ نقصان کی روک تھام کے تناسب کو بہتر بنانا ، ایک ہی تجارت کے خطرے کو کم کرنا
خلاصہ کریں۔
اس حکمت عملی میں متعدد مرکزی دھارے میں آنے والے تکنیکی اشارے کے فوائد کو مربوط کیا گیا ہے ، جس میں پیرامیٹرز کی اصلاح اور قواعد کی بہتری کے ذریعہ ، تجارتی سگنل کے معیار اور اسٹاپ اسٹاپ نقصان کے توازن کو حاصل کیا گیا ہے۔ اس میں کچھ عالمگیریت اور مستحکم منافع بخش صلاحیت ہے۔ مسلسل اصلاح کے ذریعہ ، جیت اور منافع کی شرح کو مزید بہتر بنایا جاسکتا ہے۔
حکمت عملی کا ماخذ کوڈ
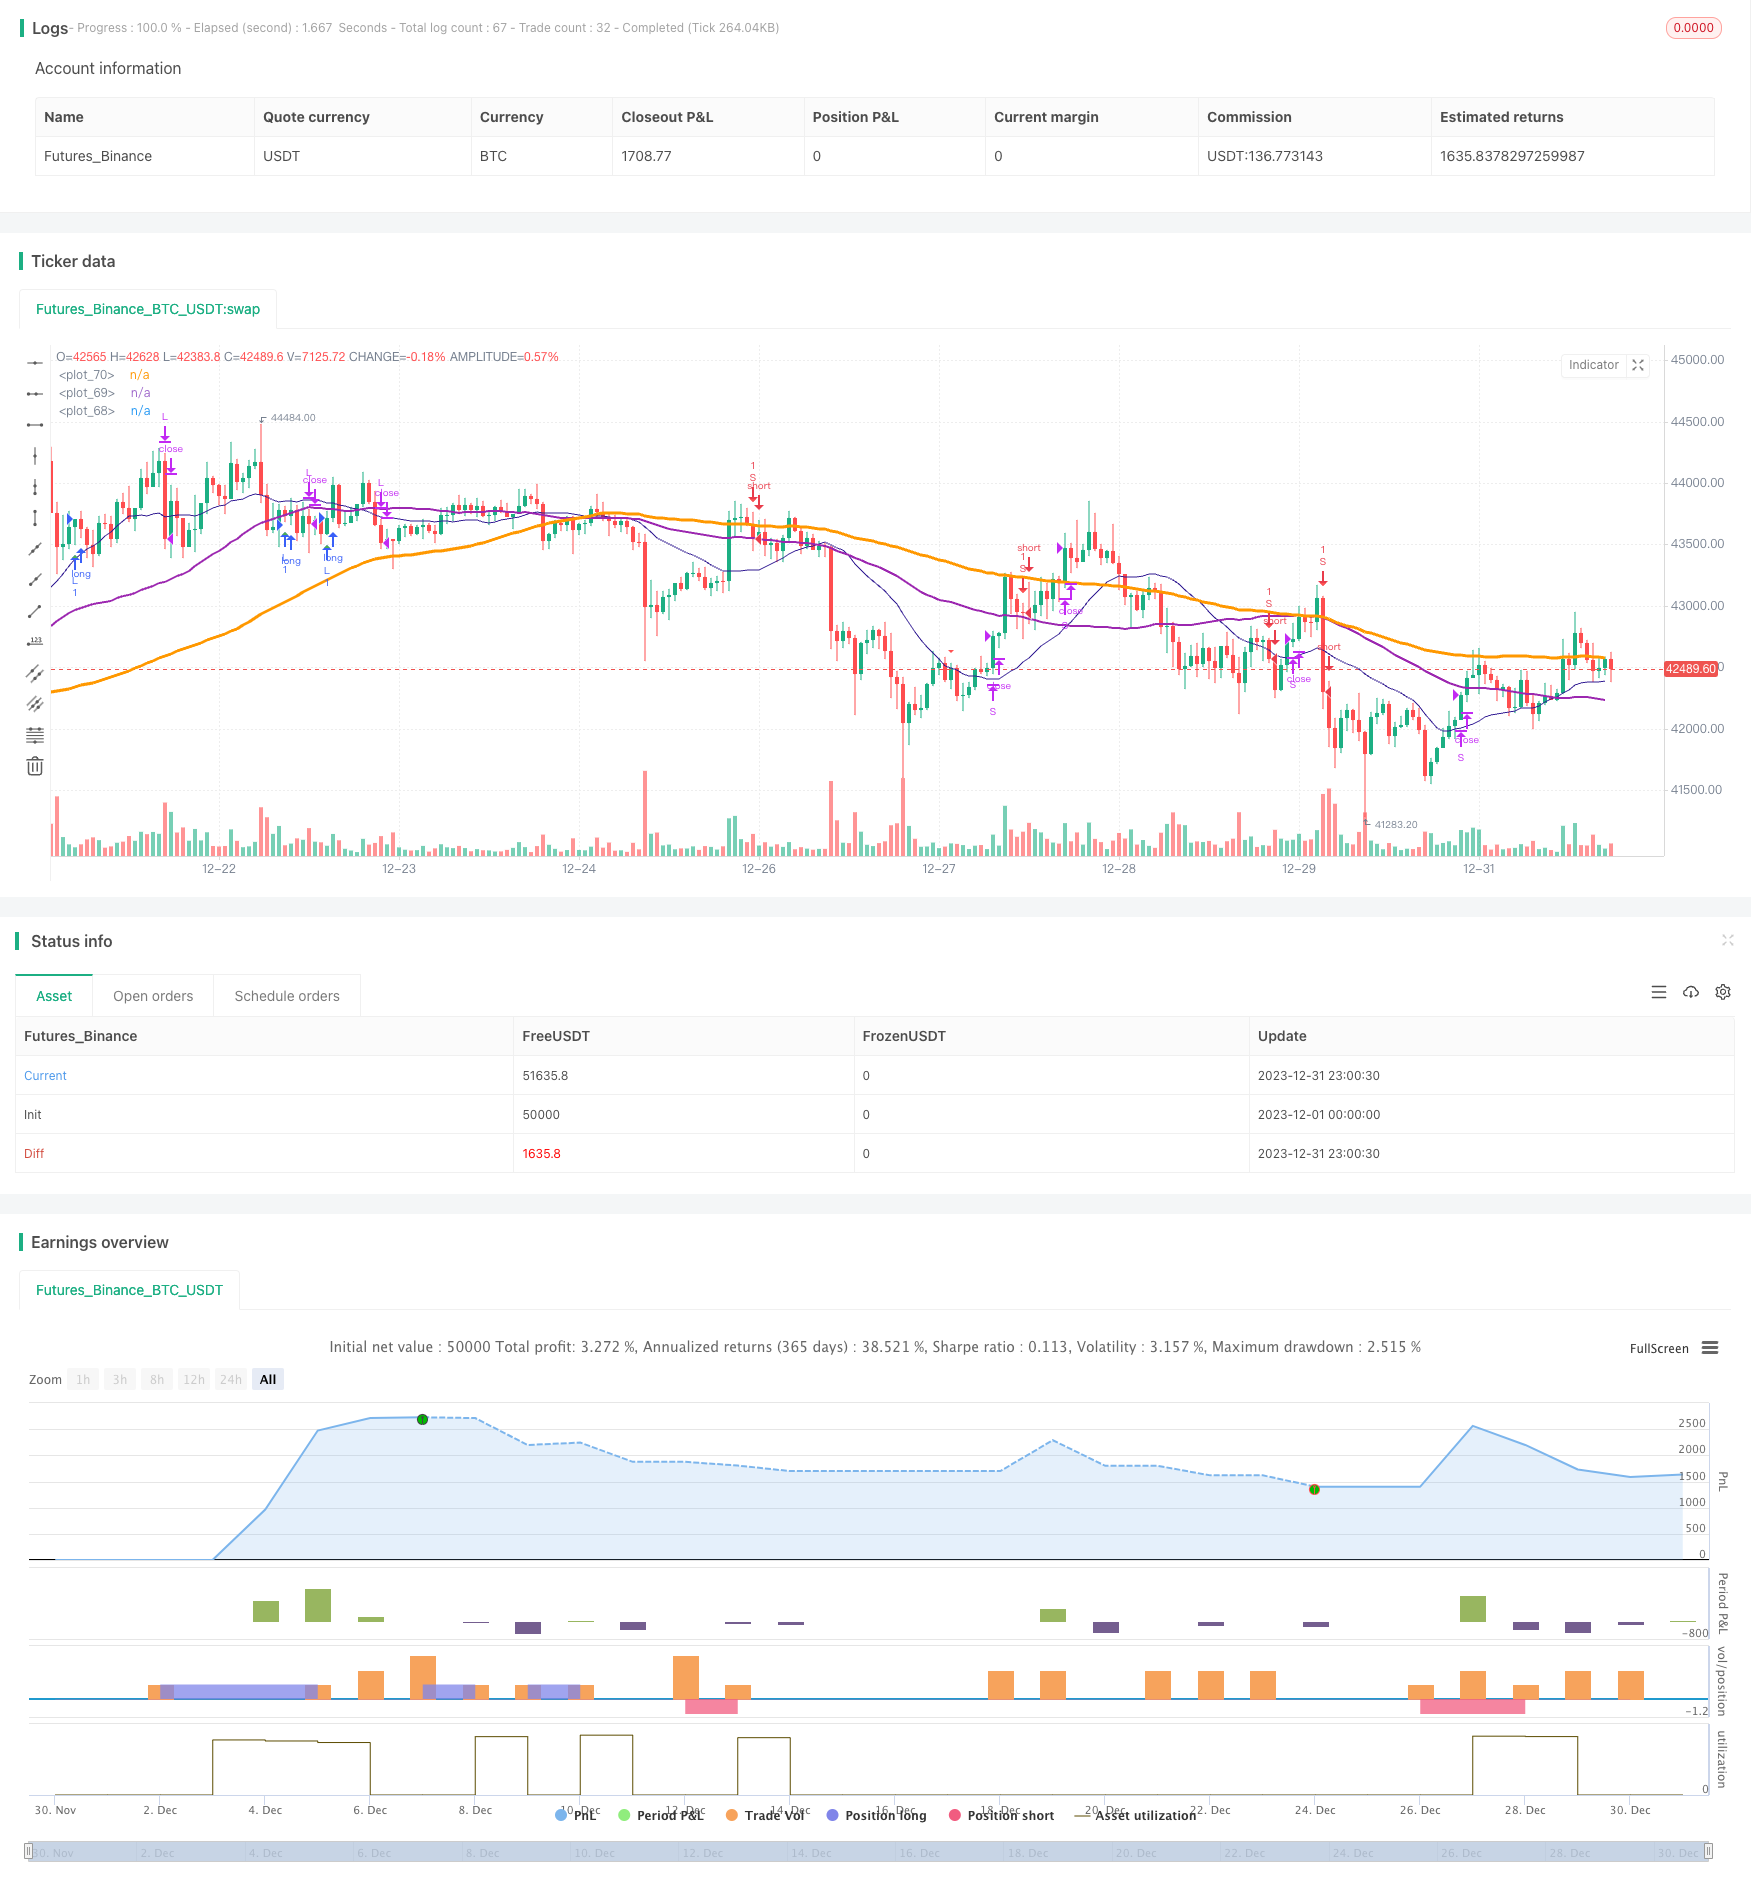
/*backtest
start: 2023-12-01 00:00:00
end: 2023-12-31 23:59:59
period: 1h
basePeriod: 15m
exchanges: [{"eid":"Futures_Binance","currency":"BTC_USDT"}]
*/

//@version=4
//study(title="@sentenzal strategy", shorttitle="@sentenzal strategy", overlay=true)
strategy(title="@sentenzal strategy", shorttitle="@sentenzal strategy", overlay=true  )
smoothK = input(3, minval=1)
smoothD = input(3, minval=1)
lengthRSI = input(14, minval=1)
lengthStoch = input(14, minval=1)
overbought = input(80, minval=1)
oversold = input(20, minval=1)
smaLengh = input(100, minval=1)
smaLengh2 = input(50, minval=1)
smaLengh3 = input(20, minval=1)

src = input(close, title="RSI Source")
testStartYear = input(2017, "Backtest Start Year")
testStartMonth = input(1, "Backtest Start Month")
testStartDay = input(1, "Backtest Start Day")
testPeriodStart = timestamp(testStartYear,testStartMonth,testStartDay,0,0)
testPeriod() =>
    time >= testPeriodStart ? true : false

rsi1 = rsi(src, lengthRSI)
k = sma(stoch(rsi1, rsi1, rsi1, lengthStoch), smoothK)
d = sma(k, smoothD)
crossBuy = crossover(k, d) and k < oversold
crossSell = crossunder(k, d) and k > overbought

dcLower = lowest(low, 10)
dcUpper = highest(high, 10)


heikinashi_close = security(heikinashi(syminfo.tickerid), timeframe.period, close)
heikinashi_open = security(heikinashi(syminfo.tickerid), timeframe.period, open)
heikinashi_low = security(heikinashi(syminfo.tickerid), timeframe.period, low)
heikinashi_high = security(heikinashi(syminfo.tickerid), timeframe.period, high)
heikinashiPositive = heikinashi_close >= heikinashi_open

heikinashiBuy = heikinashiPositive == true and heikinashiPositive[1] == false  and heikinashiPositive[2] == false
heikinashiSell = heikinashiPositive == false and heikinashiPositive[1] == true and heikinashiPositive[2] == true

//plotshape(heikinashiBuy, style=shape.arrowup, color=green, location=location.belowbar, size=size.tiny)
//plotshape(heikinashiSell, style=shape.arrowdown, color=red, location=location.abovebar, size=size.tiny)

buy = (crossBuy == true or crossBuy[1] == true or crossBuy[2] == true) and (heikinashiBuy == true or heikinashiBuy[1] == true or heikinashiBuy[2] == true)
sell = (crossSell == true or crossSell[1] == true or crossSell[2] == true) and (heikinashiSell == true or heikinashiSell[1] == true or heikinashiSell[2] == true)

mult = timeframe.period == '15' ? 4 : 1
mult2 = timeframe.period == '240' ? 0.25 : mult

movingAverage = sma(close, round(smaLengh))
movingAverage2 = sma(close, round(smaLengh2))
movingAverage3 = sma(close, round(smaLengh3))

uptrend = movingAverage < movingAverage2 and movingAverage2 < movingAverage3 and close > movingAverage
downtrend = movingAverage > movingAverage2 and movingAverage2 > movingAverage3 and close < movingAverage

signalBuy = (buy[1] == false and buy[2] == false and buy == true) and uptrend
signalSell = (sell[1] == false and sell[2] == false and sell == true) and downtrend

takeProfitSell = (buy[1] == false and buy[2] == false and buy == true) and uptrend == false
takeProfitBuy = (sell[1] == false and sell[2] == false and sell == true)  and uptrend

plotshape(signalBuy, style=shape.triangleup, color=green, location=location.belowbar, size=size.tiny)
plotshape(signalSell, style=shape.triangledown, color=red, location=location.abovebar, size=size.tiny)


plot(movingAverage, linewidth=3, color=orange, transp=0)
plot(movingAverage2, linewidth=2, color=purple, transp=0)
plot(movingAverage3, linewidth=1, color=navy, transp=0)

alertcondition(signalBuy, title='Signal Buy', message='Signal Buy')
alertcondition(signalSell, title='Signal Sell', message='Signal Sell')


strategy.close("L", when=dcLower[1] > low)
strategy.close("S", when=dcUpper[1] < high)

strategy.entry("L", strategy.long, 1, when = signalBuy and testPeriod() and uptrend)
strategy.entry("S", strategy.short, 1, when = signalSell and testPeriod() and uptrend ==false)

//strategy.exit("Exit Long", from_entry = "L", loss = 25000000, profit=25000000)
//strategy.exit("Exit Short", from_entry = "S", loss = 25000000, profit=25000000)