گولڈن کراس ٹریڈنگ کی حکمت عملی
جائزہ
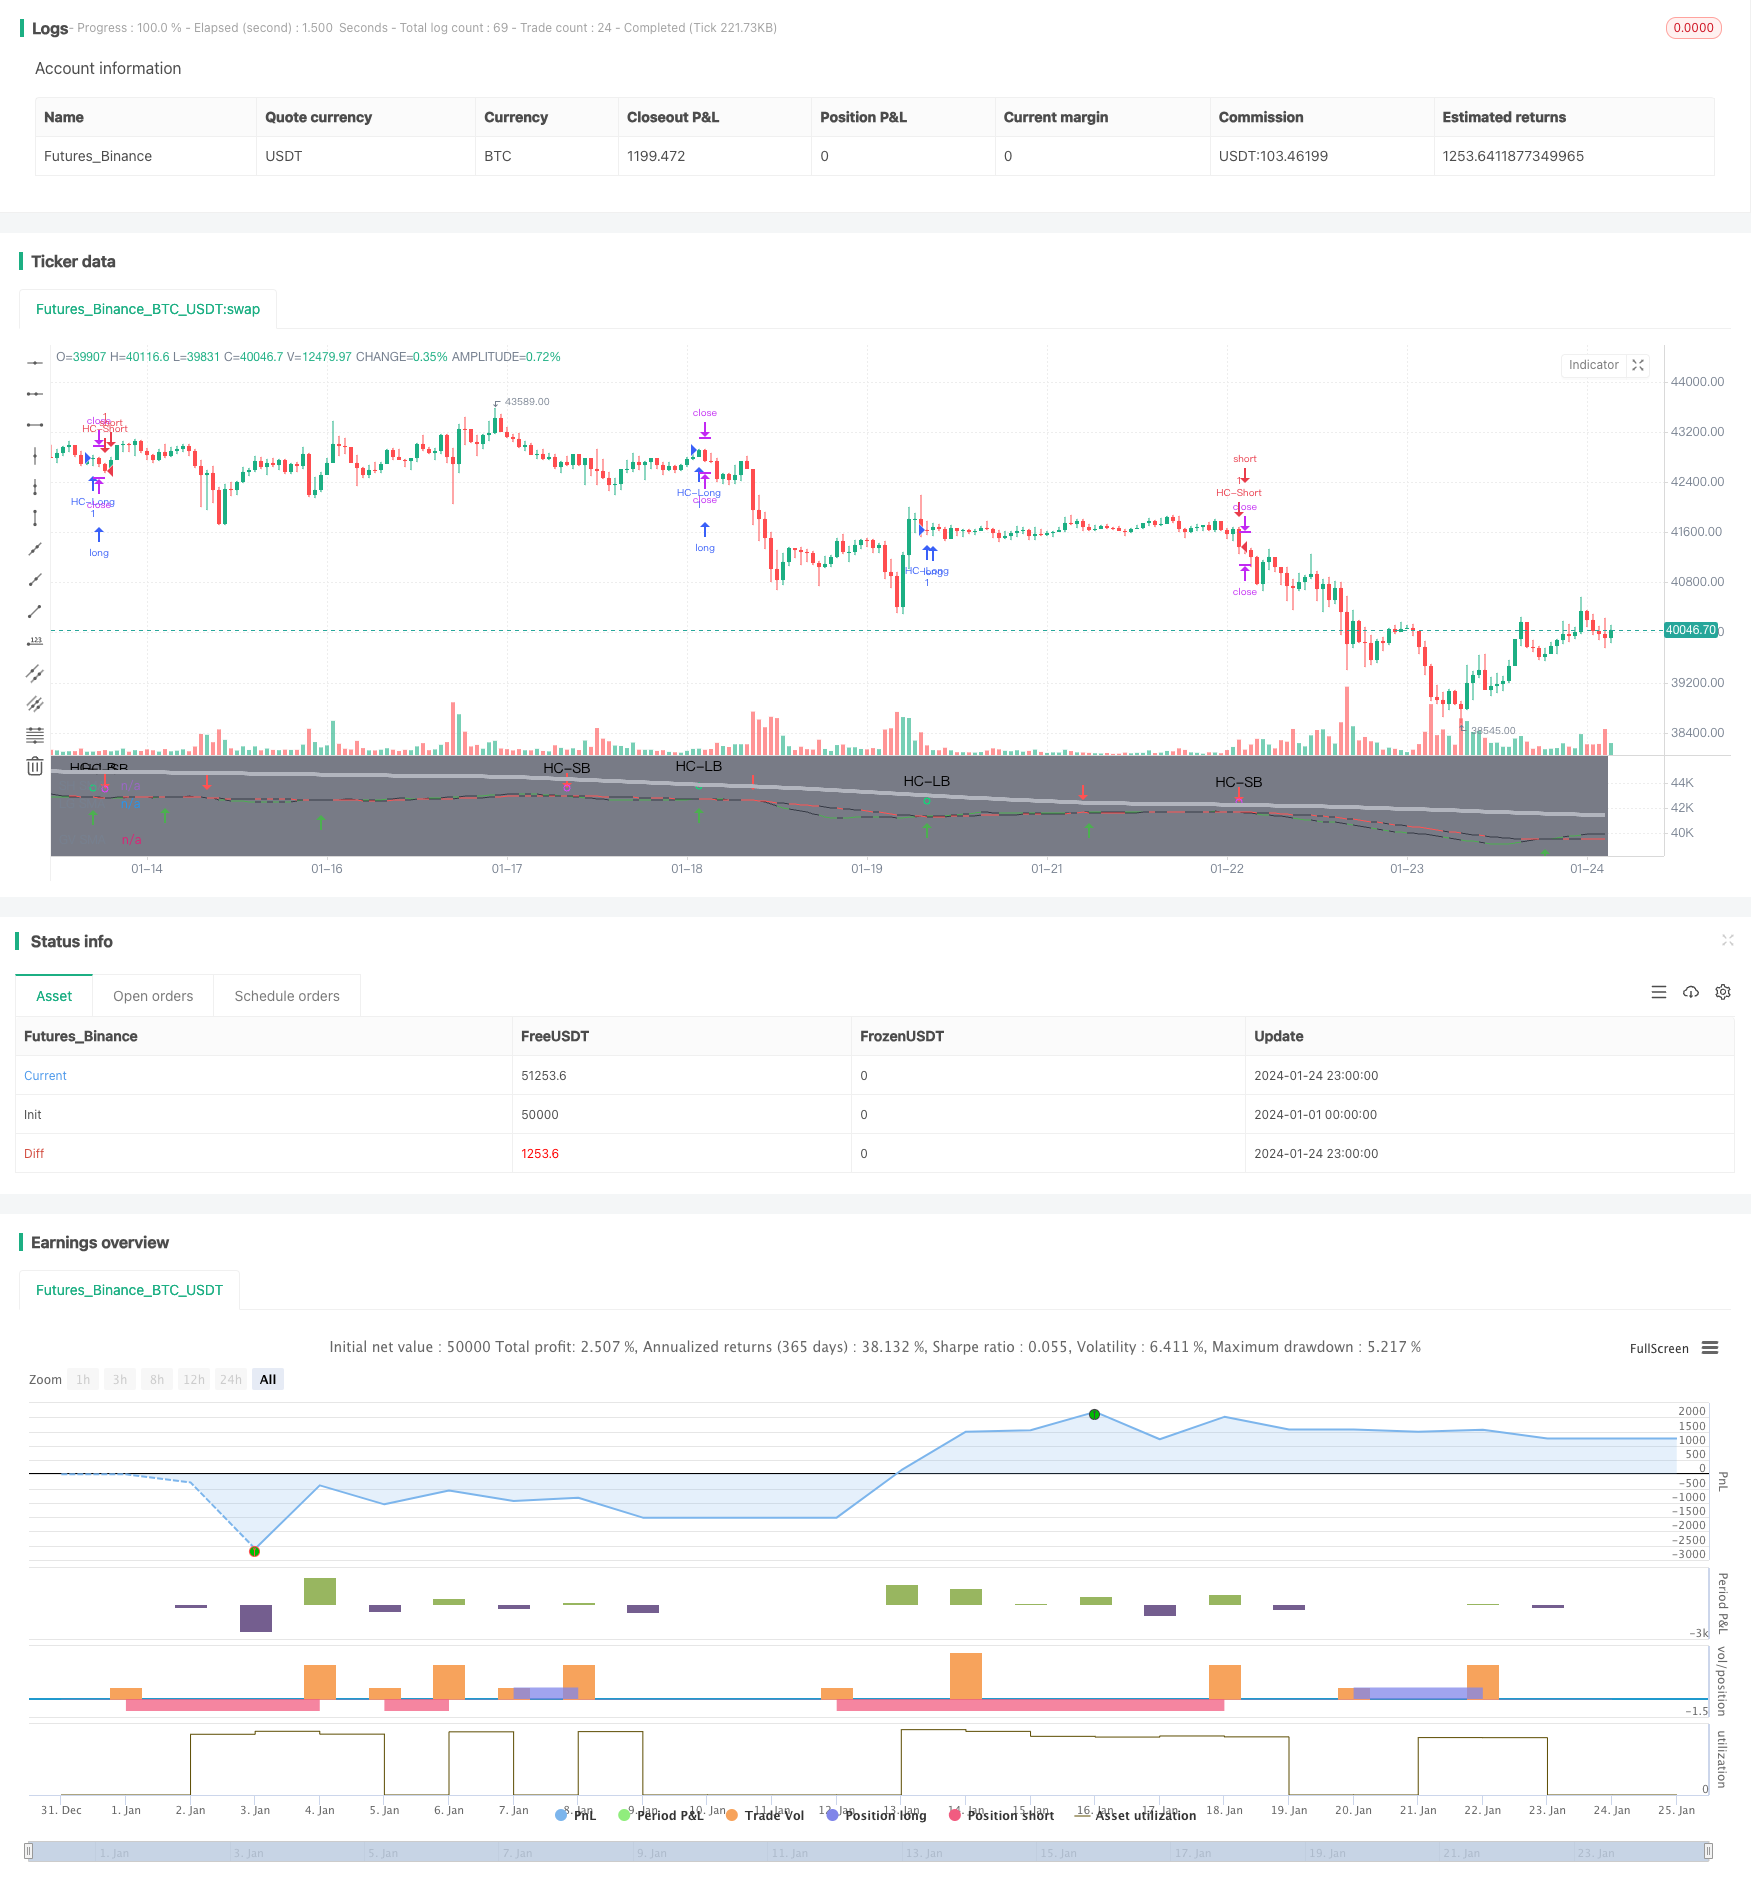
گولڈن کراس ٹریڈنگ اسٹریٹجی خرید و فروخت کے سگنل کے طور پر دو مختلف دوروں کی متحرک اوسط کی کراسنگ کا استعمال کرتی ہے۔ خاص طور پر ، جب قلیل مدتی متحرک اوسط نیچے سے طویل مدتی متحرک اوسط کو توڑتا ہے تو ، گولڈن کراس سگنل پیدا ہوتا ہے ، جس سے یہ ظاہر ہوتا ہے کہ یہ ایک بیل ہے۔ جب قلیل مدتی متحرک اوسط اوپر سے نیچے کی طرف سے طویل مدتی متحرک اوسط کو توڑتا ہے تو ، یہ ایک مردہ کراس سگنل پیدا کرتا ہے ، جس سے یہ ظاہر ہوتا ہے کہ یہ ایک ریچھ ہے۔
حکمت عملی کا اصول
یہ حکمت عملی دو اصولوں پر مبنی ہے:
چلتی اوسط مارکیٹ کے رجحانات اور طاقت کی عکاسی کرتی ہے۔ قلیل مدتی چلتی اوسط مارکیٹ کی حالیہ حرکت اور موڑ کے مقامات کو پکڑتی ہے۔ طویل مدتی چلتی اوسط مارکیٹ کے اہم رجحانات کی عکاسی کرتی ہے۔
جب قلیل مدتی حرکت پذیری اوسط اور طویل مدتی حرکت پذیری اوسط سنہری کراس تشکیل دیتے ہیں تو ، یہ ظاہر ہوتا ہے کہ قلیل مدتی مارکیٹ کی طاقت طویل مدتی رجحان کی طاقت سے زیادہ ہے ، لہذا اس کا امکان ہے کہ ایک نیا عروج کا آغاز ہوگا۔ جب موت کی کراس تشکیل دی جاتی ہے تو ، اس کا مطلب یہ ہے کہ طویل مدتی نیچے کی طرف رجحان غالب ہے ، لہذا اس کا امکان ہے کہ اس کی کمی جاری رہے۔
خاص طور پر ، اس حکمت عملی میں 13 ادوار اور 30 ادوار کی ایک سادہ حرکت پذیری اوسط طے کی گئی ہے ، اور جب وہ کراس ہوتے ہیں تو تجارتی سگنل پیدا ہوتا ہے۔ کراسنگ کا اصول مندرجہ ذیل ہے:
جب قلیل مدتی حرکت پذیری اوسط طویل مدتی حرکت پذیری اوسط سے گزرتا ہے تو ، ایک سنہری کراس سگنل پیدا ہوتا ہے ، جس کا مطلب ہے کہ زیادہ کام کرنے کا موقع ہے۔ اس وقت ، رجحان کی مضبوطی کا اندازہ کرکے داخلہ: اگر قیمت ایک خاص دورانیے سے زیادہ بڑھتی رہتی ہے تو ، اس پر اعتماد ہے کہ موجودہ بڑھتی ہوئی رجحان ہے ، تو زیادہ کام کریں۔
جب قلیل مدتی حرکت پذیر اوسط طویل مدتی حرکت پذیر اوسط کے نیچے سے گزرتا ہے تو ، ایک موت کا کراس سگنل پیدا ہوتا ہے ، جس سے یہ ظاہر ہوتا ہے کہ کم کرنے کا موقع ہے۔ اس وقت ، رجحان کی مضبوطی کا جائزہ لے کر داخلہ: اگر قیمت ایک خاص دورانیے سے زیادہ گرتی رہتی ہے تو ، اس پر اعتماد ہے کہ اس وقت نیچے کی طرف رجحان ہے ، تو کم کریں۔
حرکت پذیر اوسط کی ڈھلوان کے ذریعہ کراس سگنل کی طاقت کا اندازہ لگائیں۔ کراس سگنل کو صرف اس وقت سمجھا جاتا ہے جب قلیل مدتی اور طویل مدتی حرکت پذیر اوسط کی ڈھلوان کسی حد سے زیادہ ہو اور اس میں داخل ہونے کے قابل ہو۔ اس سے عام غلط سگنل کی مداخلت کو روکتا ہے۔
سٹاپ نقصان 20٪ اور سٹاپ نقصان 100٪ پر مقرر کیا گیا ہے.
طاقت کا تجزیہ
دو یکساں کراسنگ حکمت عملی کے درج ذیل فوائد ہیں:
سوچ صاف اور سادہ ہے، سمجھنے اور عمل کرنے میں آسان ہے، نئے آنے والوں کے لیے موزوں ہے۔
قیمت کی اوسط خصوصیات کا استعمال کرتے ہوئے ، کچھ شور مچانے کا اثر ہے ، تاکہ قلیل مدتی قیمتوں میں اتار چڑھاو سے گمراہ نہ ہوں۔
اس کے بجائے ، آپ کو بڑے پیمانے پر فیصلہ کرنے کے بجائے میکانی طور پر زیادہ سے زیادہ خالی کرنے سے بچنے کے لئے رجحان کی مضبوطی کا اندازہ لگانا چاہئے۔
سگنل کو زیادہ قابل اعتماد بنانے کے لئے ایک منتقل اوسط ڈھال حرکیات عنصر متعارف کرایا.
ریٹرننگ کو بہتر بنانا آسان ہے ، صرف چند اہم پیرامیٹرز کو ایڈجسٹ کرنے کی ضرورت ہے ، جیسے چلتی اوسط پیرامیٹرز اور رجحان کی مضبوطی کا وقت۔
خطرے کا تجزیہ
اس حکمت عملی میں مندرجہ ذیل خطرات بھی ہیں:
ڈبل یکساں کراسنگ کی نوعیت اب بھی تاخیر کا اشارہ ہے ، موڑ کے نقطہ کی کامل پیش گوئی نہیں کی جاسکتی ہے ، اور اس میں کچھ حد تک تاخیر موجود ہے۔ موزوں طور پر منتقل اوسط کی مدت کو مختصر کیا جانا چاہئے ، یا اس کے ساتھ مل کر استعمال کیا جانا چاہئے جو موڑ کے نقطہ کی پیش گوئی کرسکے۔
مکینیکل ٹریڈنگ سسٹم آسانی سے اجتماعی طور پر ایک ہی وقت میں حملہ کرتے ہیں ، جس سے معاملات میں حد سے زیادہ اضافہ ہوتا ہے ، جس سے نقصانات یا روک تھام کا اثر ختم ہوجاتا ہے۔ نقصانات کو روکنے کے لئے سیڑھیوں میں سیڑھیوں کا سیٹ ہونا چاہئے ، یا مناسب طور پر انسانی مداخلت۔
اس طرح کے سائیکل کے دوران بار بار افقی طور پر تجارت کرنے والی اقسام سے گریز کریں ، اور واضح سمت والی اقسام کا انتخاب کریں۔
رجحان کی مضبوطی کا اندازہ لگانے کے لئے وقت کی کھڑکی اس طرح مقرر کی گئی ہے کہ اگر نتائج پر اس کا بہت زیادہ اثر پڑتا ہے تو ، بہترین قدر کا تعین کرنے کے لئے بار بار جانچ کی جائے۔
اصلاح کی سمت
ڈبل مساوی لائن کراسنگ حکمت عملی کو مندرجہ ذیل طریقوں سے بھی بہتر بنایا جاسکتا ہے:
بڑے پیمانے پر رجحانات کا اندازہ لگانے کے لئے اشارے شامل کریں ، مخالف آپریشنوں سے گریز کریں۔ مثال کے طور پر ، موازنہ کی دائرے یا چاند کی لائن کی پوزیشن شامل کریں۔
ٹرانزیکشن کی مقدار کی توثیق میں شامل کریں ، صرف اس صورت میں سگنل جاری کریں جب ٹرانزیکشن کی مقدار میں اضافہ ہو ، اور جھوٹے سگنل سے بچیں۔
حرکت پذیری اوسط پیرامیٹرز کو بہتر بنائیں ، بہترین دورانیہ کا مجموعہ تلاش کریں۔ آپ کو خود سے حرکت پذیری اوسط پیرامیٹرز کو اپنانے کی کوشش کر سکتے ہیں۔
مرکزی دھارے کے فارمولے کے اشارے ، جیسے MACD ، KD اور دیگر معاون فیصلوں کے ساتھ مل کر ، سگنل کی درستگی کو بہتر بنائیں۔
سیڑھی سٹاپ نقصان روکنے والا، بہتر خطرے کو کنٹرول کرنے کے لئے.
خلاصہ کریں۔
مجموعی طور پر ، ڈبل یکساں کراسنگ حکمت عملی ایک بہت ہی بدیہی اور قابل فہم حکمت عملی ہے۔ یہ حرکت پذیر اوسط کی غیر سنجیدہ خصوصیات کو جوڑتا ہے ، اور کراسنگ کے فیصلے کے لئے آسان رجحانات کی شناخت کی صلاحیت ہے۔ اس کے ساتھ ہی ، سگنل کی کچھ تصدیق کی جاتی ہے ، اور اندھے پن سے بچنے سے بچتا ہے ، جس سے اس کی عملی اور استحکام میں بھی اضافہ ہوتا ہے۔ اس مضمون میں ذکر کردہ کچھ بہتریوں کے علاوہ ، اس حکمت عملی میں ابھی بھی بہت زیادہ اصلاح کی گنجائش موجود ہے ، اور اس میں مزید تحقیق کے قابل ہے۔
/*backtest
start: 2024-01-01 00:00:00
end: 2024-01-25 00:00:00
period: 1h
basePeriod: 15m
exchanges: [{"eid":"Futures_Binance","currency":"BTC_USDT"}]
*/

//@version=4

// This source code is subject to the terms of the Mozilla Public License 2.0 at https://mozilla.org/MPL/2.0/
// © MakeMoneyCoESTB2020


//*********************Notes for continued work***************

//************************************************************

//Hello my fellow investors
//I am creating a simple non-cluttered strategy that uses 3(+1) simple means to determine: viability, entry, and exit
//1) Has a consistent trend been maintained for several days/weeks
//2) SH SMA crossover LG SMA = Bullish entry/LG SMA crossover SH SMA = Bearish entry
//3) Use the Slope factor & Weeks in Trend (WiT) to dertermine how strong of an entry signal you are comfortable with
//4) Exit position based on next SMA cross and trend reversal or stop loss%
//3+1) For added confidence in trend detection: Apply MACD check - buy--> MACD line above signal line and corssover below histogram \\ sell --> MACD line below signal line and crossover above histogram.
//*)This code also allows you to determine your desired backtesting date compliments of alanaster


//This code is the product of many hours of hard work on the part of the greater tradingview community.  The credit goes to everyone in the community who has put code out there for the greater good.

//Happy Hunting!

// 1. Define strategy settings*************************************************************************************************************************************************************************

//Title
strategy("KISS Strategy: SMA + EMA", shorttitle="KISS Strat")

//define calculations price source
price = input(title="Price Source", defval=close)

// 2. Calculate strategy values*************************************************************************************************************************************************************************

//Calculate 13/30/200SMA
SH_SMA_length= input(title="SH SMA Length", defval=13) //short SMA length
LG_SMA_length= input(title="LG SMA Length", defval=30) //long SMA length
GV_SMA_length= input(title="SH SMA Length", defval=200) //Gravitational SMA length

SH_SMA=sma(price, SH_SMA_length) //short SMA
LG_SMA=sma(price, LG_SMA_length) //long SMA
GV_SMA=sma(price, GV_SMA_length) //gravitational SMA

//calculate MACD
//define variables for speed
fast = 12, slow = 26
//define parameters to calculate MACD
fastMA = ema(price, fast)
slowMA = ema(price, slow)
//define MACD line
macd = fastMA - slowMA
//define SIGNAL line
signal = sma(macd, 9)

//Determine what type of trend we are in
dcp = security(syminfo.tickerid, 'D', close)   //daily close price
wcp = security(syminfo.tickerid, 'W', close)   //weekly close price

WiT = input(title="Weeks In Trend", defval=1, maxval=5, minval=1)    //User input for how many weeks of price action to evaluate (Weeks in Trend = WiT)
BearTrend = false       //initialize trend variables as false
BullTrend = false       //initialize trend variables as false

// BullTrend := (wcp > SH_SMA) and (SH_SMA > LG_SMA)  //true if price is trending up based on weekly price close
// BearTrend := (wcp < SH_SMA) and (SH_SMA < LG_SMA)  //true if price is trending down based on weekly price close


// BullTrend := (price > SH_SMA) and (SH_SMA > LG_SMA)  //true if price is trending up
// BearTrend := (price < SH_SMA) and (SH_SMA < LG_SMA)  //true if price is trending down

//Determine if the market has been in a trend for 'n' weeks

n=WiT                           //create loop internal counting variable
for i=1 to WiT                  //create loop to determine if BearTrend=true to set number of weeks
    if (wcp[n] < price)         //evaluate if BearTrend=false comparing the current price to a paticular week close
        BearTrend := false      //set value to false if older price value is less than newer: trending up
        break                   //break out of for loop when trend first falters
    if (wcp[n] > price)         //evaluate if BearTrend=true comparing the current price to a paticular week close
        BearTrend := true       //set value to true if older price value is greater than newer: trending down
    n:=n-1                      //set internal counter one day closer to present

m=WiT                           //create loop internal counting variable
for j=1 to WiT                  //create loop to determine if BearTrend=true to set number of weeks
    if (wcp[m] > price)         //evaluate if BullTrend=false comparing the current price to a paticular week close
        BullTrend := false      //set value to false if older price value is greater than newer: trending down
        break                   //break out of for loop when trend first falters
    if (wcp[m] < price)         //evaluate if BullTrend=true comparing the current price to a paticular week close
        BullTrend := true       //set value to true if older price value is less than newer: trending up
    m:=m-1                      //set internal counter one day closer to present


//Determine if crossings occur
SH_LGcrossover = crossover(SH_SMA, LG_SMA)  //returns true if short crosses over long
SH_LGcrossunder = crossunder(SH_SMA, LG_SMA)    //returns true if short crosses under long

//Determine the slope of the SMAs when a cross over occurs
SlopeFactor= input(title="Slope Factor", defval=.01, minval=0, step = 0.001) //user input variable for what slope to evaluate against
XSlopeSH = abs(SH_SMA-SH_SMA[2]) //slope of short moving average (time cancels out)
XSlopeLG = abs(LG_SMA-LG_SMA[2]) //slope of long moving average (time cancels out)
StrongSlope = iff (abs(XSlopeSH-XSlopeLG)>SlopeFactor, true, false) //create a boolean variable to determine is slope intensity requirement is met

// ************************************ INPUT BACKTEST RANGE ******************************************=== coutesy of alanaster
fromMonth = input(defval = 4,    title = "From Month",      type = input.integer, minval = 1, maxval = 12)
fromDay   = input(defval = 1,    title = "From Day",        type = input.integer, minval = 1, maxval = 31)
fromYear  = input(defval = 2020, title = "From Year",       type = input.integer, minval = 1970)
thruMonth = input(defval = 1,    title = "Thru Month",      type = input.integer, minval = 1, maxval = 12)
thruDay   = input(defval = 1,    title = "Thru Day",        type = input.integer, minval = 1, maxval = 31)
thruYear  = input(defval = 2112, title = "Thru Year",       type = input.integer, minval = 1970)

// === INPUT SHOW PLOT ===
showDate  = input(defval = true, title = "Show Date Range", type = input.bool)

// === FUNCTION EXAMPLE ===
start     = timestamp(fromYear, fromMonth, fromDay, 00, 00)        // backtest start window
finish    = timestamp(thruYear, thruMonth, thruDay, 23, 59)        // backtest finish window
window()  => true

bgcolor(color = showDate and window() ? color.gray : na, transp = 90)
// === EXECUTION ===
//strategy.entry("L", strategy.long, when = window() and crossOv)    // enter long when "within window of time" AND crossover
//strategy.close("L", when = window() and crossUn)                   // exit long when "within window of time" AND crossunder

// 3. Output strategy data*************************************************************************************************************************************************************************

//Embolden line if a trend exists
trendcolorLG = BearTrend?color.red:color.black //highlights beartrend condition met graphically
trendcolorSH = BullTrend?color.green:color.black //highlights beartrend condition met graphically

//plot SMAs
plot(SH_SMA, title = "SH SMA", color = trendcolorSH)
plot(LG_SMA, title = "LG SMA", color = trendcolorLG)
plot(GV_SMA, title = "GV SMA", color = color.silver, linewidth = 4, transp = 70)

//Highlight crossovers
plotshape(series=SH_LGcrossover, style=shape.arrowup, location=location.belowbar,size=size.normal, color=color.green)
plotshape(series=SH_LGcrossunder, style=shape.arrowdown, location=location.abovebar,size=size.normal, color=color.red)

// 4. Determine Long & Short Entry Calculations*************************************************************************************************************************************************************************

//Define countback variable
countback=input(minval=0, maxval=5, title="Price CountBack", defval=0)
//User input for what evaluations to run: SMA or SMA + EMA
SMA_Y_N=input(defval = "Y", title="Run SMA", type=input.string, options=["Y", "N"])
MACD_Y_N=input(defval = "N", title="Run MACD", type=input.string, options=["Y", "N"])

//Calculate SMA Cross entry conditions
SMAbuy=false
SMAsell=false
SMAbuy := SH_LGcrossover and StrongSlope and BearTrend[WiT*7]   //enter long if short SMA crosses over long SMA & security has been in a BearTrend for 'n' days back
SMAsell := SH_LGcrossunder and StrongSlope and BullTrend[WiT*7] //enter short if short SMA crosses under long SMA & security has been in a BullTrend for 'n' days back

//Calculate MACD Cross entry conditions
MACDbuy = iff(MACD_Y_N=="Y", crossunder(signal[countback], macd[countback]), true) and iff(MACD_Y_N=="Y", macd[countback]<0, true) and StrongSlope and BearTrend     //enter long if fast MACD crosses over slow MACD & there is a strong slope & security has been in a BearTrend for 'n' days back
MACDsell = iff(MACD_Y_N=="Y", crossunder(macd[countback], signal[countback]), true) and iff(MACD_Y_N=="Y", signal[countback]>0, true) and StrongSlope and BullTrend  //enter short if fast MACD crosses under slow MACD & there is a strong slope & security has been in a BullTrend for 'n' days back

//long entry condition
dataHCLB=(iff(SMA_Y_N=="Y", SMAbuy, true) and iff(MACD_Y_N=="Y", MACDbuy, true))
plotshape(dataHCLB, title= "HC-LB", color=color.lime, style=shape.circle, text="HC-LB")
strategy.entry("HC-Long", strategy.long, comment="HC-Long", when = dataHCLB and window())

//short entry condition
dataHCSB=(iff(SMA_Y_N=="Y", SMAsell, true) and iff(MACD_Y_N=="Y", MACDsell, true))
plotshape(dataHCSB, title= "HC-SB", color=color.fuchsia, style=shape.circle, text="HC-SB")
strategy.entry("HC-Short", strategy.short, comment="HC-Short", when=dataHCSB and window())


// 5. Submit Profit and Loss Exit Calculations Orders*************************************************************************************************************************************************************************

// User Options to Change Inputs (%)
stopPer = input(12, title='Stop Loss %', type=input.float) / 100
takePer = input(25, title='Take Profit %', type=input.float) / 100

// Determine where you've entered and in what direction
longStop = strategy.position_avg_price * (1 - stopPer)
shortStop = strategy.position_avg_price * (1 + stopPer)
shortTake = strategy.position_avg_price * (1 - takePer)
longTake = strategy.position_avg_price * (1 + takePer)

//exit position conditions and orders
if strategy.position_size > 0//or crossunder(price[countback], upperBB)
    strategy.exit(id="Close Long", when = window(), stop=longStop, limit=longTake)
if strategy.position_size < 0 //or crossover(price[countback], lowerBB)
    strategy.exit(id="Close Short", when = window(), stop=shortStop, limit=shortTake)


//Evaluate/debug equation***************************************************************************************************************************************************************************
// plotshape((n==5? true : na), title='n=5', style=shape.labeldown, location=location.abovebar, text='5', color=color.white, textcolor=color.black, transp=0) //print n value if 5
// plotshape((n==4? true : na), title='n=4', style=shape.labeldown, location=location.abovebar, text='4', color=color.white, textcolor=color.black, transp=0) //print n value if 4
// plotshape((n==3? true : na), title='n=3', style=shape.labeldown, location=location.abovebar, text='3', color=color.white, textcolor=color.black, transp=0) //print n value if 3
// plotshape((n==2? true : na), title='n=2', style=shape.labeldown, location=location.abovebar, text='2', color=color.white, textcolor=color.black, transp=0) //print n value if 2
// plotshape((n==1? true : na), title='n=1', style=shape.labeldown, location=location.abovebar, text='1', color=color.white, textcolor=color.black, transp=0) //print n value if 1
// lineValue = 11                                           //set random visible line value to check when equation is true
// colorP = (BearTrend==true) ? color.green : color.red
// plot (lineValue, title = "BearTrend", color = colorP)   //Plot when condition true=green, false=red
// plot (XSlopeLG+15, color=color.white) //used for code debugging
// plot (XSlopeSH+15, color=color.blue) //used for code debugging
// plot (abs(XSlopeSH-XSlopeLG)+20, color=color.fuchsia) //used for code debugging