ملٹی ٹائم فریم کا رجحان مندرجہ ذیل حکمت عملی
جائزہ
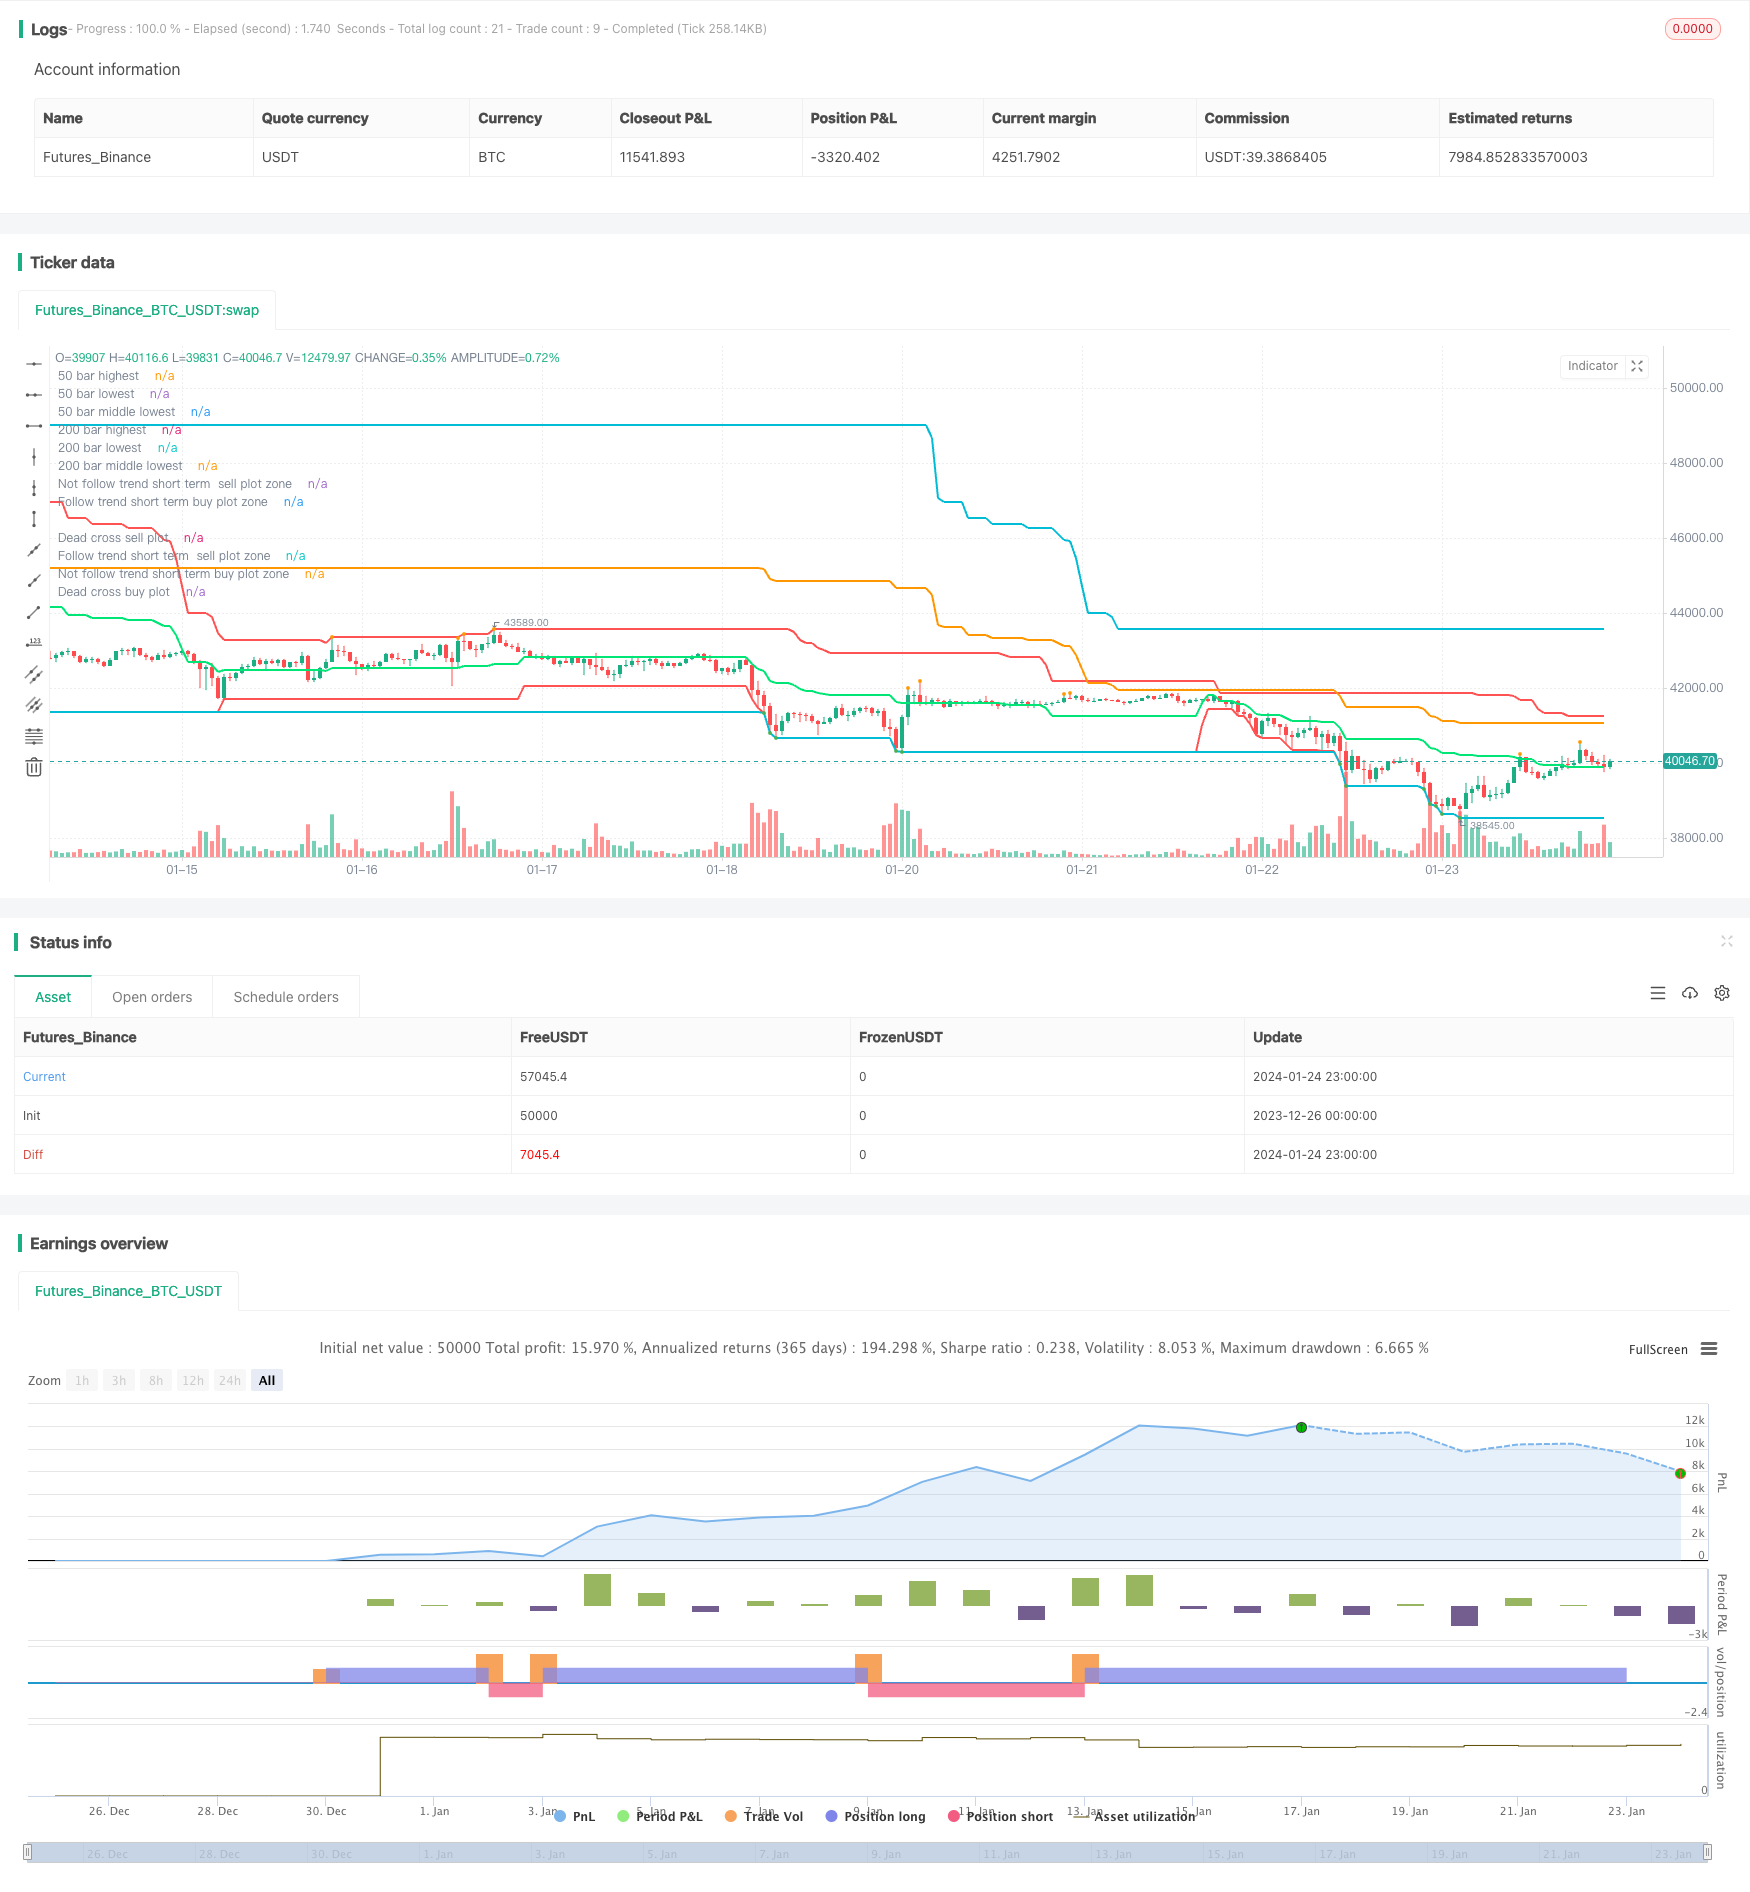
یہ حکمت عملی مختلف ٹائم پیکیجز ((50 بار اور 200 بار) میں اعلی ترین اور کم ترین قیمتوں کا حساب کتاب کرکے قیمتوں کا ایک اہم چینل بناتی ہے ، جو طویل مدتی رجحان کی سمت کی نمائندگی کرتی ہے۔ اس کے ساتھ ساتھ مختصر مدت کے رجحان کی سمت کا تعین کرنے کے لئے تیز سگنل لائنوں اور سست سگنل لائنوں کے ساتھ مل کر کام کرتی ہے۔ طویل مدتی رجحان کی سمت کے مطابق ہونے پر حکمت عملی کو اشارہ کیا جاتا ہے۔
حکمت عملی کا اصول
سب سے پہلے ، قیمتوں کے دو چینلز تشکیل دیئے گئے ہیں جو طویل مدتی رجحان کی سمت کی نمائندگی کرتے ہیں ، آخری 50 بار میں اعلی اور کم قیمتوں کے ساتھ ساتھ آخری 200 بار میں اعلی اور کم قیمتوں کا حساب لگاتے ہوئے۔
دوسرا ، آخری 7 بار کی اعلی ترین اور کم ترین قیمتوں کا حساب لگانا۔ تیز رفتار سگنل چینل کا فیصلہ قلیل مدتی رجحانات کا حساب لگانا۔ آخری 20 بار کی اعلی ترین اور کم ترین قیمتوں کا حساب لگانا۔ سست رفتار سگنل چینل کا فیصلہ قلیل مدتی رجحانات کا حساب لگانا۔
آخر میں ، جب فوری سگنل چینل ، سست سگنل چینل اور طویل مدتی قیمت چینل کی سمت ایک جیسی ہو تو داخلہ سگنل کی تجویز کریں۔ مثال کے طور پر ، تمام چینلز بڑھتے ہوئے رجحان میں ہیں ، خریدنے کی تجویز کرتے ہیں۔ تمام چینلز نیچے کی طرف ہیں ، فروخت کرنے کی تجویز کرتے ہیں۔
طاقت کا تجزیہ
اس حکمت عملی کا سب سے بڑا فائدہ یہ ہے کہ طویل اور قلیل مدتی یکساں رجحانات کی سمت کی نشاندہی کی جاسکتی ہے۔ قیمتوں کے مختلف ٹائم پیکیج چینلز کی تصدیق کے ذریعہ ، قلیل مدتی مارکیٹ کے شور سے الجھنے سے بچنے کے لئے موثر ہے۔
اس کے علاوہ ، حکمت عملی میں متعدد ٹائم فریم فیصلے کا استعمال کیا گیا ہے ، یہاں تک کہ اگر قلیل مدتی قیمتوں میں ردوبدل ہوتا ہے تو ، سگنل کو آسانی سے تبدیل نہیں کیا جاسکتا ہے ، جس سے سگنل کی استحکام کو یقینی بنایا جاسکتا ہے۔
خطرے کا تجزیہ
اس حکمت عملی کا بنیادی خطرہ یہ ہے کہ جب طویل اور قلیل مدتی رجحان الٹ جاتا ہے تو ، سگنل کی پیداوار میں کچھ تاخیر ہوتی ہے کیونکہ متعدد ٹائم سائیکل چینل کی تصدیق کی ضرورت ہوتی ہے۔ اس وقت ، اگر اندھے فالو اپ کی وجہ سے نقصانات میں توسیع ہوسکتی ہے۔
اس کے علاوہ ، ہائی فریکوئینسی ٹریڈنگ کے لئے غیر دوستانہ ہے ، جو قلیل مدتی قیمتوں میں اتار چڑھاو پر فوری رد عمل ظاہر نہیں کرسکتا ہے۔ اگر شدید صورتحال کا سامنا کرنا پڑتا ہے تو ، اسٹاپ نقصان کی شرائط کو غلط طریقے سے طے کرنا بھی زیادہ نقصان کا سبب بن سکتا ہے۔
اصلاح کی سمت
متحرک اسٹاپ نقصان کی حکمت عملی کو ایڈجسٹ کرنے پر غور کیا جاسکتا ہے ، جب قیمت کسی خاص تناسب کو منفی سمت میں توڑ دیتی ہے تو اسٹاپ نقصان سے باہر نکلنا ، جو خطرے کو مؤثر طریقے سے کنٹرول کرسکتا ہے۔
اس کے علاوہ ، قیمتوں کے مزید چینلز کو مختلف لمبائیوں میں شامل کیا جاسکتا ہے ، اور حتمی سگنل کو ووٹنگ کے ذریعہ طے کیا جاسکتا ہے ، جس سے فیصلہ کی درستگی میں اضافہ ہوتا ہے۔
یا مشین لرننگ الگورتھم کا استعمال کرتے ہوئے ہر چینل پیرامیٹرز کو خود بخود بہتر بنائیں تاکہ پیرامیٹرز کو موجودہ مارکیٹ کے ماحول کے مطابق بنایا جاسکے۔
خلاصہ کریں۔
اس حکمت عملی کا مجموعی نظریہ واضح اور سمجھنے میں آسان ہے ، مارکیٹ کے رجحانات کا اندازہ لگانے کے لئے ملٹی ٹائم فریم پرائس چینل کے ذریعہ ، مختصر مدت کے بازار کے شور کو مؤثر طریقے سے ختم کیا جاسکتا ہے۔ تاہم ، واپسی کے رجحانات کو سنبھالنے اور خطرے پر قابو پانے کے لئے سخت اقدامات کرنے کی ضرورت ہے۔ اگر نقصان کو روکنے کی حکمت عملی اور پیرامیٹرز کی اصلاح کے ساتھ مل کر حکمت عملی کی استحکام اور عملی جنگ کی تاثیر کو مزید بڑھا دیا جاسکتا ہے۔
/*backtest
start: 2023-12-26 00:00:00
end: 2024-01-25 00:00:00
period: 1h
basePeriod: 15m
exchanges: [{"eid":"Futures_Binance","currency":"BTC_USDT"}]
*/

// This source code is subject to the terms of the Mozilla Public License 2.0 at https://mozilla.org/MPL/2.0/
// © ZoomerXeus

//@version=4
strategy("Swing High Low Price Channel V.1", overlay=true)

//========================= variable =================================//
dead_channel_source = input(title="Main swing channel source", defval="H/L", options=["H/L"])
fast_signal_length = input(title="Fast Slow Length", type=input.integer, defval=7, maxval=49, minval=1)
slow_signal_length = input(title="Slow Slow Length", type=input.integer, defval=20, maxval=49, minval=1)
is_show_only_dead_channel = input(title="Show main channel only", defval=true)
main_channel_width = input(title="Main line width", defval=2, minval=1)
signal_channel_width = input(title="Signal line width", defval=1, minval=1)

//========================= indicator function =================================//
dead_cross_high_50 = highest(high, 50)
dead_cross_high_200 = highest(high, 200)
//========================================
dead_cross_low_50 = lowest(low, 50)
dead_cross_low_200 = lowest(low, 200)
//========================================
medain_dead_cross_50 = ((dead_cross_high_50-dead_cross_low_50)*0.5)+dead_cross_low_50
medain_dead_cross_200 = ((dead_cross_high_200-dead_cross_low_200)*0.5)+dead_cross_low_200


//========================================
fasthighest = highest(high, fast_signal_length)
fastlowest = lowest(low, fast_signal_length)
//========================================
slowhighest = highest(high, slow_signal_length)
slowlowest = lowest(low, slow_signal_length)
//========================================


//========================= plot =================================//
plot(dead_channel_source == "H/L" ? dead_cross_high_50 : na,title="50 bar highest", color=color.red, linewidth=main_channel_width)
plot(dead_channel_source == "H/L" ? dead_cross_high_200 : na,title="200 bar highest", color=color.aqua, linewidth=main_channel_width)
plot(dead_channel_source == "H/L" ? dead_cross_low_50 : na,title="50 bar lowest", color=color.red, linewidth=main_channel_width)
plot(dead_channel_source == "H/L" ? dead_cross_low_200 : na,title="200 bar lowest", color=color.aqua, linewidth=main_channel_width)
plot(dead_channel_source == "H/L" ? medain_dead_cross_200 : na,title="200 bar middle lowest", color=color.orange, linewidth=main_channel_width)
plot(dead_channel_source == "H/L" ? medain_dead_cross_50 : na,title="50 bar middle lowest", color=color.lime, linewidth=main_channel_width)
//===========================================
plot(is_show_only_dead_channel == false ? fasthighest : na,title="fast signal highest", color=#ff00f9, linewidth=signal_channel_width)
plot(is_show_only_dead_channel == false ? fastlowest : na,title="fast signal lowest", color=#ff00f9, linewidth=signal_channel_width)
plot(is_show_only_dead_channel == false ? slowhighest : na,title="slow signal highest", color=color.white, linewidth=signal_channel_width)
plot(is_show_only_dead_channel == false ? slowlowest : na,title="slow signal lowest", color=color.white, linewidth=signal_channel_width)
//===========================================
plot(crossover(medain_dead_cross_50, medain_dead_cross_200) ? medain_dead_cross_200 : na, title="Dead cross buy plot", style=plot.style_circles, linewidth=6, color=color.lime)
plot(crossunder(medain_dead_cross_50, medain_dead_cross_200) ? medain_dead_cross_200 : na, title="Dead cross sell plot", style=plot.style_circles, linewidth=6, color=color.red)
plot(is_show_only_dead_channel and (medain_dead_cross_50 < medain_dead_cross_200) and high == slowhighest ? high : na, title="Follow trend short term  sell plot zone", style=plot.style_circles, linewidth=3, color=color.orange)
plot(is_show_only_dead_channel and (medain_dead_cross_50 > medain_dead_cross_200) and low == slowlowest ? low : na, title="Follow trend short term buy plot zone", style=plot.style_circles, linewidth=3, color=color.green)
plot(is_show_only_dead_channel and high == slowhighest and (high == dead_cross_high_200) ? high : na, title="Not follow trend short term  sell plot zone", style=plot.style_circles, linewidth=3, color=color.orange)
plot(is_show_only_dead_channel and low == slowlowest and (low == dead_cross_low_200) ? low : na, title="Not follow trend short term buy plot zone", style=plot.style_circles, linewidth=3, color=color.green)

//===================== open close order condition =========================================================//
strategy.entry("strong buy", true, 1, when=low == dead_cross_low_200)
strategy.exit("close strong buy 50%", "strong buy", qty_percent=50, when=high==slowhighest)
strategy.entry("strong sell", false, 1, when=high == dead_cross_high_200)
strategy.exit("close strong sell 50%", "strong sell", qty_percent=50, when=low==slowlowest)