متعدد تکنیکی اشارے کا استعمال کرتے ہوئے ایک مقداری تجارتی حکمت عملی
جائزہ
یہ حکمت عملی ایک ایسی حکمت عملی ہے جس میں متعدد تکنیکی اشارے کا استعمال کرتے ہوئے مقدار کی تجارت کی جاتی ہے۔ بنیادی طور پر ای ایم اے اوسط لائن کراس ، سپر ٹرینڈ اشارے ، آر ایس آئی اشارے ، ایم اے سی ڈی اشارے اور دیگر متعدد اشارے کا استعمال کرتے ہوئے تجارتی سگنل تشکیل دیا جاتا ہے۔
حکمت عملی کا اصول
اس حکمت عملی کا بنیادی تجارتی منطق مندرجہ ذیل پہلوؤں پر مبنی ہے:
ای ایم اے اوسط لائن کراسنگ: حساب لگائیں کہ تیز لائن ای ایم اے 1 اور آہستہ لائن ای ایم اے 2 ، جب تیز لائن پر آہستہ لائن عبور کرتے ہیں تو خریدنے کا اشارہ پیدا ہوتا ہے ، جب تیز لائن کے نیچے آہستہ لائن عبور کرتے ہیں تو فروخت کا اشارہ پیدا ہوتا ہے۔
VWMA میڈین لائن: VWMA میڈین لائن کا حساب لگایا جاتا ہے ، جب بند ہونے والی قیمت پر میڈین لائن کو عبور کرنا خریدنے کا اشارہ سمجھا جاتا ہے ، اور نیچے کی طرف سے میڈین لائن کو عبور کرنا فروخت کرنے کا اشارہ سمجھا جاتا ہے۔
سپر ٹرینڈ انڈیکیٹر: اے ٹی آر اور ملٹیپلر پیرامیٹرز کے مطابق سپر ٹرینڈ کے اوپر اور نیچے کی پیمائش کریں ، اور رجحان کی سمت کا تعین کریں۔ بڑھتے ہوئے رجحان میں خریدنے کا اشارہ پیدا کریں ، اور گرنے والے رجحان میں فروخت کا اشارہ پیدا کریں۔
RSI اشارے: RSI اشارے کا حساب لگائیں۔ RSI خرید لائن سے اوپر فروخت کے اشارے کے طور پر سمجھا جاتا ہے ، اور RSI اوور سیل زون سے نیچے خرید کے اشارے کے طور پر سمجھا جاتا ہے۔
MACD اشارے: MACD کی فوری لائن ، سست لائن اور سگنل لائن کا حساب لگائیں ، فوری لائن پر سگنل لائن کو عبور کرتے وقت خرید سگنل پیدا ہوتا ہے ، جب فوری لائن کے نیچے سگنل لائن کو عبور کرتے وقت فروخت سگنل پیدا ہوتا ہے۔
مذکورہ بالا متعدد اشارے کے تجارتی سگنل حاصل کرنے کے بعد ، حکمت عملی نے ایک AND اور ایک منطق کا استعمال کرتے ہوئے فیصلہ کیا ، یعنی ، جب متعدد اشارے بیک وقت سگنل جاری کرتے ہیں تو خرید و فروخت کے حتمی سگنل پیدا ہوتے ہیں۔
اسٹریٹجک فوائد
اس حکمت عملی میں مارکیٹ کو سمجھنے کے لئے متعدد اشارے شامل ہیں ، جو جعلی سگنل کو مؤثر طریقے سے کم کرسکتے ہیں۔ اس کے اہم فوائد میں شامل ہیں:
ایک سے زیادہ اشارے کا استعمال کرتے ہوئے جامع فلٹرنگ ، ایک ہی اشارے کی وجہ سے غلط سگنل کو کم کیا جاسکتا ہے۔
رجحان اشارے اور جھٹکا اشارے کے ساتھ مل کر ، رجحان کے حالات میں اضافی منافع حاصل کیا جاسکتا ہے۔
اس کے علاوہ ، اس میں اسٹاپ نقصان کی منطق کا استعمال کیا گیا ہے ، جس سے ایک ہی تجارت میں زیادہ سے زیادہ نقصان کو مؤثر طریقے سے کنٹرول کیا جاسکتا ہے۔
اس طرح ، آپ کو ایک بار جب آپ کو نقصان پہنچتا ہے تو ، آپ کو دوبارہ حاصل کرنے کا موقع ملتا ہے ، اور آپ کو زیادہ خطرہ ہوتا ہے۔
اسٹریٹجک رسک
اس حکمت عملی میں مندرجہ ذیل خطرات شامل ہیں:
ایک سے زیادہ اشاریہ پورٹ فولیو بہت محتاط ہوسکتا ہے اور کچھ تجارتی مواقع سے محروم ہوسکتا ہے۔ انڈیکس پورٹ فولیو کو مناسب طریقے سے آسان بنایا جاسکتا ہے۔
بیعانہ میں اضافے کی منطق سے نقصانات میں اضافہ ہوسکتا ہے۔ مناسب حد مقرر کی جائے۔
سٹاپ نقصان کی پوزیشن کی غلط ترتیب سے غیر ضروری نقصان کا سبب بن سکتا ہے۔ اس کے لیے اپنی مرضی کے مطابق سٹاپ نقصان کی پوزیشن بنائی جائے۔
اشارے کے پیرامیٹرز کی غلط ترتیب سے بہت زیادہ غلط سگنل پیدا ہوسکتے ہیں۔ بہترین پیرامیٹرز کا مجموعہ حاصل کرنے کے لئے پیرامیٹرز کو بہتر بنایا جانا چاہئے۔
حکمت عملی کی اصلاح کی سمت
اس حکمت عملی کو مزید بہتر بنانے کے لیے مندرجہ ذیل نکات پر غور کیا جا سکتا ہے۔
مختلف پیرامیٹرز کے مجموعے کے اشارے کے اثر کا اندازہ کریں ، اشارے کا وزن منتخب کریں۔
مختلف اشارے پیرامیٹرز کی ترتیبات کی جانچ پڑتال کریں.
ایڈجسٹمنٹ سٹاپ نقصان کی منطق۔
متحرک پوزیشن مینجمنٹ میکانزم میں شامل ہونا۔
پیرامیٹرز اور ماڈل کو بہتر بنانے کے لئے مشین لرننگ کا استعمال کریں۔
خلاصہ کریں۔
یہ حکمت عملی مجموعی طور پر ایک بہت ہی عملی مقدار کی تجارت کی حکمت عملی ہے۔ یہ مارکیٹ کے فیصلوں کو مؤثر طریقے سے انجام دینے کے لئے متعدد کلاسیکی تکنیکی اشارے کے فوائد کو جوڑتا ہے۔ پیرامیٹرز کی اصلاح اور ماڈل تکرار کے ذریعہ ، اس حکمت عملی کو بہتر تجارتی اثر حاصل کیا جاسکتا ہے۔
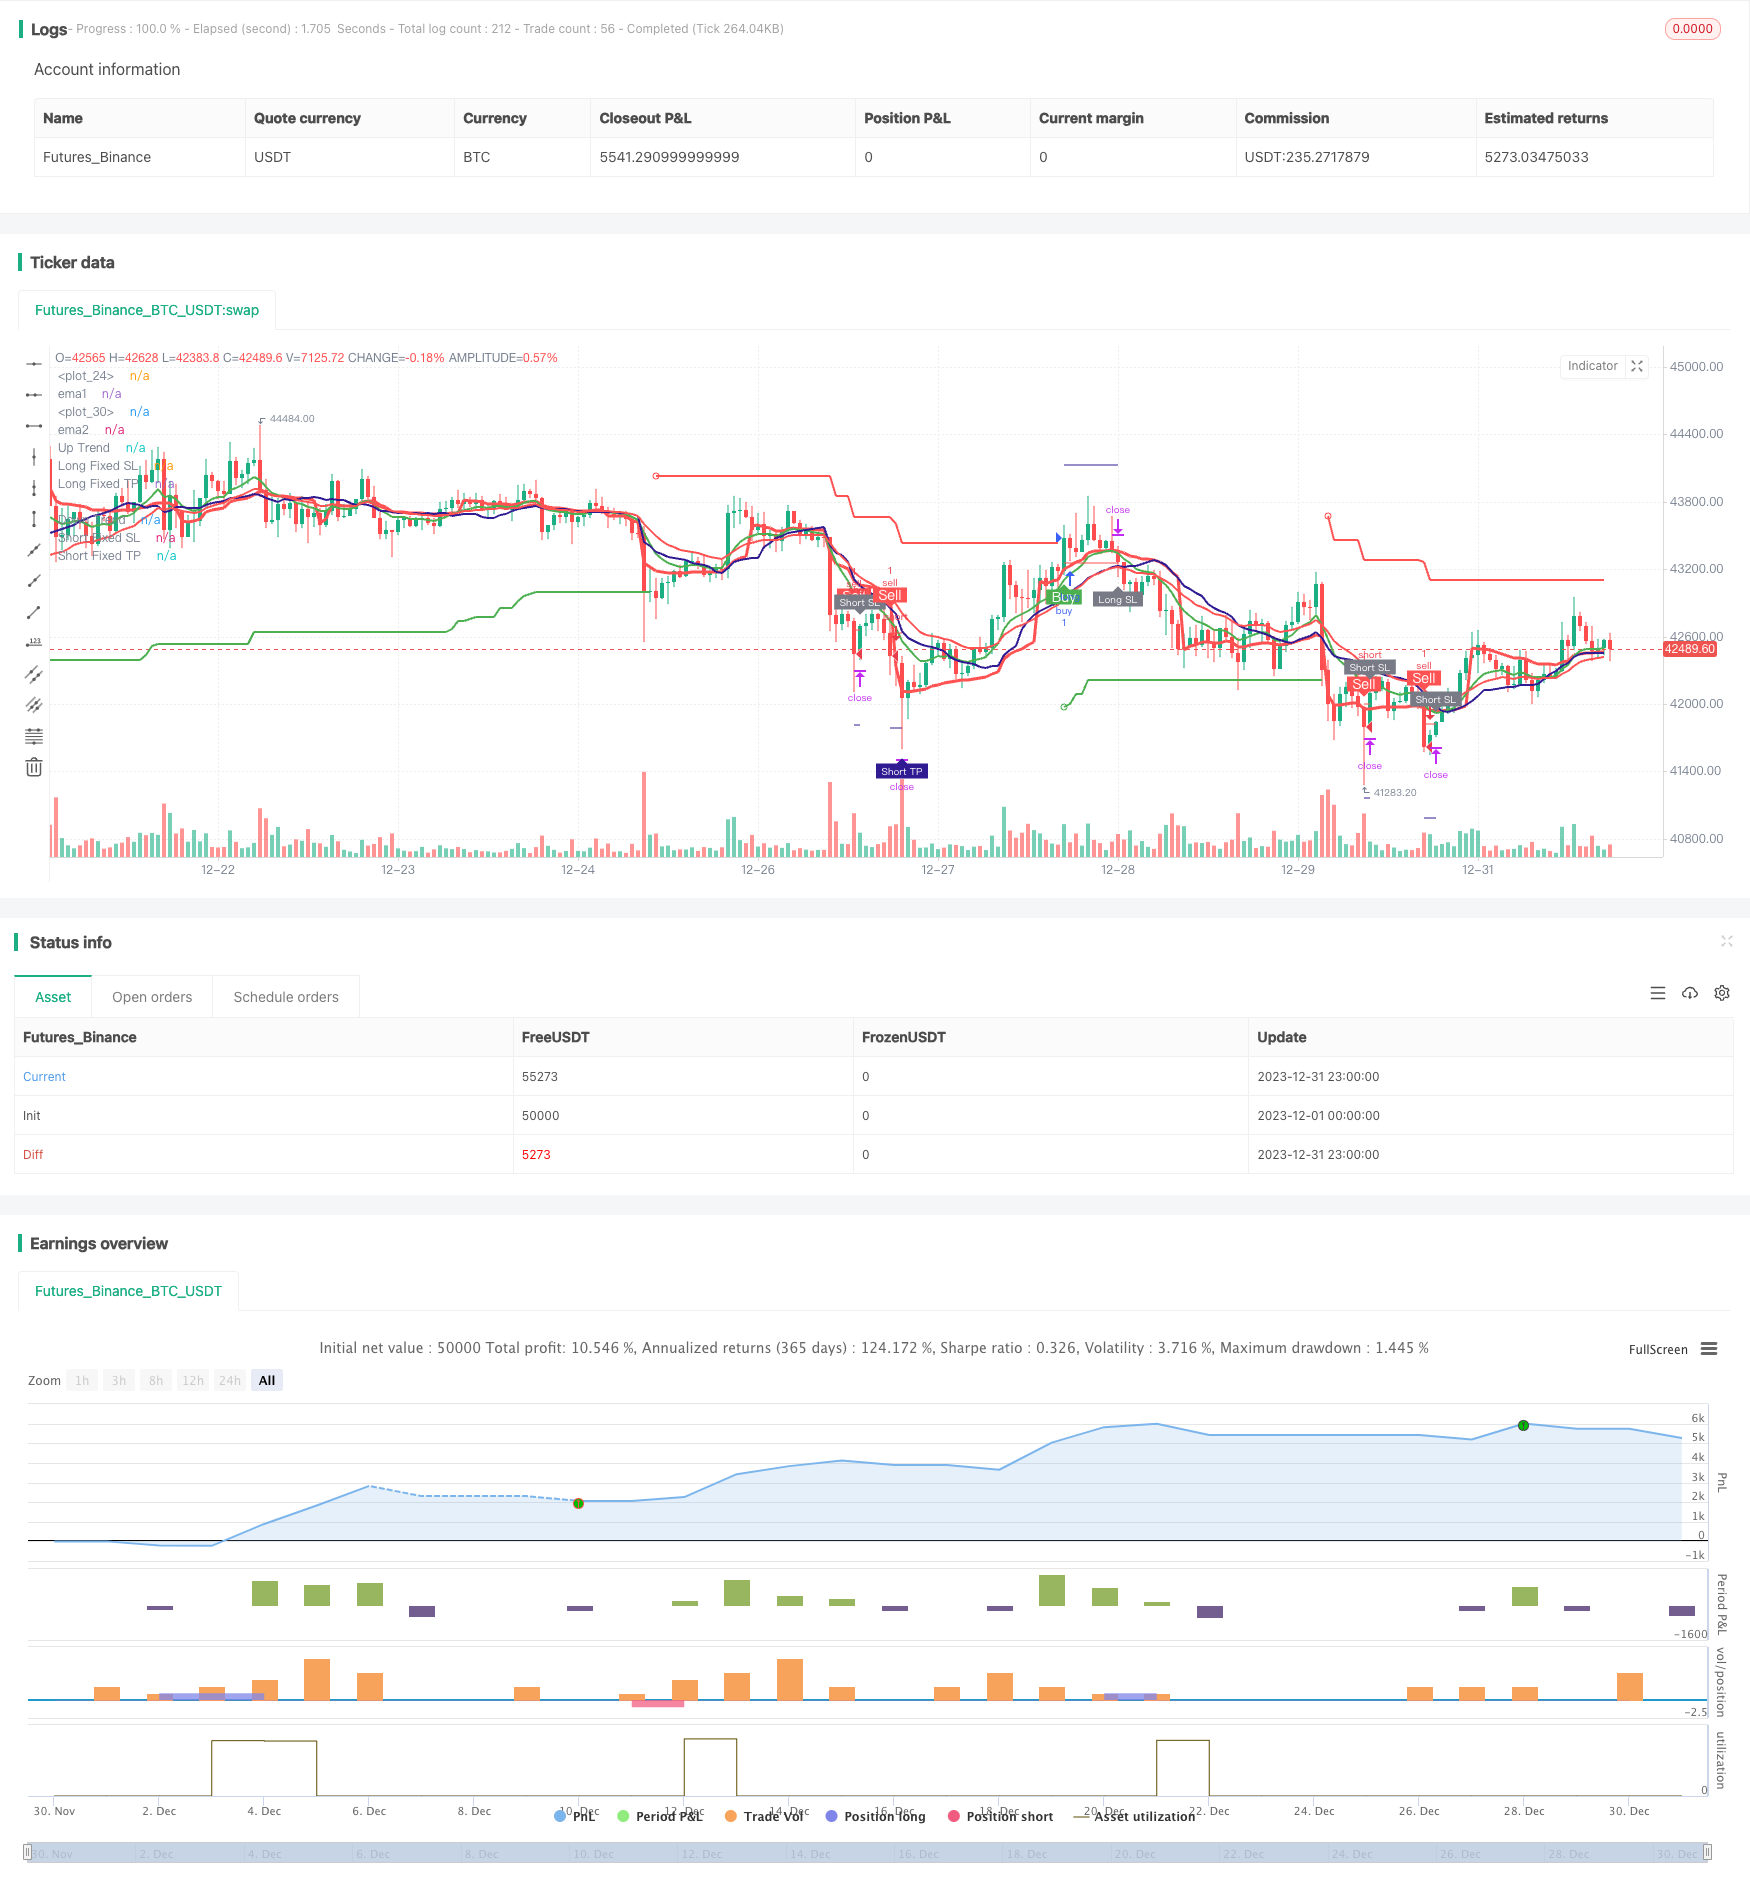
/*backtest
start: 2023-12-01 00:00:00
end: 2023-12-31 23:59:59
period: 1h
basePeriod: 15m
exchanges: [{"eid":"Futures_Binance","currency":"BTC_USDT"}]
*/


//@version=5
strategy(title='Pinku Buy', overlay=true)

fromMonth = input.int(defval=1, title='From Month', minval=1, maxval=12)
fromDay = input.int(defval=1, title='From Day', minval=1, maxval=31)
fromYear = input.int(defval=2021, title='From Year', minval=1970)
thruMonth = input.int(defval=1, title='Thru Month', minval=1, maxval=12)
thruDay = input.int(defval=1, title='Thru Day', minval=1, maxval=31)
thruYear = input.int(defval=2112, title='Thru Year', minval=1970)

showDate = input(defval=true, title='Show Date Range')

start = timestamp(fromYear, fromMonth, fromDay, 00, 00)
finish = timestamp(thruYear, thruMonth, thruDay, 23, 59)
window() => true
// ema crossover
length1 = input.int(10)
length2 = input.int(20)
ema1 = ta.ema(close , length1)
ema2 = ta.ema(close , length2)
//vwap
VWAP = ta.vwap(hlc3)
plot(VWAP, color=color.new(color.red, 0), linewidth=3)
buy_1 = close > VWAP
sell_1 = close < VWAP
//vwma
len = input.int(20, 'VWMA_len', minval=1)
ma = ta.vwma(close, len)
plot(ma, color=color.new(color.navy, 0), linewidth=2)
buy_2 = close > ma
sell_2 = close < ma
//super trend
//inputs
Periods = input(title='STR Period', defval=22)
Source = input(hl2, title='Source')
Multiplier = input.float(title='STR Multiplier', step=0.1, defval=5.0)


//Compute ATR Levels
atr = ta.atr(Periods)


//Creating Upper Channel

up = Source - Multiplier * atr
up1 = nz(up[1], up)
up := close[1] > up1 ? math.max(up, up1) : up

//Creating Down Channel
dn = Source + Multiplier * atr
dn1 = nz(dn[1], dn)
dn := close[1] < dn1 ? math.min(dn, dn1) : dn


//Compute the Trend Stream +1/-1
trend = 1
trend := nz(trend[1], trend)
trend := trend == -1 and close > dn1 ? 1 : trend == 1 and close < up1 ? -1 : trend

//Create Stoploss for Longs
upPlot = plot(trend == 1 ? up : na, title='Up Trend', style=plot.style_linebr, linewidth=2, color=color.new(color.green, 0))
//buy_a = close > upPlot
//Buy Signal
buy_3 = trend == 1 and trend[1] == -1

plotshape(buy_3 ? up : na, title='Go Long', location=location.absolute, style=shape.circle, size=size.tiny, color=color.new(color.green, 0))

dnPlot = plot(trend == 1 ? na : dn, title='Down Trend', style=plot.style_linebr, linewidth=2, color=color.new(color.red, 0))
//sell_a = close < dnPlot
//Sell Signal
sell_3 = trend == -1 and trend[1] == 1

plotshape(sell_3 ? dn : na, title='Go Short', location=location.absolute, style=shape.circle, size=size.tiny, color=color.new(color.red, 0))
// //paraboloic sar
// start = input(0.02)
// increment = input(0.02)
// maximum = input(0.2, 'Max Value')
// out = ta.sar(start, increment, maximum)


buy_4 = ema1 > ema2
//buy_4 = buy1 and not buy1[1]
//plotshape(buy_4 , color = color.green , text = "Buy" , location = location.belowbar , textcolor = color.white , style = shape.labelup , size = size.small)
sell_4 = close < ema2
//sell_4 = sell1 and not sell1[1]
//plotshape(sell_4, color = color.red , text = "Sell" , location = location.abovebar , textcolor = color.white , style = shape.labeldown , size = size.small)
plot(ema1, 'ema1', color=color.new(color.green, 0), linewidth=2)
plot(ema2, 'ema2', color=color.new(color.red, 0), linewidth=2)

// rsi
lenr = input(14, title='Rsi Period')
rs = ta.rsi(close, lenr)

over_sold = input(44)
over_bought = input(56)

buy_5 = rs > over_bought
sell_5 = rs < over_sold
// macd
slow_len_macd = input.int(12)
fast_len_macd = input.int(26)
signal_len_macd = input.int(9)

ema3 = ta.ema(close , slow_len_macd)
ema4 = ta.ema(close , fast_len_macd)
ema5 = ta.ema(close , signal_len_macd)

buy_6 = ema5 > ema4
sell_6 = ema5 < ema4

// adx
adxlen = input(14, title="ADX Smoothing")
dilen = input(14, title="DI Length")
dirmov(len) =>
	up = ta.change(high)
	down = -ta.change(low)
	plusDM = na(up) ? na : (up > down and up > 0 ? up : 0)
	minusDM = na(down) ? na : (down > up and down > 0 ? down : 0)
	truerange = ta.rma(ta.tr, len)
	plus = fixnan(100 * ta.rma(plusDM, len) / truerange)
	minus = fixnan(100 * ta.rma(minusDM, len) / truerange)
	[plus, minus]
adx(dilen, adxlen) =>
	[plus, minus] = dirmov(dilen)
	sum = plus + minus
	adx = 100 * ta.rma(math.abs(plus - minus) / (sum == 0 ? 1 : sum), adxlen)
sig = adx(dilen, adxlen)
//plot(sig, color=color.red, title="ADX")
adx_Greater_than = input.int(25)

signal = sig > adx_Greater_than
// volume ema
volume_ema = input.int(10)

vema = ta.ema(volume,volume_ema)

signal_2 = volume > vema


//define buy sell
g = buy_1 and buy_2 and buy_4 and trend == 1 and buy_5 and buy_6 and signal and signal_2 and window()
r = sell_1 and sell_2 and sell_4 and trend == -1 and sell_5 and sell_6 and signal and signal_2 and window()

rg = 0
rg := r ? 1 : g ? 2 : nz(rg[1])

buy11 = 0
buy11 := r ? 0 : g ? 1 : nz(buy11[1])
sell11 = 0
sell11 := r ? 1 : g ? 0 : nz(sell11[1])

buy = buy11 and not buy11[1]
sell = sell11 and not sell11[1]
multiple_signals = input(true)

if multiple_signals
    buy := g and not g[1] and  window()
    sell := r and not r[1] and  window()
    sell
else
    buy := buy and window()
    sell := sell and window()
    sell


//plotshape(long  , color = color.green , text = "Buy" , location = location.belowbar , textcolor = color.white , style = shape.labelup , size = size.small)
//plotshape(short   , color = color.red , text = "Sell" , location = location.abovebar , textcolor = color.white , style = shape.labeldown , size = size.small)
Stop = input(0.5, title='StopLoss') / 100

ProfitPerc = input(defval=1.5, title='Profit') / 100

rev = input(1024,title = "Reverse Limit")

Averaging_position_ = input(true , title = "Averaging position ? ")

qn = 1
qn := nz(qn[1])


long_short = 0
long_last = buy and (nz(long_short[1]) == 0 or nz(long_short[1]) == -1)
short_last = sell and (nz(long_short[1]) == 0 or nz(long_short[1]) == 1)
long_short := long_last ? 1 : short_last ? -1 : long_short[1]

long_entered = false
long_entered := long_entered[1]

short_entered = false
short_entered := short_entered[1]


longPrice = ta.valuewhen(long_last, close, 0)
shortPrice = ta.valuewhen(short_last, close, 0)


longStop = longPrice * (1 - Stop)
shortStop = shortPrice * (1 + Stop)
longTake = longPrice * (1 + ProfitPerc)
shortTake = shortPrice * (1 - ProfitPerc)
plot(long_short == 1 ? longStop : na, style=plot.style_linebr, color=color.new(color.red, 0), linewidth=1, title='Long Fixed SL')
plot(long_short == -1 ? shortStop : na, style=plot.style_linebr, color=color.new(color.red, 0), linewidth=1, title='Short Fixed SL')
plot(long_short == 1 ? longTake : na, style=plot.style_linebr, color=color.new(color.navy, 0), linewidth=1, title='Long Fixed TP')


plot(long_short == -1 ? shortTake : na, style=plot.style_linebr, color=color.new(color.navy, 0), linewidth=1, title='Short Fixed TP')


longBar1 = ta.barssince(long_last)
longBar2 = longBar1 >= 1 ? true : false
shortBar1 = ta.barssince(short_last)
shortBar2 = shortBar1 >= 1 ? true : false

longSLhit = long_short == 1 and longBar2 and low < longStop

if long_entered and sell
    longSLhit := true
    longSLhit

plotshape(longSLhit and not(sell and not short_entered and long_entered), style=shape.labelup, location=location.belowbar, color=color.new(color.gray, 0), size=size.tiny, title='Stop Loss', text='Long SL', textcolor=color.new(color.white, 0))
shortSLhit = long_short == -1 and shortBar2 and high > shortStop


if short_entered and buy
    shortSLhit := true
    shortSLhit

plotshape(shortSLhit and not(buy and not long_entered and short_entered), style=shape.labeldown, location=location.abovebar, color=color.new(color.gray, 0), size=size.tiny, title='Stop Loss', text='Short SL', textcolor=color.new(color.white, 0))


longTPhit = long_short == 1 and longBar2 and high > longTake
plotshape(longTPhit, style=shape.labeldown, location=location.abovebar, color=color.new(color.navy, 0), size=size.tiny, title='Target', text='Long TP', textcolor=color.new(color.white, 0))
shortTPhit = long_short == -1 and shortBar2 and low < shortTake
plotshape(shortTPhit, style=shape.labelup, location=location.belowbar, color=color.new(color.navy, 0), size=size.tiny, title='Target', text='Short TP', textcolor=color.new(color.white, 0))

long_short := (long_short == 1 or long_short == 0) and longBar2 and (longSLhit or longTPhit) ? 0 : (long_short == -1 or long_short == 0) and shortBar2 and (shortSLhit or shortTPhit) ? 0 : long_short

if(shortSLhit or longSLhit or (long_entered[1] and sell) or (short_entered[1] and buy ))
    qn := qn*2

if(longTPhit or shortTPhit or qn > rev)
    qn := 1

if Averaging_position_
    qn := 1

plotshape(buy and not long_entered, color=color.new(color.green, 0), style=shape.labelup, text='Buy', textcolor=color.new(color.white, 0), location=location.belowbar)
plotshape(sell and not short_entered, color=color.new(color.red, 0), style=shape.labeldown, text='Sell', textcolor=color.new(color.white, 0), location=location.abovebar)


// plotshape(buy and not(long_entered) and (short_entered), color = color.green , style = shape.labelup , text = "FA Buy" , textcolor = color.white , location = location.belowbar)
// plotshape(sell and not(short_entered)  and (long_entered), color = color.red , style = shape.labeldown , text = "FA Sell" , textcolor = color.white , location = location.abovebar)


// alertcondition(condition=buy and  not(long_entered)  and (short_entered), title="Fully Algo Buy")
// alertcondition(condition=sell and  not(short_entered)  and (long_entered), title="Fully Algo sell")

alertcondition(condition=buy and not long_entered, title='Buy')
alertcondition(condition=sell and not short_entered, title='Sell')

if long_last
    long_entered := true
    short_entered := false
    short_entered
if short_last
    short_entered := true
    long_entered := false
    long_entered

alertcondition(condition=longSLhit and not(sell and not short_entered and long_entered), title='Long SL')
alertcondition(condition=shortSLhit and not(buy and not long_entered and short_entered), title='Short SL')

alertcondition(condition=longTPhit, title='Long TP')
alertcondition(condition=shortTPhit, title='Short TP')

if longSLhit or longTPhit
    long_entered := false
    long_entered

if shortSLhit or shortTPhit
    short_entered := false
    short_entered

// if buy
//     strategy.entry('buy', strategy.long)
//     strategy.exit('exit', 'buy', limit=longTake, stop=longStop)


// if sell
//     strategy.entry('sell', strategy.short)
//     strategy.exit('exit', 'sell', limit=shortTake, stop=shortStop)
if(buy)
    strategy.entry("buy",strategy.long,qty = qn)
    strategy.exit("Stop","buy",limit = longTake,stop = longStop)

if(sell)
    strategy.entry("sell",strategy.short,qty = qn)
    strategy.exit("Stop","sell",limit = shortTake,stop = shortStop)

strategy.close("buy",when =  longTPhit or sell or longSLhit, comment = "Target")
strategy.close("sell",when =  shortSLhit or shortTPhit or buy , comment = "Stop Loss")

strategy.cancel("buy",when =  longTPhit or sell or longSLhit)
strategy.cancel("sell",when =  shortSLhit or shortTPhit or buy )