ملٹی پیریڈ MACD اشارے تجارتی حکمت عملی
جائزہ
یہ حکمت عملی کلاسیکی MACD اشارے پر مبنی ہے ، جبکہ اس میں متعدد معاون فیصلے شامل ہیں جیسے رجحان کا تعین کرنے والے اشارے ، روکنے اور روکنے کے طریقوں ، تاکہ ایک نسبتا complete مکمل رجحان سے باخبر رہنے والی تجارتی حکمت عملی تشکیل دی جاسکے۔ یہ ڈیجیٹل کرنسی کے ساتھ ساتھ غیر ملکی کرنسی اور اسٹاک ٹریڈنگ کے لئے بھی استعمال کیا جاسکتا ہے۔
حکمت عملی کا اصول
MACD اشارے فیصلہ
- FASTLENGTH EMA اور SLOWLENGTH EMA کے درمیان فرق MACD کالم بناتا ہے
- MACDLENGTH مدت EMA ہموار MACD کالم MACD لائنوں کی تشکیل
- MACD کالم 0 محور کو توڑ کر خرید و فروخت کا اشارہ دیتا ہے
رجحانات کا تعین
- ADX: اوسط رجحان کا اشارہ ، رجحان کا تعین کرنے کے لئے
- ایم اے: قیمتیں ایم اے کے اوپر اور نیچے کی طرف بڑھتی ہوئی حرکت پذیر اوسط
- SAR: پیرالائین SAR ، SAR قیمتوں میں اوپر اور نیچے منتقل ہونے کا فیصلہ کرتا ہے
نقصان کو روکنے کے طریقے
- اے ٹی آر فیصد سٹاپ: اے ٹی آر فیکٹر کے مطابق فیصد سٹاپ سیٹ کریں
- SAR سٹاپ: پیراول لائن بطور اننگز کے بعد سٹاپ
روک تھام کا طریقہ
- اے ٹی آر فکسڈ اسٹاپ فاصلہ: اے ٹی آر فیکٹر کے مطابق فکسڈ اسٹاپ فاصلہ سیٹ کریں
- فی صد روک: فی صد روک فاصلے سیٹ کریں
وقت کا ضیاع
- مقررہ تعداد کے بعد سٹاپ نقصان
طاقت کا تجزیہ
متعدد معاون فیصلے
- رجحانات اور مزاحمت کے فیصلوں کے ساتھ مل کر ، جعلی سگنل کو کم کیا جاسکتا ہے
- اے ٹی آر / ایس اے آر نقصانات کو روکنے اور خطرے پر قابو پانے کے لئے
لچکدار ترتیب
- رجحانات کو فلٹر کرنے کا اختیار
- اختیاری اے ٹی آر یا ایس اے آر سٹاپ نقصان
- ATR یا سٹینڈرڈ سٹاپ کے لئے اختیاری
- پیرامیٹرز لچکدار ترتیب
ریٹرننگ تجزیہ فراہم کرنا
- تاریخ کے مثبت اور منفی اثرات
- متن کی تجاویز
ایڈجسٹمنٹ کو بہتر بنانے کے لئے
- پالیسی بلٹ میں بہت سی قابل ترتیب پیرامیٹرز
- مختلف متغیرات کے مجموعے کی جانچ کرنا آسان ہے
خطرے کا تجزیہ
غلط پیرامیٹرز نقصان کو بڑھا سکتے ہیں
- ATR، SAR پیرامیٹرز کی غلط ترتیب، ممکنہ طور پر جلد ہی روکنے کے لئے
- اسٹاپ کا تناسب بہت بڑا ہے ، اور یہ جلد ہی بند ہوسکتا ہے
رجحانات کا اندازہ لگانے میں ناکامی کا خطرہ
- ٹرینڈ انڈیکس پیرامیٹرز کو غلط استعمال کرنا غلطی کا باعث بن سکتا ہے
- غیر متوقع واقعات کے رجحانات کا اندازہ لگانا
ٹائم سٹاپ خطرہ
- فکسڈ ٹائم اسٹاپ نقصان کا خطرہ ہے
اصلاح کی سمت
- اے ٹی آر، ایس اے آر پیرامیٹرز کو ایڈجسٹ کریں تاکہ نقصانات کو ہموار کیا جاسکے
- مختلف ایم اے سائیکلوں کی جانچ اور رجحانات کا اندازہ لگانا
- ٹیسٹ کو روکنے کے تناسب کو ایڈجسٹ کرنے، منافع کو بہتر بنانے کے
- اتار چڑھاؤ کے اشارے کے ساتھ مل کر اصلاحی پیرامیٹرز
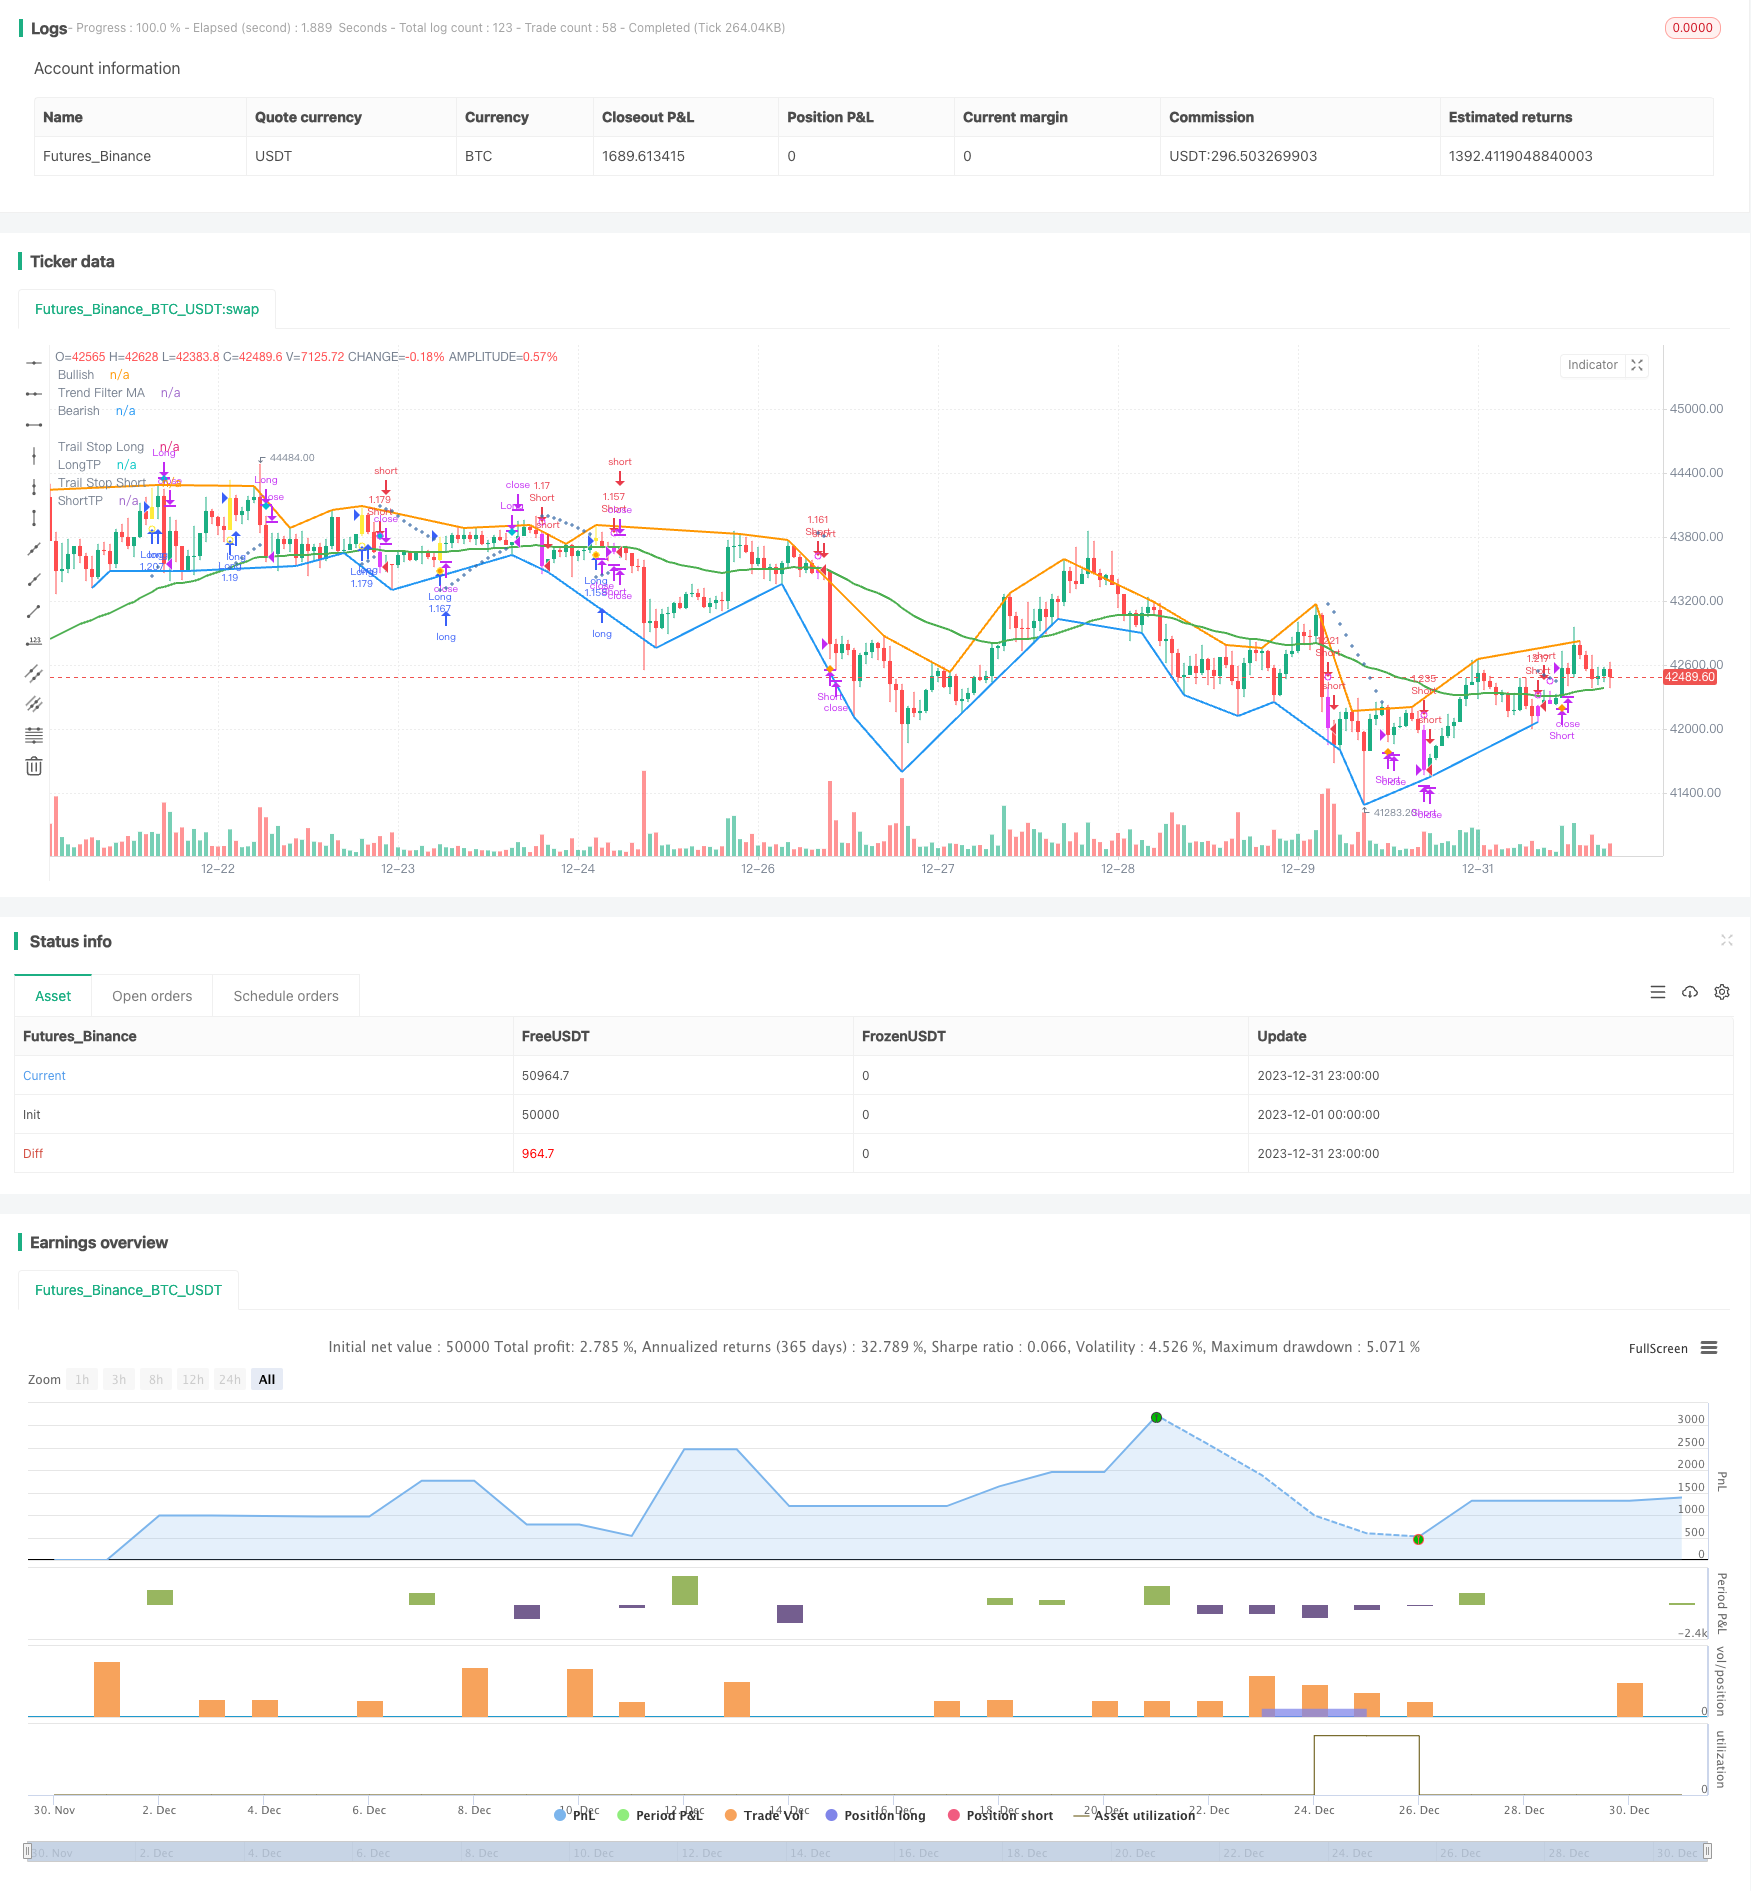
خلاصہ کریں۔
اس حکمت عملی کے مجموعے میں رجحان کا فیصلہ ، اسٹاپ نقصان اور ریڈمیشن کی شناخت جیسے متعدد پہلوؤں کو مدنظر رکھا گیا ہے ، تاکہ ایک نسبتا comprehensive جامع ڈیجیٹل کرنسی ٹریڈنگ حکمت عملی تشکیل دی جاسکے۔ اس میں MACD اشارے کے فوائد کو شامل کیا گیا ہے ، جس سے رجحان کی فلٹرنگ میں اضافہ کیا گیا ہے ، تاکہ غلط تجارت سے بچایا جاسکے۔ اے ٹی آر / ایس اے آر کی روک تھام میں اضافہ کیا گیا ہے ، تاکہ خطرے کو بہتر طور پر کنٹرول کیا جاسکے۔ ریڈمیشن کی شناخت اضافی حوالہ فراہم کرتی ہے۔ متعدد قابل ترتیب پیرامیٹرز ، جن کی جانچ اور اصلاح آسانی سے کی جاسکتی ہے۔ مجموعی طور پر ، یہ حکمت عملی ڈیجیٹل کرنسی حکمت عملی کے مطالعے کی ایک اچھی مثال ہوسکتی ہے۔
/*backtest
start: 2023-12-01 00:00:00
end: 2023-12-31 23:59:59
period: 1h
basePeriod: 15m
exchanges: [{"eid":"Futures_Binance","currency":"BTC_USDT"}]
*/

// This source code is subject to the terms of the Mozilla Public License 2.0 at https://mozilla.org/MPL/2.0/
// © systemalphatrader

//@version=4

strategy(title="MACD+ Strategy [SystemAlpha]", shorttitle="MACD+ Strategy [SA]", overlay=true, initial_capital=10000, currency='USD',
   default_qty_type=strategy.percent_of_equity, default_qty_value=100, commission_type=strategy.commission.percent, commission_value=0.04)

// == MAIN INPUT ==
// TREND FILTER
// Make input option to configure trend filter
trendFilter  = input(title="Trend Filter", defval='MA', options=['ADX', 'MA', 'SAR', 'All', 'None'])

// Translate input into trend filters
useADXFilter    = (trendFilter == 'ADX') or (trendFilter == 'All')
useSARFilter    = (trendFilter == 'SAR') or (trendFilter == 'All')
useMAFilter     = (trendFilter == 'MA') or (trendFilter == 'All')

// TRAIL STOP
// Make input option to configure trail stop
trailStop       = input(title="Trailing Stop Loss", defval='SAR', options=['ATR', 'SAR', 'None'])

// Translate input
useATRStop      = (trailStop == 'ATR')
useSARStop      = (trailStop == 'SAR')

// TAKE PROFIT TARGET
// Make input option to configure trail stop
TPtarget       = input(title="Take Profit Type", defval='ATR', options=['ATR', 'Percent', 'None'])

// Translate input
useATRTP        = (TPtarget == 'ATR')
usePercentTP    = (TPtarget == 'Percent')

// ALERTS and BAR COLOR
// Make input option to configure alerts
alerts          = input(title="Select Alerts to Display", defval='None', options=['Buy/Sell', 'Exit', 'Both', 'None'])

// Translate input
showsignals     = (alerts == 'Buy/Sell') or (alerts == 'Both')
showexitsignals = (alerts == 'Exit') or (alerts == 'Both')
showBarColor    = input(true, title="Show Bar Color")

// == /MAIN INPUT  ==

/////////////////////////////////////
//*STRATEGY LOGIC                 *//
/////////////////////////////////////

// == MACD ==
fastLength = input(12, title="Fast Length")
slowlength = input(26, title="Slow Length")
MACDLength = input(9, title="MACD Length")

MACD = ema(close, fastLength) - ema(close, slowlength)
aMACD = ema(MACD, MACDLength)
delta = MACD - aMACD

// Calc breakouts
break_up        = crossover(delta, 0)
break_down      = crossunder(delta,0)
// == /MACD ==

// == DIVERGENCE ==
method      = input(title="Divergence Method", defval='Hist', options=['Hist', 'MACD'])
divtype     = input(title="Divergence Type", defval='None', options=['Regular', 'Hidden', 'Both', 'None'])
uReg        = divtype == 'Regular' or divtype == 'Both'
uHid        = divtype == 'Hidden' or divtype == 'Both'
showlabel   = input(true, title="Show Divergence Label")
v_show_last = input(500, "Plotting Lookback Bars Length")

high_src = high
low_src  = low

//  ||  Functions:
f_top_fractal(_src) =>
    _src[4] < _src[2] and _src[3] < _src[2] and _src[2] > _src[1] and
       _src[2] > _src[0]
f_bot_fractal(_src) =>
    _src[4] > _src[2] and _src[3] > _src[2] and _src[2] < _src[1] and
       _src[2] < _src[0]
f_fractalize(_src) =>
    f_bot_fractal__1 = f_bot_fractal(_src)
    f_top_fractal(_src) ? 1 : f_bot_fractal__1 ? -1 : 0
// === End of Functions

//  ||  Method selection
oscilator_high = float(na)
oscilator_low = float(na)
if method == 'MACD'
    oscilator_high := MACD
    oscilator_low := MACD
if method == 'Hist'
    oscilator_high := delta
    oscilator_low := delta
//
fractal_top = f_fractalize(oscilator_high) > 0 ? oscilator_high[2] : na
fractal_bot = f_fractalize(oscilator_low) < 0 ? oscilator_low[2] : na

high_prev   = valuewhen(fractal_top, oscilator_high[2], 0)[2]
high_price  = valuewhen(fractal_top, high[2], 0)[2]
low_prev    = valuewhen(fractal_bot, oscilator_low[2], 0)[2]
low_price   = valuewhen(fractal_bot, low[2], 0)[2]

regular_bearish_div = fractal_top and high[2] > high_price and oscilator_high[2] < high_prev
hidden_bearish_div  = fractal_top and high[2] < high_price and oscilator_high[2] > high_prev
regular_bullish_div = fractal_bot and low[2] < low_price and oscilator_low[2] > low_prev
hidden_bullish_div  = fractal_bot and low[2] > low_price and oscilator_low[2] < low_prev

// Plotting
plot(title='Bullish', series=fractal_top ? high[2] : na, color = regular_bearish_div and uReg or hidden_bearish_div and uHid ? color.red : na, linewidth = 2, transp=50, offset=-2, show_last = v_show_last)
plot(title='Bearish', series=fractal_bot ? low[2] : na, color = regular_bullish_div and uReg or hidden_bullish_div and uHid ? color.green : na, linewidth = 2, transp=50, offset=-2, show_last = v_show_last)

plotshape(title='Regular Bearish', series=not showlabel or not uReg ? na : regular_bearish_div ? high[2] : na, text='R', style=shape.labeldown, location=location.absolute, color=color.red, textcolor=color.white, transp=50, offset=-2, show_last = v_show_last)
plotshape(title='Hidden Bearish', series=not showlabel or not uHid ? na : hidden_bearish_div ? high[2] : na, text='H', style=shape.labeldown, location=location.absolute, color=color.red, textcolor=color.white, transp=80, offset=-2, show_last = v_show_last)
plotshape(title='Regular Bullish', series=not showlabel or not uReg ? na : regular_bullish_div ? low[2] : na, text='R', style=shape.labelup, location=location.absolute, color=color.green, textcolor=color.white, transp=50, offset=-2, show_last = v_show_last)
plotshape(title='Hidden Bullish', series=not showlabel or not uHid ? na : hidden_bullish_div ? low[2] : na, text='H', style=shape.labelup, location=location.absolute, color=color.green, textcolor=color.white, transp=80, offset=-2, show_last = v_show_last)

// == /DIVERGENCE ==

// == ENTRY ==
// == ADX FILTERING ==
// Look at ADX when it is above a user-defined key level (23 default) and this is to identify when it is trending.
// It then looks at the DMI levels.  If D+ is above D- and the ADX is sloping upwards and above the key level, it triggers a buy condition.  Opposite for short.
adxlen          = 13 //input(13, title="TF ADX Smoothing")
dilen           = 13 //input(13, title="TF DI Period")
keyLevel        = 23 //input(23, title="TF Keylevel for ADX")

// == USE BUILT-IN DMI FUNCTION TO DETERMINE ADX AND BULL/BEAR STRENGTH
[diplus, diminus, adx] = dmi(dilen, adxlen)

//Buy and Sell Filter
ADXBuyCheck     = useADXFilter? diplus > diminus : true
ADXSellCheck    = useADXFilter? diplus < diminus : true
// == /ADX FILTERING ==

// == MOVING AVERAGE FILTERING ==
// MA FILTER: Use a user-defined moving average to filter long/short if desried.
maType          = input(defval="EMA", options=["EMA", "SMA"], title = "TF MA Type")
maLength        = input(defval = 50, title = "TF MA Period", minval = 1)

// Declare function to be able to swap out EMA/SMA
ma(maType, src, length) =>
    maType == "EMA" ? ema(src, length) : sma(src, length)
maFilter        = ma(maType, close, maLength)

// Check to see if the useMaFilter check box is checked, this then inputs this conditional "maFilterCheck" variable into the strategy entry
maFilterCheck   = if useMAFilter == true
    maFilter
else
    close
// == /MOVING AVERAGE FILTERING ==

// == PARABOLIC SAR AS AN ENTRY and EXIT OPTION ==
// SAR FILTER: The Parabolic SAR (Stop and Reverse) is a time and price technical analysis tool primarily used to identify points of potential stops and reverses.
// Go long when is located below price (BULLISH) and go short when is located above price (BEARISH).
sarStart        = 0.04 //input(0.04, "SAR Start")
sarIncrement    = 0.02 //input(0.02, "SAR Increment")
sarMaximum      = 0.5 //input(0.5, "SAR Max Value")

htclose         = close
sarOut          = useSARFilter or useSARStop ? sar(sarStart, sarIncrement, sarMaximum) : na
Trend           = sarOut < htclose ? 1 : -1

//Buy and Sell Filter
sarBuyCheck     = useSARFilter? Trend == 1: true
sarSellCheck    = useSARFilter? Trend == -1: true

// Trigger stop based on High/Low
trigResistance  = high
trigSupport     = low

// Determine if price is above resistance or below support
sarResistanceHit    = close >= sarOut and useSARStop == true
sarSupportHit       = close <= sarOut and useSARStop == true
// == /PARABOLIC SAR AS AN ENTRY and EXIT OPTION ==

// == EXITS ==
// == ATR TRAILING STOPS ==
// The ATR % stop method can be used by any type of trader because the width of the stop is determined by the percentage of average true range (ATR).
// ATR is a measure of volatility over a specified period of time.
// Exit with ATR support/resistance is hit.
atrLookback     = 14 //input(defval=14,title="ATR Lookback Period",type=input.integer)
multiplier      = input(defval=2,title="ATR Trailing Stop Multiplier",type=input.float, step=0.1, minval=0.5, maxval=5)

// Calculate the trailing ATR
atrValue        = atr(atrLookback)
atrMultiplied   = atrValue * multiplier

// Plot the price plus or minus the ATR
atrLow          = low - atrMultiplied
atrHigh         = high + atrMultiplied

// Calculate both the low and high trailing ATRs every time. The low one never goes down, and the high one never goes up
// Set them to something to start with
trailAtrLow     = atrLow
trailAtrHigh    = atrHigh

// If the ATR Low has gone up AND it has gone above the trail, the low trailing ATR should also go up. If the ATR Low has gone up or down, but not below the trail, the ATR trail stays where it is
trailAtrLow     := na(trailAtrLow[1]) ? trailAtrLow : atrLow >= trailAtrLow[1] ? atrLow : trailAtrLow[1]
// Same for the High
trailAtrHigh    := na(trailAtrHigh[1]) ? trailAtrHigh : atrHigh <= trailAtrHigh[1] ? atrHigh : trailAtrHigh[1]

// Determine if price is above resistance or below support
atrResistanceHit    = trigResistance >= trailAtrHigh and useATRStop == true
atrSupportHit       = trigSupport <= trailAtrLow and useATRStop == true

// If price is above resistance or below support, reset the trailing ATR
trailAtrLow     := atrSupportHit ? atrLow : trailAtrLow
trailAtrHigh    := atrResistanceHit ? atrHigh : trailAtrHigh
// == /ATR TRAILING STOPS ==

// == INITIAL TP==
// ATR
tpmultiplier   = input(defval=3,title="ATR Take Profit Multiplier",type=input.float, step=0.1, minval=0.5, maxval=5)

ema = ema(close, atrLookback)
atr = rma(tr(true), atrLookback)

longATRTP     = ema + (atr * tpmultiplier)
shortATRTP    = ema - (atr * tpmultiplier)

// Determine if price is above resistance or below support
longATRTPHit    = high >= longATRTP and useATRTP == true
shortATRTPHit   = low <= shortATRTP and useATRTP == true

// STANDARD TAKE PROFIT %
// User Options to Change Inputs (%)
takePer = input(10, title='Take Profit %', type=input.float, step=0.1, minval=0.5, maxval=100) / 100

//fixed TP prices
longPercentTP   = ema * (1 + takePer)
shortPercentTP  = ema * (1 - takePer)

// Determine if price is above resistance or below support
longPercentTPHit    = high >= longPercentTP and usePercentTP == true
shortPercentTPHit   = low <= shortPercentTP and usePercentTP == true

// Set Stop and TP Values
buyStop     = trailStop == 'ATR'? trailAtrLow : trailStop == 'SAR'? sarOut : na
sellStop    = trailStop == 'ATR'? trailAtrHigh : trailStop == 'SAR'? sarOut : na
longTP      = TPtarget == 'ATR'? longATRTP : TPtarget == 'Percent'? longPercentTP : na
shortTP     = TPtarget == 'ATR'? shortATRTP : TPtarget == 'Percent'? shortPercentTP : na

// == /EXITS ==

// == PLOTTING ==
buySignal       = break_up and ADXBuyCheck and close >= maFilterCheck and sarBuyCheck
shortSignal     = break_down and ADXSellCheck and close <= maFilterCheck and sarSellCheck
sellSignal      = atrSupportHit or sarSupportHit or longPercentTPHit or longATRTPHit
coverSignal     = atrResistanceHit or sarResistanceHit or shortPercentTPHit or shortATRTPHit

//Set BarSince counter
barsSinceLong   = 0
barsSinceShort  = 0
barsSinceLong   := nz(barsSinceLong[1])
barsSinceShort  := nz(barsSinceShort[1])

//Plot Sell and Cover Signal
plotshape(not showexitsignals and sellSignal and barsSinceLong == 1? sellSignal : na, title="Sell Long", location=location.abovebar, style=shape.diamond, size=size.auto, color=color.aqua, transp=0, show_last = v_show_last, editable = false)
plotshape(not showexitsignals and coverSignal and barsSinceShort == 1 ? coverSignal : na, title="Cover Short", location=location.belowbar, style=shape.diamond, size=size.auto, color=color.orange, transp=0, show_last = v_show_last, editable = false)
plotshape(showexitsignals and sellSignal and barsSinceLong == 1? sellSignal : na, title="Close Long Text", location=location.abovebar, style=shape.diamond, size=size.auto, color=color.aqua, transp=0, show_last = v_show_last, textcolor=color.aqua, text = "Close\nLong", editable = false)
plotshape(showexitsignals and coverSignal and barsSinceShort == 1 ? coverSignal : na, title="Cover Short Text", location=location.belowbar, style=shape.diamond, size=size.auto, color=color.orange, transp=0, show_last = v_show_last, textcolor=color.orange, text = "Cover\nShort", editable = false)

// Reset BarSince counter
if buySignal
    barsSinceLong := 1
    barsSinceShort := 0
if shortSignal
    barsSinceShort := 1
    barsSinceLong := 0
if sellSignal
    barsSinceLong := 0
if coverSignal
    barsSinceShort := 0

// Show bar color
barcolor(showBarColor? (buySignal or shortSignal ? (shortSignal ? color.fuchsia : color.yellow) : na) : na)

// Plot Buy Alerts
plotshape(buySignal ? buySignal : na, title="Breakout Up", location=location.belowbar, style=shape.circle, size=size.auto, color=color.yellow, transp=0, editable = false)
plotshape(showsignals and buySignal, title= "Long", color=color.green, style=shape.labelup, location=location.belowbar, size=size.auto, show_last = v_show_last, text = "BUY", textcolor=color.white, editable = false)

// Plot Sell Alerts
plotshape(shortSignal ? shortSignal : na, title="Breakout Down", location=location.abovebar, style=shape.circle, size=size.auto, color=color.fuchsia, transp=0, editable = false)
plotshape(showsignals and shortSignal, title= "Short", color=color.red, style=shape.labeldown, location=location.abovebar, size=size.auto, show_last = v_show_last, text = "SELL", textcolor=color.white, editable = false)

// Plot MA Trend Filter
plot(useMAFilter? maFilter : na, title = "Trend Filter MA", color = color.green, linewidth = 2, style = plot.style_line, transp = 20, editable = true)

// Plot Initial Stop
plot(trailStop != 'None' and barsSinceLong >= 1? buyStop : na, color=#3A6CA8, title="Trail Stop Long", style = plot.style_cross, linewidth = 1, transp = 20, editable = true)
plot(trailStop != 'None' and barsSinceShort >= 1? sellStop : na, color=#3A6CA8, title="Trail Stop Short", style = plot.style_cross, linewidth = 1, transp = 20, editable = true)

// Plot Initial Target Profit
plot(TPtarget != 'None' and buySignal? longTP : na, color=color.green, title="LongTP", style = plot.style_linebr, linewidth = 1, editable = false)
plot(TPtarget != 'None' and shortSignal? shortTP : na, color=color.green, title="ShortTP", style = plot.style_linebr, linewidth = 1, editable = false)

// == /PLOTTING ==

// == ALERTS ==
// Buy and Sell Signal
alertcondition(buySignal, title='MACD Long', message='MACD {{exchange}}:{{ticker}} TF: {{interval}}. LONG (TRADE). ENTRY: {{close}}, Target Profit: {{plot("LongTP")}}, STOP LOSS: {{plot("Trail Stop Long")}}')
alertcondition(shortSignal, title='MACD Short', message='MACD {{exchange}}:{{ticker}} TF: {{interval}}. SHORT (TRADE). ENTRY: {{close}}, Target Profit: {{plot("ShortTP")}}, STOP LOSS: {{plot("Trail Stop Short")}}')
alertcondition(sellSignal, title='MACD Close Long', message='MACD {{exchange}}:{{ticker}} Close Long, Price = {{close}}')
alertcondition(coverSignal, title='MACD Cover Short', message='MACD {{exchange}}:{{ticker}} Cover Short, Price = {{close}}')
alertcondition(sellSignal or coverSignal, title="MACD Close Orders", message="{{ticker}} Close Orders")

// Initial SL and TP Hit
stophit = low <= buyStop or high >= sellStop
tphit   = low <= shortTP or high >= longTP
alertcondition(stophit, title='MACD SL Hit', message='MACD {{exchange}}:{{ticker}} Stop Loss Hit, Price = {{close}}')
alertcondition(tphit, title='MACD TP Hit', message='MACD {{exchange}}:{{ticker}} Target Profit Hit, Price = {{close}}')

//Divergence Alerts
alertcondition(regular_bullish_div, title='MACD Bullish Divergence', message='MACD Regular Bullish Divergence')
alertcondition(regular_bearish_div, title='MACD Bearish Divergence', message='MACD Regular Bearish Divergence')
alertcondition(hidden_bullish_div, title='MACD Hidden Bullish Divergence', message='MACD Hidden Bullish Divergence')
alertcondition(hidden_bearish_div, title='MACD Hidden Bearish Divergence', message='MACD Hidden Bearish Divergence')
// == /ALERTS ==

//////////////////////////
//* STRATEGY COMPONENT *//
//////////////////////////

// === BACKTEST RANGE ===
From_Year   = input(defval = 2017, title = "BACKTEST: From Year")
From_Month  = input(defval = 1, title = "BACKTEST: From Month", minval = 1, maxval = 12)
From_Day    = input(defval = 1, title = "BACKTEST: From Day", minval = 1, maxval = 31)
To_Year     = input(defval = 9999, title = "BACKTEST: To Year")
To_Month    = input(defval = 1, title = "BACKTEST: To Month", minval = 1, maxval = 12)
To_Day      = input(defval = 1, title = "BACKTEST: To Day", minval = 1, maxval = 31)
Start       = timestamp(From_Year, From_Month, From_Day, 00, 00)  // backtest start window
Finish      = timestamp(To_Year, To_Month, To_Day, 23, 59)        // backtest finish window

testPeriod() => true
// === /BACKTEST RANGE ===

// === STRATEGY ===
// Make input option to configure trade direction
tradeDirection = input(title="Trade Direction", defval="Both", options=["Long", "Short", "Both"])

// Translate input into trading conditions
longOK  = (tradeDirection == "Long") or (tradeDirection == "Both")
shortOK = (tradeDirection == "Short") or (tradeDirection == "Both")

// == STRATEGY ENTRIES/EXITS ==
timedExit   = input(title = "Use Timed Exit", type = input.bool, defval = true)
exitmethod  = input(title="Timed Exit Method", defval='3', options=['1', '2', '3'])
bse         = input(10, "Bar Since Entry") // Bars to exit after entry

barsSinceEntry  = 0
barsSinceEntry  := nz(barsSinceEntry[1]) + 1

longCondition = longOK and buySignal and testPeriod()
shortcondition = shortOK and shortSignal and testPeriod()

if strategy.position_size == 0
    barsSinceEntry := 0

// === STRATEGY - LONG POSITION EXECUTION ===
if longCondition
    strategy.entry("Long", strategy.long)
    barsSinceEntry := 0

// === STRATEGY - SHORT POSITION EXECUTION ===
if shortcondition
    strategy.entry("Short", strategy.short)
    barsSinceEntry := 0

// == STRATEGY EXITS ==
if sellSignal
    strategy.close("Long")
    barsSinceEntry := 0
if coverSignal
    strategy.close("Short")
    barsSinceEntry := 0

// Enable Timed Exit
// Exit after specified number of bars.
if timedExit and exitmethod == '1' and barsSinceEntry > bse
    strategy.close_all()
    barsSinceEntry := 0
// Exit after specified number of bars, ONLY if position is currently profitable.
if timedExit and exitmethod == '2' and strategy.openprofit > 0 and barsSinceEntry > bse
    strategy.close_all()
    barsSinceEntry := 0
// Exit after specified number of bars, ONLY if position is currently losing.
if timedExit and exitmethod == '3' and strategy.openprofit < 0 and barsSinceEntry > bse
    strategy.close_all()
    barsSinceEntry := 0
// === /STRATEGY ===
//EOF