RSI ٹرینڈ فالونگ سٹاپ لاس سٹریٹیجی
جائزہ
یہ ایک مقدار کی تجارت کی حکمت عملی ہے جس میں آر ایس آئی اشارے کا استعمال کیا جاتا ہے تاکہ رجحانات کا تعین کیا جاسکے اور اسٹاپ نقصان کا تعین کیا جاسکے۔ یہ حکمت عملی آر ایس آئی اشارے کے ساتھ مل کر مارکیٹ کی رجحانات کی سمت کا تعین کرتی ہے ، اور متحرک اسٹاپ نقصان کا تعین منافع کو مقفل کرنے کے لئے کرتی ہے تاکہ زیادہ سے زیادہ خطرہ کم کیا جاسکے۔
حکمت عملی کا اصول
یہ حکمت عملی بنیادی طور پر آر ایس آئی کے اشارے کی طرف سے مارکیٹ کے رجحان کی سمت کا فیصلہ کرنے کے لئے زیادہ کم کرنے کا فیصلہ کرتی ہے۔ جب آر ایس آئی اشارے پر کم بٹ لائن کو عبور کرتے ہیں تو اس کا فیصلہ کرتے ہیں کہ مارکیٹ عروج پر ہے ، زیادہ کریں۔ جب آر ایس آئی اشارے کے نیچے اعلی بٹ لائن کو عبور کرتے ہیں تو اس کا فیصلہ کرتے ہیں کہ مارکیٹ نیچے کی طرف ہے۔
اس کے علاوہ ، حکمت عملی ہر ایک کی پوزیشن کھولنے کی قیمت کو ٹریک کرکے فلوٹنگ اسٹاپ نقصان کا تعین کرتی ہے۔ متعدد اختیارات کے ل the ، پوزیشن کھولنے کی قیمت کا ایک خاص تناسب اسٹاپ نقصان کی لائن کے طور پر مقرر کیا جاتا ہے ، اور بیئرنگ کے ل the ، پوزیشن کھولنے کی قیمت کا ایک خاص تناسب اسٹاپ نقصان کی لائن کے طور پر مقرر کیا جاتا ہے۔ جب قیمت اسٹاپ نقصان کی حد کو چھوتی ہے تو حکمت عملی خود بخود پوزیشن کو روکنے یا روکنے کا کام کرتی ہے۔
اسٹریٹجک فوائد
- RSI اشارے کا استعمال مارکیٹ کے رجحانات کی سمت کا تعین کرنے کے لئے کیا جاتا ہے تاکہ تجارت کو بند کرنے کے وقفے سے بچایا جاسکے۔
- فلوٹنگ سٹاپ لاسٹ اسٹاپ سیٹ کریں ، جو منافع کو لچکدار طریقے سے لاک کرنے اور خطرے کو مؤثر طریقے سے کنٹرول کرنے کے قابل ہو۔
- آر ایس آئی پیرامیٹرز اور اسٹاپ لاس اسٹاپ تناسب کو بیرونی ان پٹ کے ذریعہ ایڈجسٹ اور بہتر بنایا جاسکتا ہے۔
اسٹریٹجک رسک
- RSI اشارے میں کچھ تاخیر ہوئی ہے اور ممکنہ طور پر قلیل مدتی رجحان کی تبدیلی سے محروم ہے۔
- سٹاپ نقصان کی روک تھام کی لائنز کے قریب سے زیادہ ممکنہ طور پر انخلا کی جا سکتی ہے.
اصلاح کی سمت
- RSI اشارے کے مختلف ادوار کے فیصلے کی جانچ پڑتال کی جا سکتی ہے؛
- بہترین سٹاپ نقصان اسٹاپ تناسب تلاش کرنے کے لئے مختلف پیرامیٹرز کے مجموعے کی جانچ کی جاسکتی ہے۔
- فلٹرنگ سگنل کا تعین کرنے کے لئے اضافی اشارے شامل کیے جا سکتے ہیں۔
خلاصہ کریں۔
یہ حکمت عملی مجموعی طور پر ایک مقداری تجارتی حکمت عملی ہے جس میں رجحانات کا سراغ لگانے کے لئے آر ایس آئی اشارے کا استعمال کیا جاتا ہے اور اس کے ساتھ فلوٹنگ اسٹاپ نقصان کی روک تھام کی جاتی ہے۔ یہ حکمت عملی خطرے کو کنٹرول کرنے میں بہتر کام کرتی ہے اور منافع کو مؤثر طریقے سے لاک کرنے کے لئے ایک واحد اشارے کی تجارت کی حکمت عملی کے مقابلے میں ہے۔ پیرامیٹرز کو بہتر بنانے اور معاون اشارے کے فیصلے کو شامل کرنے سے حکمت عملی کی کارکردگی کو مزید بہتر بنایا جاسکتا ہے۔
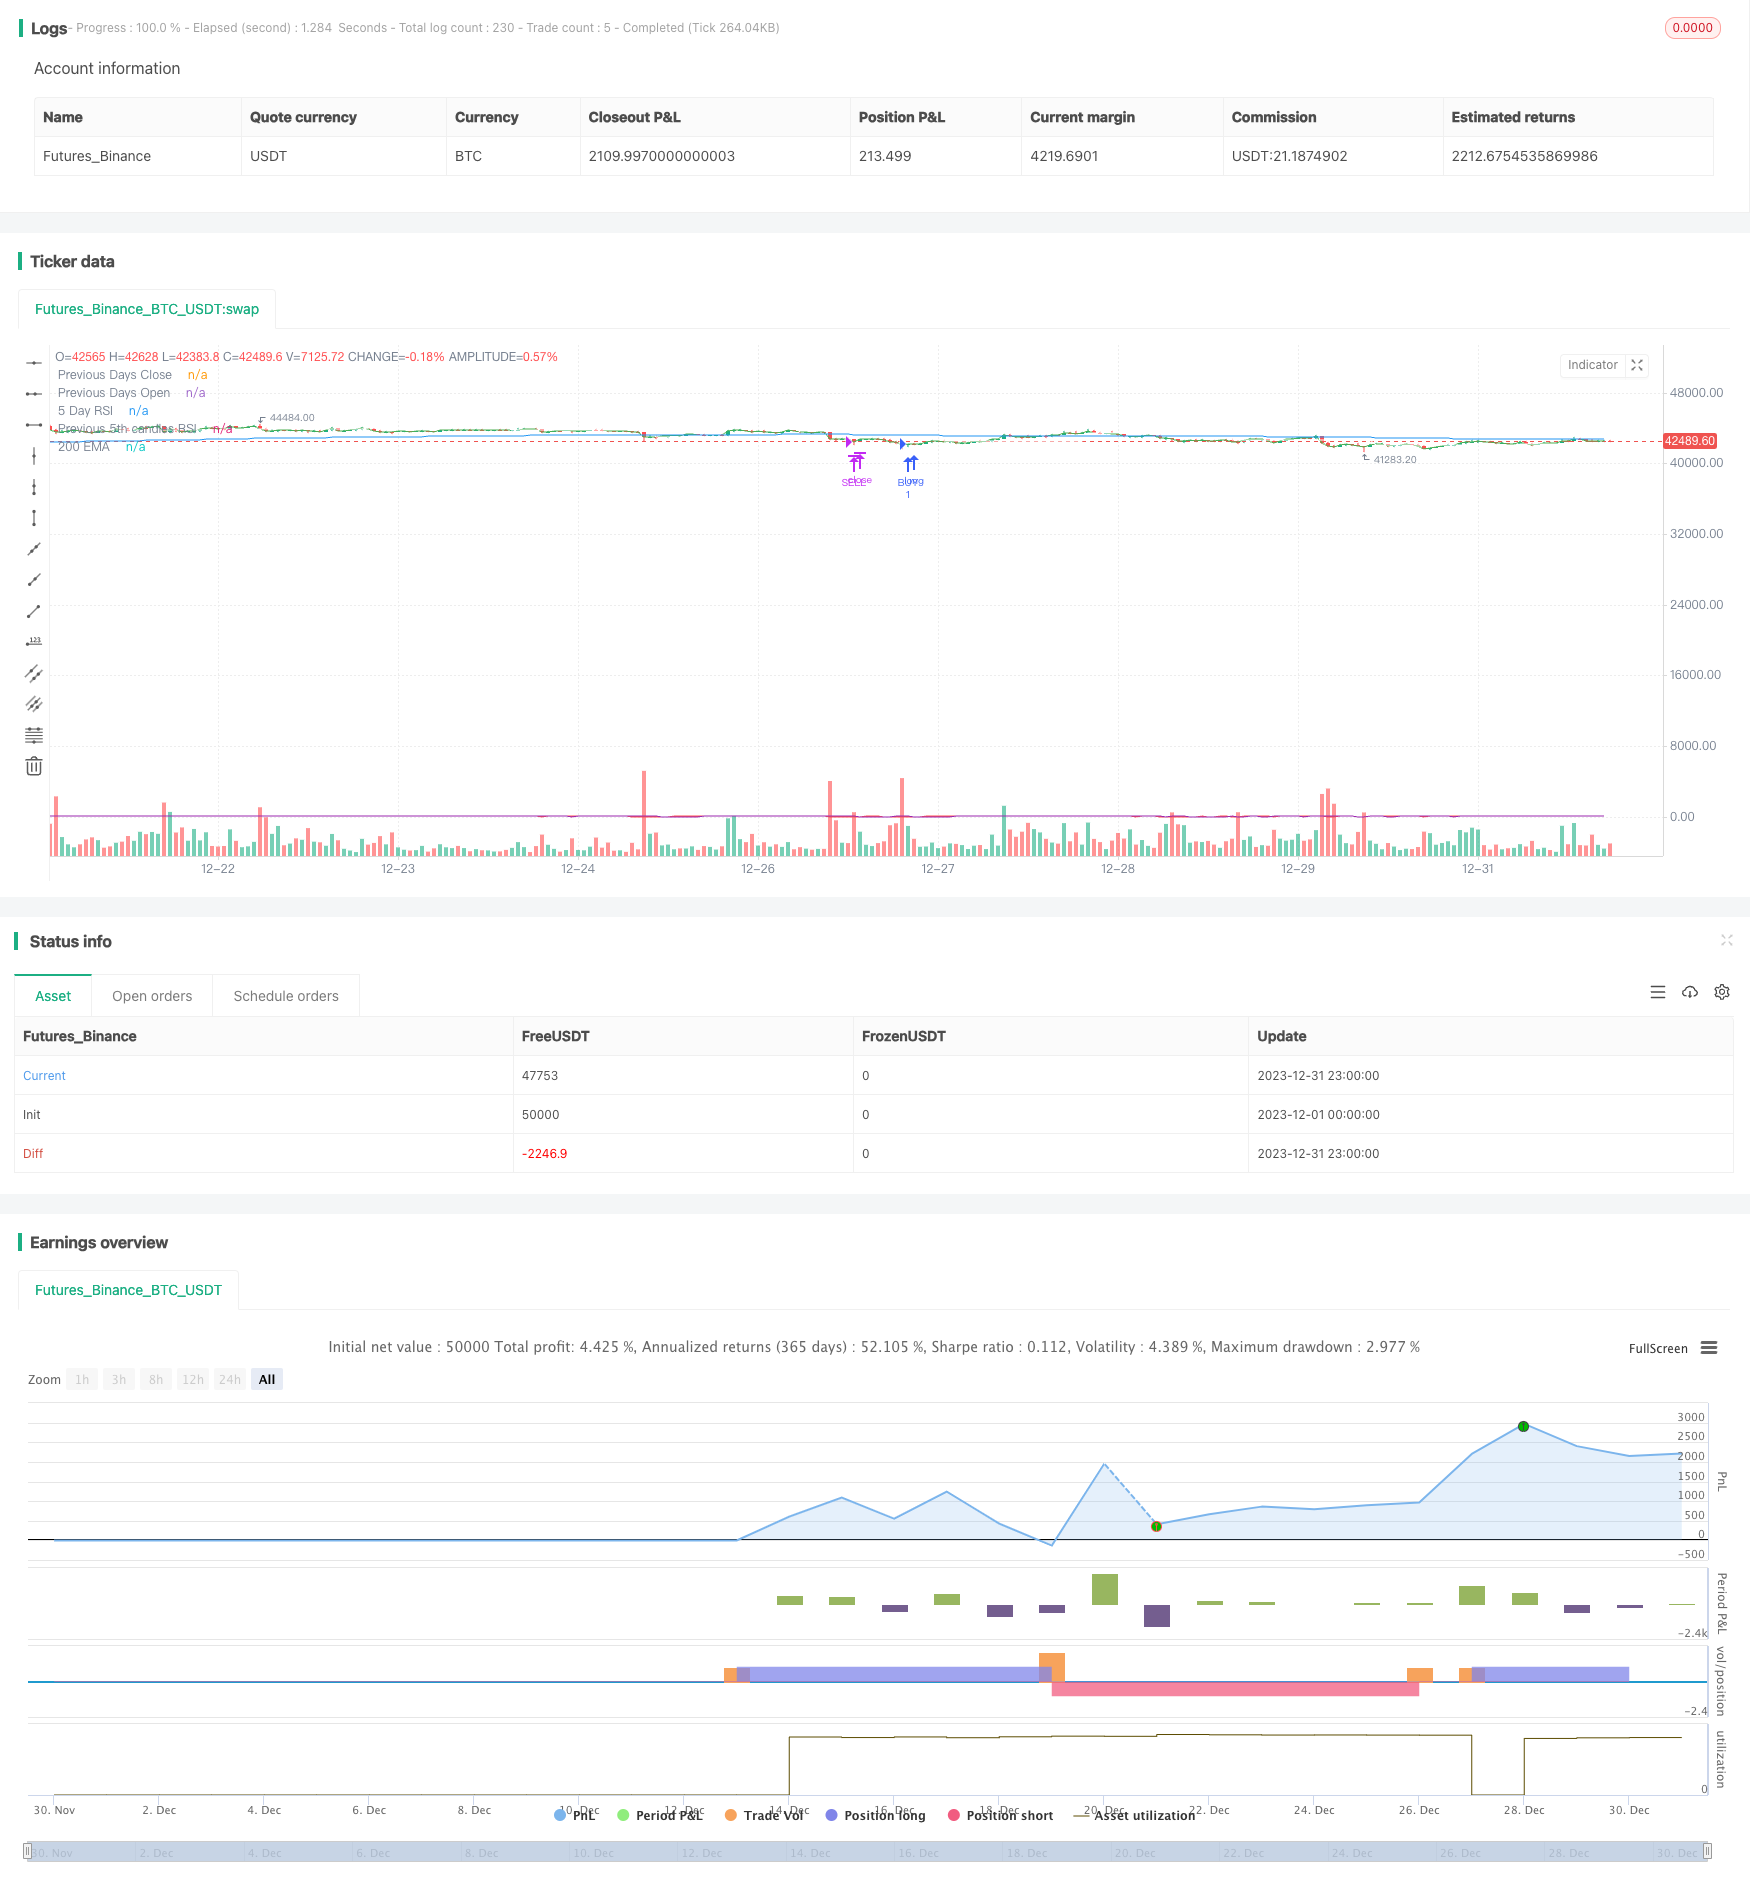
/*backtest
start: 2023-12-01 00:00:00
end: 2023-12-31 23:59:59
period: 1h
basePeriod: 15m
exchanges: [{"eid":"Futures_Binance","currency":"BTC_USDT"}]
*/

// This source code is subject to the terms of the Mozilla Public License 2.0 at https://mozilla.org/MPL/2.0/
// ©chewyScripts.

//@version=5
strategy("96er RSI+200EMA Strategy + Alerts", overlay=true, shorttitle = "The old 96er - RSI5 + 200 EMA")
//,use_bar_magnifier=false
// This works best on a small account $100, with 50% of equity and up to 10 max open trades.
// 96% Profitable, turns $100 into $350 in 1 month. very few losses. super happy with it.
// So far it triples the account on a 1m chart in 1 month back testing on the SEI-USD pair.
// I did not test on FX pairs or other instruments.
// had some issues with the inputs not working so had to hard code some, also the lastClose var sometimes breaks and starts following every candle, not sure why.

in_r1 = input.int(8,"5 day input or RSI1", group = "Signals")
in_lowerRSI = input.int(28,"RSI Lower", group = "Signals")
in_upperRSI = input.int(72,"RSI Upper ", group = "Signals")
in_emaperiod = input.int(200,"EMA Period", group = "Signals")
in_daysback = input.int(1,"Look back days for close/open", group = "Signals")

in_openOrders = input.int(5,"max open orders",tooltip = "Be careful, to high and you will get margin called!! 5 is probably the highest you should go", group = "Order Controls")
in_buybreakout = input.int(40,"Buy breakout range", group = "Order Controls")

in_buyTP = input.float(1.1500,"Buy TP: 1+TP %, .05 seems to work well.", group = "TPSL")
in_sellTP = input.float(0.9750, "Sell TP: 1-TP%. .025 seems to work well. ", group = "TPSL")

in_useAlerts = input.bool(false,"Turns on Buy/Sell Alerts",group = "Alerts")
in_useCustomAlertMSG = input.bool(false,"Use default Buy/Sell or the messages below",group = "Alerts")
in_alertBuySignalTxt = input("Buy","Buy signal API/TXT message template", tooltip = "Review the UserGuid on JSON varibles in alerts", group = "Alerts")
in_alertSellSignalTxt = input("Sell","Sell signal API/TXT message template", tooltip = "Review the UserGuid on JSON varibles in alerts", group = "Alerts")

simple int rsi5 = in_r1

// 3 rsi strategy , when all of them are overbought we sell, and vice versa
rsi7 = ta.rsi(close,rsi5)
[lastOpen, lastClose] = request.security(syminfo.tickerid, "D", [open,close], lookahead = barmerge.lookahead_on)
rsi3 = ta.rsi(close[5],rsi5)

ma = ta.ema(close,in_emaperiod)

plot(rsi7,"5 Day RSI",color.red)
plot(lastClose,"Previous Days Close",color.green)
plot(lastOpen,"Previous Days Open",color.white)
plot(rsi3,"Previous 5th candles RSI",color.purple)
plot(ma,"200 EMA",color.blue)


//sell = ta.crossunder(rsi7,70) and ta.crossunder(rsi14,70) and ta.crossunder(rsi21,70)
//buy = ta.crossover(rsi7,in_lowerRSI) and close < ma and rsi3 <= in_upperRSI and strategy.opentrades < in_openOrders
//sell = ta.crossunder(rsi7,in_upperRSI) and close > ma and rsi3 >= in_lowerRSI3 and strategy.opentrades < in_openOrders

//buy condition
buy = ta.crossover(rsi7,in_lowerRSI) and close < ma and close < lastClose and strategy.opentrades < in_openOrders

// sell condition
sell = ta.crossunder(rsi7,in_upperRSI) and close > ma and close > lastClose and strategy.opentrades < in_openOrders


var lastBuy = close
var lastSell = close
//var buyLabel = label.new(na,na,yloc = yloc.belowbar, style = label.style_none, textcolor = color.green, size = size.normal)
//var sellLabel = label.new(na,na,yloc = yloc.abovebar, style = label.style_none, textcolor = color.red, size = size.normal)
if (buy)
    strategy.entry("BUY", strategy.long,alert_message = "Buy @"+str.tostring(close))
    lastBuy := close
    //buyLabel := label.new(na,na,yloc = yloc.belowbar, style = label.style_none, textcolor = color.green, size = size.normal)
    //label.set_x(buyLabel,bar_index)
    //label.set_y(buyLabel,low)
    //label.set_text(buyLabel,"Buy!!@ " +str.tostring(lastBuy)  + "\n TP: " + str.tostring(lastBuy*in_buyTP) + "\n↑")
    if(not in_useAlerts)
        alert("Buy")

//label.delete(buyLabel)

if ((close >= lastBuy*in_buyTP ) or (rsi7 > in_buybreakout) and close >= lastClose and (close >= lastClose*in_buyTP or close >= lastBuy*in_buyTP ) )
    //label.new(bar_index,na,"TP!!@ " +str.tostring(close), yloc = yloc.abovebar, style = label.style_none, textcolor = color.green, size = size.normal)
    strategy.close("BUY", "BUY Exit",alert_message = "Buy Exit: TP @" +str.tostring(close) + " OR TP: " + str.tostring(lastBuy*in_buyTP))
    if(not in_useAlerts)
        alert("Buy Exit")

if (sell)
    strategy.entry("SELL", strategy.short, alert_message = "Sell @ " + str.tostring(close))
    lastSell := close
    //sellLabel := label.new(na,na,yloc = yloc.abovebar, style = label.style_none, textcolor = color.red, size = size.normal)
    //label.set_x(sellLabel,bar_index)
    //label.set_y(sellLabel,high)
    //label.set_text(sellLabel,"Sell!!@ " +str.tostring(lastSell)  + "\n TP: " + str.tostring(lastSell*in_sellTP) + "\n🠇")
    if(not in_useAlerts)
        alert("Sell")

//label.delete(sellLabel)

if ( close < ma and (close <= lastSell*in_sellTP ) or (close < lastClose*in_sellTP) )
    //label.new(bar_index,na,"TP!!@ " +str.tostring(close), yloc = yloc.belowbar, style = label.style_none, textcolor = color.red, size = size.normal)
    strategy.close("SELL", "Sell Exit", alert_message = "Sell Exit TP @" +str.tostring(close) + " OR TP: " + str.tostring(lastSell*in_sellTP))
    if(not in_useAlerts)
        alert("Sell Exit")


alertcondition(buy and in_useAlerts,"Buy Alert","test")