
اس حکمت عملی کا بنیادی خیال یہ ہے کہ بڑے ٹائم فریموں پر رجحانات کی سمت کی نشاندہی کی جائے اور چھوٹے ٹائم فریموں پر بریک آؤٹ پوائنٹس کو تلاش کیا جائے ، جبکہ اسٹاپ نقصان سے باہر نکلنے والے بڑے ٹائم فریموں پر چلنے والی اوسط کو ٹریک کیا جائے۔
یہ حکمت عملی بنیادی طور پر تین اشارے پر مبنی ہے۔
سب سے پہلے ، ایک طویل دورانیے (جیسے سورج کی لکیر) کے X دن کی سادہ حرکت پذیر اوسط کا حساب لگائیں ، اور صرف اس وقت خریدنے کی اجازت دیں جب قیمت اسٹیشن پر ہو۔ اس سے مجموعی طور پر رجحان کی سمت کا تعین کیا جاسکتا ہے ، اور تجارت کے اتار چڑھاؤ کی مدت سے بچا جاسکتا ہے۔
دوسرا ، ایک مختصر مدت (جیسے 5 دن) کے اندر سب سے زیادہ قیمت کی سوئنگ ہائی کا حساب لگائیں ، جب قیمت اس سب سے زیادہ قیمت کو توڑ دیتی ہے تو اس سے خریدنے کا اشارہ ہوتا ہے۔ یہاں ایک جائزہ لینے والے سائیکل پیرامیٹرز کے ساتھ مل کر مناسب نقطہ نظر کی تلاش کریں۔
تیسرا ، ایک اسٹاپ لائن قائم کریں۔ پوزیشن میں داخل ہونے کے بعد ، اسٹاپ لائن ایک خاص دورانیے کے لئے lbStop کی کم سے کم قیمت پر قفل کردی جاتی ہے۔ ایک متحرک اوسط ((جیسے یومیہ 10 دن ای ایم اے) کو ایکسٹٹ میکانزم کے طور پر ترتیب دیتے ہوئے ، جب قیمت اس متحرک اوسط سے کم ہو تو پوزیشن سے باہر نکلیں۔
اس حکمت عملی کے ساتھ ساتھ اے ٹی آر کی قیمت بھی مقرر کی گئی ہے تاکہ پوائنٹس کی خریداری سے بچایا جاسکے۔ اس کے علاوہ ، دیگر معاون شرائط جیسے ریٹرننگ ٹائم رینج ہیں۔
ان تینوں اشارے کا آپس میں تعامل اس حکمت عملی کی بنیادی منطق ہے۔
یہ ایک ایسی حکمت عملی ہے جس میں درج ذیل فوائد ہیں:
دو ٹائم فریموں کا استعمال کرتے ہوئے ، اتار چڑھاؤ کی منڈیوں میں پھنس جانے سے بچیں۔ لمبے وقت کے فریموں میں مجموعی رجحانات کا اندازہ لگایا جاتا ہے ، اور مختصر وقت کے فریموں میں مخصوص داخلے کے مقامات کی تلاش کی جاتی ہے۔
سوئنگ ہائی کی تشکیل کے نقطہ نظر کا استعمال کرتے ہوئے، اس طرح کے توڑنے میں کچھ انترج اور آسانی سے ٹریکنگ کی تشکیل ہوتی ہے۔ اس کے ساتھ ساتھ ، سائیکل lb پیرامیٹرز کو دوبارہ دیکھ کر واقعی موثر توڑنے کی تلاش کی جاسکتی ہے۔
نقصانات کو روکنے کا طریقہ زیادہ سخت ہے ، حالیہ نچلی سطح کو ٹریک کریں اور کچھ حد تک بچاؤ کا فاصلہ چھوڑ دیں ، تاکہ اس سے بچنے سے بچ سکے۔
ایکٹ کے طور پر منتقل اوسط کا استعمال کرتے ہوئے، آپ کو آپ کی مرضی کے مطابق لچکدار روکنے کے کر سکتے ہیں.
اے ٹی آر اشارے سے زیادہ مقدار میں ہونے والے خطرات سے بچنے کے لئے۔
مختلف پیرامیٹرز کے مجموعے کو جانچنے کے لئے ترتیب دیا جاسکتا ہے ، بہتر بنانے کے لئے زیادہ جگہ ہے۔
اس حکمت عملی میں کچھ خطرات بھی ہیں:
جب قیمتوں میں حرکت پذیر اوسط کے قریب اتار چڑھاؤ ہوتا ہے تو ، اس میں بار بار سوئچنگ اور آؤٹ پوزیشن کا خطرہ ہوتا ہے۔ اس وقت اعلی فیسوں کا خطرہ ہوتا ہے۔
جب آپ خریدنے کے نقطہ کو منتقل کرنے کے قریب توڑتے ہیں تو آپ کو واپسی کا خطرہ زیادہ ہوتا ہے۔ یہ حکمت عملی کی اپنی خصوصیت ہے۔
جب مارکیٹ میں کوئی واضح رجحان نہیں ہوتا ہے تو ، پوزیشن رکھنے میں زیادہ وقت لگ سکتا ہے ، جس سے وقت کا خطرہ ہوتا ہے۔
اے ٹی آر پیرامیٹرز کو مناسب طریقے سے ترتیب دینے کی ضرورت ہے۔ اے ٹی آر بہت کم فلٹرنگ کا اثر کمزور ہے ، اور بہت زیادہ داخلے کے امکانات کم ہیں۔
نتائج پر مختلف lb پیرامیٹرز کے اثر کو جانچنے کی ضرورت ہے۔ بہت بڑے پیرامیٹرز کچھ مواقع سے محروم ہوجاتے ہیں ، اور بہت چھوٹے پیرامیٹرز جھوٹی پیشرفت کی نشاندہی کرسکتے ہیں۔
خطرے سے نمٹنے کے طریقے:
اس حکمت عملی کو مندرجہ ذیل جہتوں سے بھی بہتر بنایا جاسکتا ہے:
متحرک اوسط کے مختلف پیرامیٹرز کے مجموعے کی جانچ کریں اور بہترین پیرامیٹرز تلاش کریں۔
مختلف اے ٹی آر پیرامیٹرز کی ترتیبات کو آزمائیں ، جو داخلے کے مواقع اور خطرے کو کنٹرول کرنے میں توازن رکھتے ہیں۔
زیادہ موثر کامیابیوں کی شناخت کے لئے LB پیرامیٹرز کا جائزہ لینے کے لئے سائیکل کو بہتر بنائیں
متحرک اسٹاپ نقصان قائم کرنے کی کوشش کریں ، اتار چڑھاؤ اور واپسی کے حساب سے خطرے کو کنٹرول کریں۔
ٹرانزیکشن حجم کے اشارے جیسے دیگر عوامل کے ساتھ مل کر ، کامیابی کی تاثیر کا اندازہ لگایا گیا ہے۔
<!ENTITY prefixed with “/”,</,><<<<<<<<<<<<<<<<<<<<<<<<<<<<<<<<<<<<<<<<<<<<<<<<<<<<<<<<<<<<<<<<<<<<<<<<<<<<<<<<<<<<<<<<<<<<<<<<<<<<<<<<<<<<<<<<<<<<<<<<<<<<<<<<<<<<<<<<<<<<<<<<<<<<<<<<<<<<<<<<<<<<<<<<<<<<<<<<<<<<<<<<<<<<<<<<<<<<<<<<<<<<<<<<<<<<<<<<<<<<<<<<<<<<<<<<<<<<<<<<
مشین لرننگ کے ساتھ پیرامیٹرز کی تربیت کرنے کی کوشش کریں تاکہ آپ کو بہترین پیرامیٹرز مل سکیں۔
یہ حکمت عملی مجموعی طور پر ایک مثالی بریک ٹریکنگ حکمت عملی ہے۔ ڈبل ٹائم فریم کا فیصلہ ، سوئنگ ہائی نے اندراج کے وقت ، اسٹاپ نقصان کی لائن اور منتقل اوسط ڈبل انشورنس سے باہر نکلنے کا طریقہ کار کی نشاندہی کی ، جس سے ایک مکمل منطقی نظام تشکیل دیا گیا۔ اس حکمت عملی کے خطرات اور فوائد کی خصوصیات واضح ہیں ، جو درمیانی اور لمبی لائنوں کی پیروی کرنے والے سرمایہ کاروں کے لئے موزوں ہیں۔ اگرچہ کچھ خطرات موجود ہیں ، لیکن پیرامیٹرز کی اصلاح اور قواعد کی اصلاح کے ذریعہ اس خطرے کی سطح کو کم کیا جاسکتا ہے۔ اس حکمت عملی میں بہتری کی گنجائش ہے ، اور اگر اس میں مزید پیمائش کے فیصلے شامل ہوں تو اس حکمت عملی کی تاثیر کو مزید بڑھا سکتا ہے۔
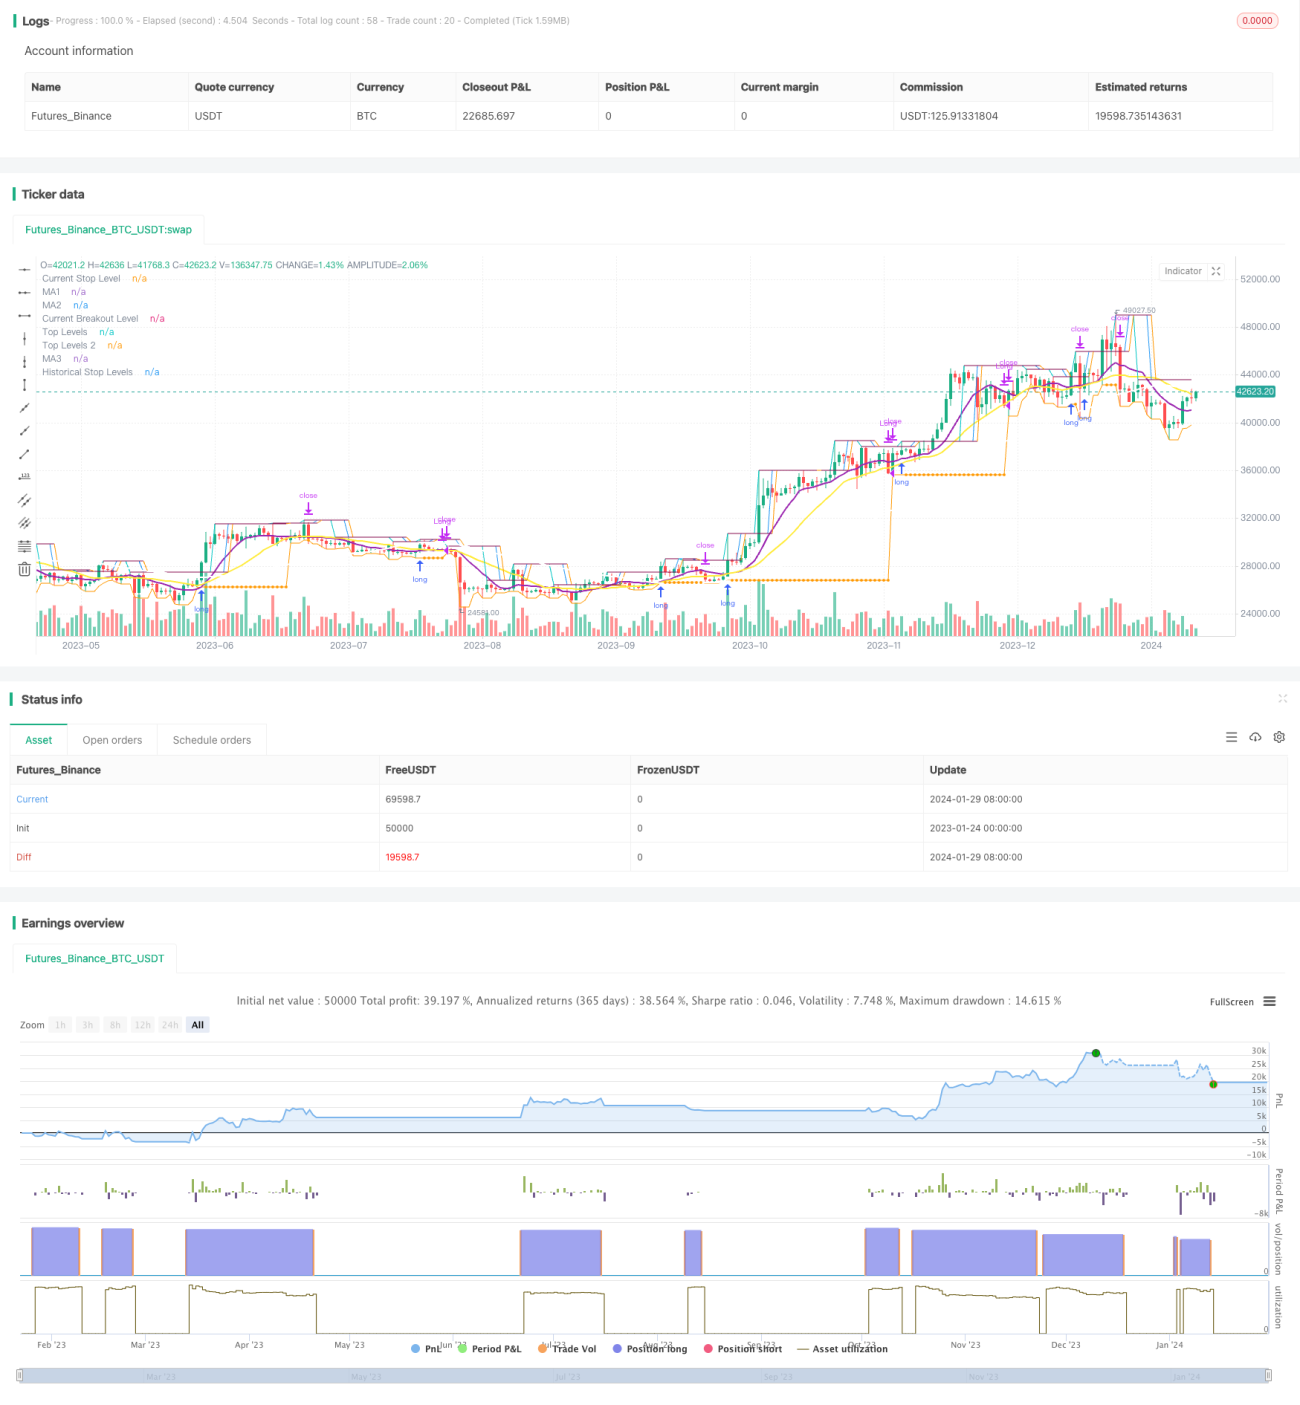
/*backtest
start: 2023-01-24 00:00:00
end: 2024-01-30 00:00:00
period: 1d
basePeriod: 1h
exchanges: [{"eid":"Futures_Binance","currency":"BTC_USDT"}]
*/
// This source code is subject to the terms of the Mozilla Public License 2.0 at https://mozilla.org/MPL/2.0/
// © millerrh
// The intent of this strategy is to buy breakouts with a tight stop on smaller timeframes in the direction of the longer term trend.
// Then use a trailing stop of a close below either the 10 MA or 20 MA (user choice) on that larger timeframe as the position
// moves in your favor (i.e. whenever position price rises above the MA).
// Option of using daily ATR as a measure of finding contracting ranges and ensuring a decent risk/reward.
// (If the difference between the breakout point and your stop level is below a certain % of ATR, it could possibly find those consolidating periods.)
//@version=4
strategy("Qullamaggie Breakout", overlay=true, initial_capital=10000, currency='USD',
default_qty_type=strategy.percent_of_equity, default_qty_value=100, commission_type=strategy.commission.percent, commission_value=0.1)
// === BACKTEST RANGE ===
Start = input(defval = timestamp("01 Jan 2019 06:00 +0000"), title = "Backtest Start Date", type = input.time)
Finish = input(defval = timestamp("01 Jan 2100 00:00 +0000"), title = "Backtest End Date", type = input.time)
// Inputs
lb = input(defval = 3, title = "Lookback Period for Swing High", minval = 1,
tooltip = "Lookback period for defining the breakout level.")
lbStop = input(defval = 3, title = "Lookback Bars for Stop Level", minval = 1,
tooltip = "Initial stop placement is the lowest low this many bars back. Allows for tighter stop placement than referencing swing lows.")
htf = input(defval="D", title="Timeframe of Moving Averages", type=input.resolution,
tooltip = "Allows you to set a different time frame for the moving averages. The default behavior is to identify good tightening setups on a larger timeframe
(like daily) and enter the trade on a breakout occuring on a smaller timeframe, using the moving averages of the larger timeframe to trail your stop.")
maType = input(defval="SMA", options=["EMA", "SMA"], title = "Moving Average Type")
ma1Length = input(defval = 10, title = "1st Moving Average Length", minval = 1)
ma2Length = input(defval = 20, title = "2nd Moving Average Length", minval = 1)
ma3Length = input(defval = 50, title = "3rd Moving Average Length", minval = 1)
useMaFilter = input(title = "Use 3rd Moving Average for Filtering?", type = input.bool, defval = true,
tooltip = "Signals will be ignored when price is under this slowest moving average. The intent is to keep you out of bear periods and only
buying when price is showing strength or trading with the longer term trend.")
trailMaInput = input(defval="2nd Moving Average", options=["1st Moving Average", "2nd Moving Average"], title = "Trailing Stop")
// MA Calculations
ma(maType, src, length) =>
maType == "EMA" ? ema(src, length) : sma(src, length) //Ternary Operator (if maType equals EMA, then do ema calc, else do sma calc)
ma1 = security(syminfo.tickerid, htf, ma(maType, close, ma1Length))
ma2 = security(syminfo.tickerid, htf, ma(maType, close, ma2Length))
ma3 = security(syminfo.tickerid, htf, ma(maType, close, ma3Length))
plot(ma1, color=color.purple, style=plot.style_line, title="MA1", linewidth=2, transp = 60)
plot(ma2, color=color.yellow, style=plot.style_line, title="MA2", linewidth=2, transp = 60)
plot(ma3, color=color.white, style=plot.style_line, title="MA3", linewidth=2, transp = 60)
// === USE ATR FOR FILTERING ===
// The idea here is that you want to buy in a consolodating range for best risk/reward. So here you can compare the current distance between
// support/resistance vs.the ATR and make sure you aren't buying at a point that is too extended from normal.
useAtrFilter = input(title = "Use ATR for Filtering?", type = input.bool, defval = false,
tooltip = "Signals will be ignored if the distance between support and resistance is larger than a user-defined percentage of Daily ATR.
This allows the user to ensure they are not buying something that is too extended and instead focus on names that are consolidating more.")
atrPerc = input(defval = 100, title = "% of Daily ATR Value", minval = 1)
atrValue = security(syminfo.tickerid, "D", atr(14))*atrPerc*.01
// === PLOT SWING HIGH/LOW AND MOST RECENT LOW TO USE AS STOP LOSS EXIT POINT ===
// Change these values to adjust the look back and look forward periods for your swing high/low calculations
pvtLenL = lb
pvtLenR = lb
// Get High and Low Pivot Points
pvthi_ = pivothigh(high, pvtLenL, pvtLenR)
pvtlo_ = pivotlow(low, pvtLenL, pvtLenR)
// Force Pivot completion before plotting.
Shunt = 1 //Wait for close before printing pivot? 1 for true 0 for flase
maxLvlLen = 0 //Maximum Extension Length
pvthi = pvthi_[Shunt]
pvtlo = pvtlo_[Shunt]
// Count How many candles for current Pivot Level, If new reset.
counthi = barssince(not na(pvthi))
countlo = barssince(not na(pvtlo))
pvthis = fixnan(pvthi)
pvtlos = fixnan(pvtlo)
hipc = change(pvthis) != 0 ? na : color.maroon
lopc = change(pvtlos) != 0 ? na : color.green
// Display Pivot lines
plot((maxLvlLen == 0 or counthi < maxLvlLen) ? pvthis : na, color=hipc, transp=0, linewidth=1, offset=-pvtLenR-Shunt, title="Top Levels")
// plot((maxLvlLen == 0 or countlo < maxLvlLen) ? pvtlos : na, color=lopc, transp=0, linewidth=1, offset=-pvtLenR-Shunt, title="Bottom Levels")
plot((maxLvlLen == 0 or counthi < maxLvlLen) ? pvthis : na, color=hipc, transp=0, linewidth=1, offset=0, title="Top Levels 2")
// plot((maxLvlLen == 0 or countlo < maxLvlLen) ? pvtlos : na, color=lopc, transp=0, linewidth=1, offset=0, title="Bottom Levels 2")
// BUY CONDITIONS
stopLevelCalc = valuewhen(pvtlo_, low[pvtLenR], 0) //Stop Level at Swing Low
buyLevel = valuewhen(pvthi_, high[pvtLenR], 0) //Buy level at Swing High
plot(buyLevel, style=plot.style_line, color=color.blue, title = "Current Breakout Level", show_last=1, linewidth=1, transp=50, trackprice=true)
// Conditions for entry and exit
stopLevel = float(na) // Define stop level here as "na" so that I can reference it in the inPosition
// variable and the ATR calculation before the stopLevel is actually defined.
buyConditions = (useMaFilter ? buyLevel > ma3 : true) and
(useAtrFilter ? (buyLevel - stopLevel[1]) < atrValue : true)
// buySignal = high > buyLevel and buyConditions
buySignal = crossover(high, buyLevel) and buyConditions
trailMa = trailMaInput == "1st Moving Average" ? ma1 : ma2
sellSignal = crossunder(close, trailMa)
// sellSignal = security(syminfo.tickerid, htf, close < trailMa) and security(syminfo.tickerid, htf, close[1] < trailMa)
// STOP AND PRICE LEVELS
inPosition = bool(na)
inPosition := buySignal[1] ? true : sellSignal[1] ? false : low <= stopLevel[1] ? false : inPosition[1]
lowDefine = lowest(low, lbStop)
stopLevel := inPosition ? stopLevel[1] : lowDefine
// plot(stopLevel)
buyPrice = buyLevel
buyPrice := inPosition ? buyPrice[1] : buyLevel
plot(stopLevel, style=plot.style_line, color=color.orange, title = "Current Stop Level", show_last=1, linewidth=1, transp=50, trackprice=true)
plot(inPosition ? stopLevel : na, style=plot.style_circles, color=color.orange, title = "Historical Stop Levels", transp=50, trackprice=false)
// plot(buyPrice, style=plot.style_line, color=color.blue, linewidth=1, transp=50, trackprice=true)
// (STRATEGY ONLY) Comment out for Study
strategy.entry("Long", strategy.long, stop = buyLevel, when = buyConditions)
strategy.exit("Exit Long", from_entry = "Long", stop=stopLevel[1])
if (low[1] > trailMa)
strategy.close("Long", when = sellSignal)
// if (low[1] > trailMa)
// strategy.exit("Exit Long", from_entry = "Long", stop=trailMa) //to get this to work right, I need to reference highest highs instead of swing highs
//because it can have me buy right back in after selling if the stop level is above the last registered swing high point.