سپر ٹرینڈ مومنٹم اتار چڑھاؤ دوہری اشارے ٹائمنگ حکمت عملی
جائزہ
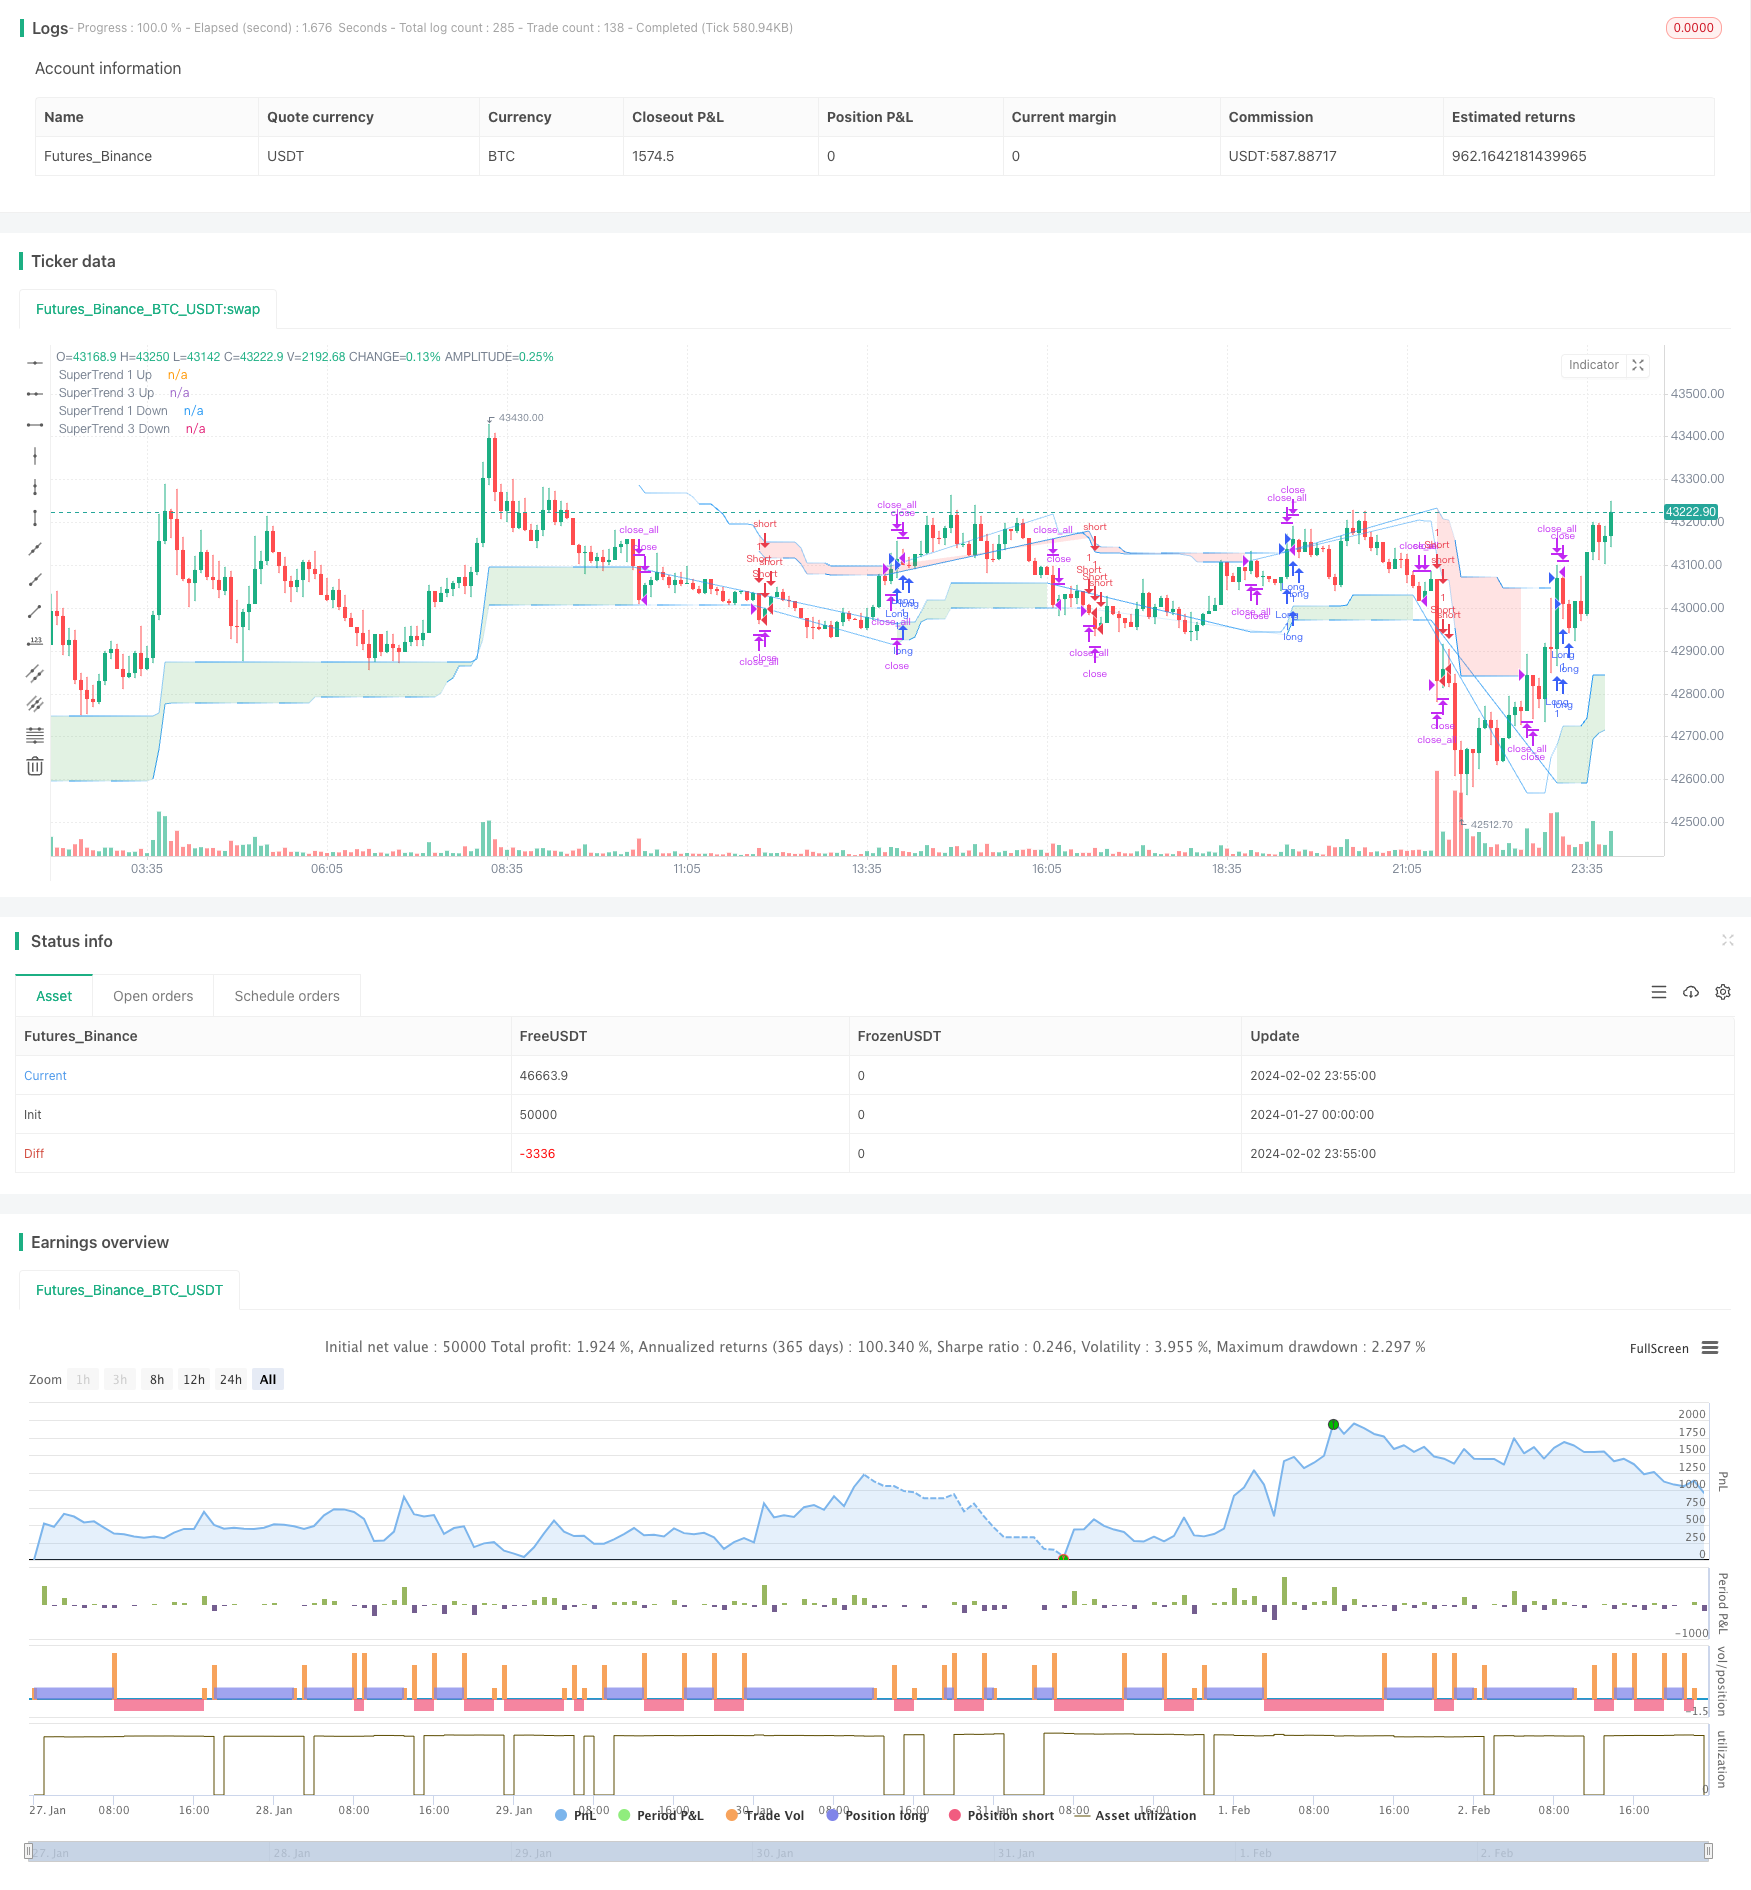
یہ حکمت عملی ایک مضبوط تکنیکی ٹریڈنگ ٹول کی تعمیر کے لئے سپر ٹرینڈ اشارے اور ایلیٹ لہر تھیوری کو جوڑتی ہے۔ یہ ایک کثیر سطح کے رجحان تجزیہ کا استعمال کرتا ہے تاکہ مارکیٹ میں زیادہ جامع نقطہ نظر فراہم کیا جاسکے۔
حکمت عملی کا اصول
اس کی بنیادی سوچ اس کے کثیر جہتی طریقوں میں ہے:
- 4 ہائپر ٹرینڈنگ اشارے ، ہر ایک مختلف ATR لمبائی اور ضرب کا استعمال کرتے ہوئے ، قلیل مدتی سے لے کر طویل مدتی تک کے رجحانات کا فیصلہ کرتے ہیں
- انڈیکیٹرز کے امتزاج کے ذریعے ، ایک مضبوط ڈوب اور ڈوب کے سگنل کو تلاش کیا جاسکتا ہے
- ایلیوٹ لہر کے ماڈل کی شناخت کے طریقہ کار کا حوالہ دیتے ہوئے ، مارکیٹ کے طرز عمل کے اسی طرح کے نمونوں کی نشاندہی کریں ، تجارتی سگنل کی تصدیق کریں
اس طرح، ایک سے زیادہ اشارے کا استعمال کیا جاتا ہے اور اس طرح کی شناخت میں اضافہ ہوتا ہے، جو حکمت عملی کو مضبوط بناتا ہے.
طاقت کا تجزیہ
- ملٹی انڈیکیٹر ڈیزائن، مکمل فیصلہ
- لہر نظریہ کی حوصلہ افزائی، پیٹرن کی شناخت میں استحکام
- ریئل ٹائم سمت میں تبدیلی اور مارکیٹ میں تبدیلی
- مختلف اقسام اور وقت کی مدت کے لئے قابل ترتیب پیرامیٹرز
خطرے کا تجزیہ
- پیرامیٹرز کی ترتیب تجربے پر منحصر ہے ، بہترین پیرامیٹرز کے مجموعے کو طے کرنے کے لئے ایڈجسٹمنٹ کی ضرورت ہے
- ملٹی میٹر ڈیزائن زیادہ پیچیدہ ہے، کمپیوٹنگ کا بوجھ بڑھاتا ہے
- غلط سگنل کی پیداوار سے مکمل طور پر بچنے کے قابل نہیں
پیرامیٹرز کی اصلاح کے ذریعے ، بہترین پیرامیٹرز کی تدریجی طور پر نشاندہی کی جاسکتی ہے۔ کمپیوٹنگ کی کارکردگی کو بہتر بنانے کے لئے کلاؤڈ کمپیوٹنگ کو اپنانا۔ خطرے کو کنٹرول کرنے کے لئے اسٹاپ نقصان کی ترتیب۔
اصلاح کی سمت
آپ کو مندرجہ ذیل طریقوں سے بہتر بنانے کی ضرورت ہے:
- مارکیٹ کے حالات کے مطابق متحرک طور پر پیرامیٹرز کو ایڈجسٹ کرنے کے لئے ایک انکولی پیرامیٹرز ایڈجسٹمنٹ ماڈیول شامل کریں
- ٹریڈنگ سگنل کی وشوسنییتا کا اندازہ لگانے کے لئے مشین لرننگ ماڈل شامل کرنا
- جذبات کے اشارے ، خبروں کے واقعات وغیرہ جیسے بیرونی عوامل کے ساتھ منڈی کے نمونوں کا تعین کرنا
- ٹیسٹنگ کے کام کو کم کرنے کے لئے کثیر قسم کے پیرامیٹرز کے سانچوں کی حمایت کریں
اس سے حکمت عملی کے پیرامیٹرز زیادہ ذہین ہوں گے ، فیصلے زیادہ درست ہوں گے اور عملی اطلاق آسان ہوگا۔
خلاصہ کریں۔
اس حکمت عملی میں رجحانات اور نمونوں کی دو جہتوں کو مدنظر رکھا گیا ہے ، جس سے فیصلے کی استحکام کو یقینی بنایا جاتا ہے اور حکمت عملی کی لچک کو بڑھایا جاتا ہے۔ متعدد اشارے اور پیرامیٹرز کی ترتیب پورے بازار میں قابل اطلاق ہونے کی ضمانت دیتی ہے۔ اگر ذہانت اور آٹومیشن کے طریقوں کو مزید متعارف کرایا جائے تو حکمت عملی کی عملی سطح میں نمایاں اضافہ کیا جائے گا۔
/*backtest
start: 2024-01-27 00:00:00
end: 2024-02-03 00:00:00
period: 5m
basePeriod: 1m
exchanges: [{"eid":"Futures_Binance","currency":"BTC_USDT"}]
*/

//@version=5
strategy("Elliott's Quadratic Momentum - Strategy [presentTrading]",shorttitle = "EQM Strategy [presentTrading]", overlay=true )

// Inputs for selecting trading direction
tradingDirection = input.string("Both", "Select Trading Direction", options=["Long", "Short", "Both"])


// SuperTrend Function
supertrend(src, atrLength, multiplier) =>
    atr = ta.atr(atrLength)
    up = hl2 - (multiplier * atr)
    dn = hl2 + (multiplier * atr)
    trend = 1
    trend := nz(trend[1], 1)
    up := src > nz(up[1], 0) and src[1] > nz(up[1], 0) ?   math.max(up, nz(up[1], 0)) : up
    dn := src < nz(dn[1], 0) and src[1] < nz(dn[1], 0) ? math.min(dn, nz(dn[1], 0)) : dn
    trend := src > nz(dn[1], 0) ?  1 : src < nz(up[1], 0)? -1 : nz(trend[1], 1)
    [up, dn, trend]

// Inputs for SuperTrend settings
atrLength1 = input(7, title="ATR Length for SuperTrend 1")
multiplier1 = input(4.0, title="Multiplier for SuperTrend 1")
atrLength2 = input(14, title="ATR Length for SuperTrend 2")
multiplier2 = input(3.618, title="Multiplier for SuperTrend 2")
atrLength3 = input(21, title="ATR Length for SuperTrend 3")
multiplier3 = input(3.5, title="Multiplier for SuperTrend 3")
atrLength4 = input(28, title="ATR Length for SuperTrend 3")
multiplier4 = input(3.382, title="Multiplier for SuperTrend 3")

// Calculate SuperTrend
[up1, dn1, trend1] = supertrend(close, atrLength1, multiplier1)
[up2, dn2, trend2] = supertrend(close, atrLength2, multiplier2)
[up3, dn3, trend3] = supertrend(close, atrLength3, multiplier3)
[up4, dn4, trend4] = supertrend(close, atrLength4, multiplier4)


// Entry Conditions based on SuperTrend and Elliott Wave-like patterns
longCondition = trend1 == 1 and trend2 == 1 and trend3 == 1 and trend4 == 1
shortCondition = trend1 == -1 and trend2 == -1 and trend3 == -1 and trend4 == - 1

// Strategy Entry logic based on selected trading direction
if tradingDirection == "Long" or tradingDirection == "Both"
    if longCondition
        strategy.entry("Long", strategy.long)
        // [Any additional logic for long entry]

if tradingDirection == "Short" or tradingDirection == "Both"
    if shortCondition
        strategy.entry("Short", strategy.short)
        // [Any additional logic for short entry]


// Exit conditions - Define your own exit strategy
// Example: Exit when any SuperTrend flips
if trend1 != trend1[1] or trend2 != trend2[1] or trend3 != trend3[1] or trend4 != trend4[1]
    strategy.close_all()

// Function to apply gradient effect
gradientColor(baseColor, length, currentBar) =>
    var color res = color.new(baseColor, 100)
    if currentBar <= length
        res := color.new(baseColor, int(100 * currentBar / length))
    res

// Apply gradient effect
color1 = gradientColor(color.blue, atrLength1, bar_index % atrLength1)
color4 = gradientColor(color.blue, atrLength4, bar_index % atrLength3)


// Plot SuperTrend with gradient for upward trend
plot1Up = plot(trend1 == 1 ? up1 : na, color=color1, linewidth=1, title="SuperTrend 1 Up")
plot4Up = plot(trend4 == 1 ? up4 : na, color=color4, linewidth=1, title="SuperTrend 3 Up")

// Plot SuperTrend with gradient for downward trend
plot1Down = plot(trend1 == -1 ? dn1 : na, color=color1, linewidth=1, title="SuperTrend 1 Down")
plot4Down = plot(trend4 == -1 ? dn4 : na, color=color4, linewidth=1, title="SuperTrend 3 Down")

// Filling the area between the first and third SuperTrend lines for upward trend
fill(plot1Up, plot4Up, color=color.new(color.green, 80), title="SuperTrend Upward Band")

// Filling the area between the first and third SuperTrend lines for downward trend
fill(plot1Down, plot4Down, color=color.new(color.red, 80), title="SuperTrend Downward Band")