ہل اشارے اور LSMA اشارے پر مبنی رجحان سے باخبر رہنے والی مقداری حکمت عملی
جائزہ
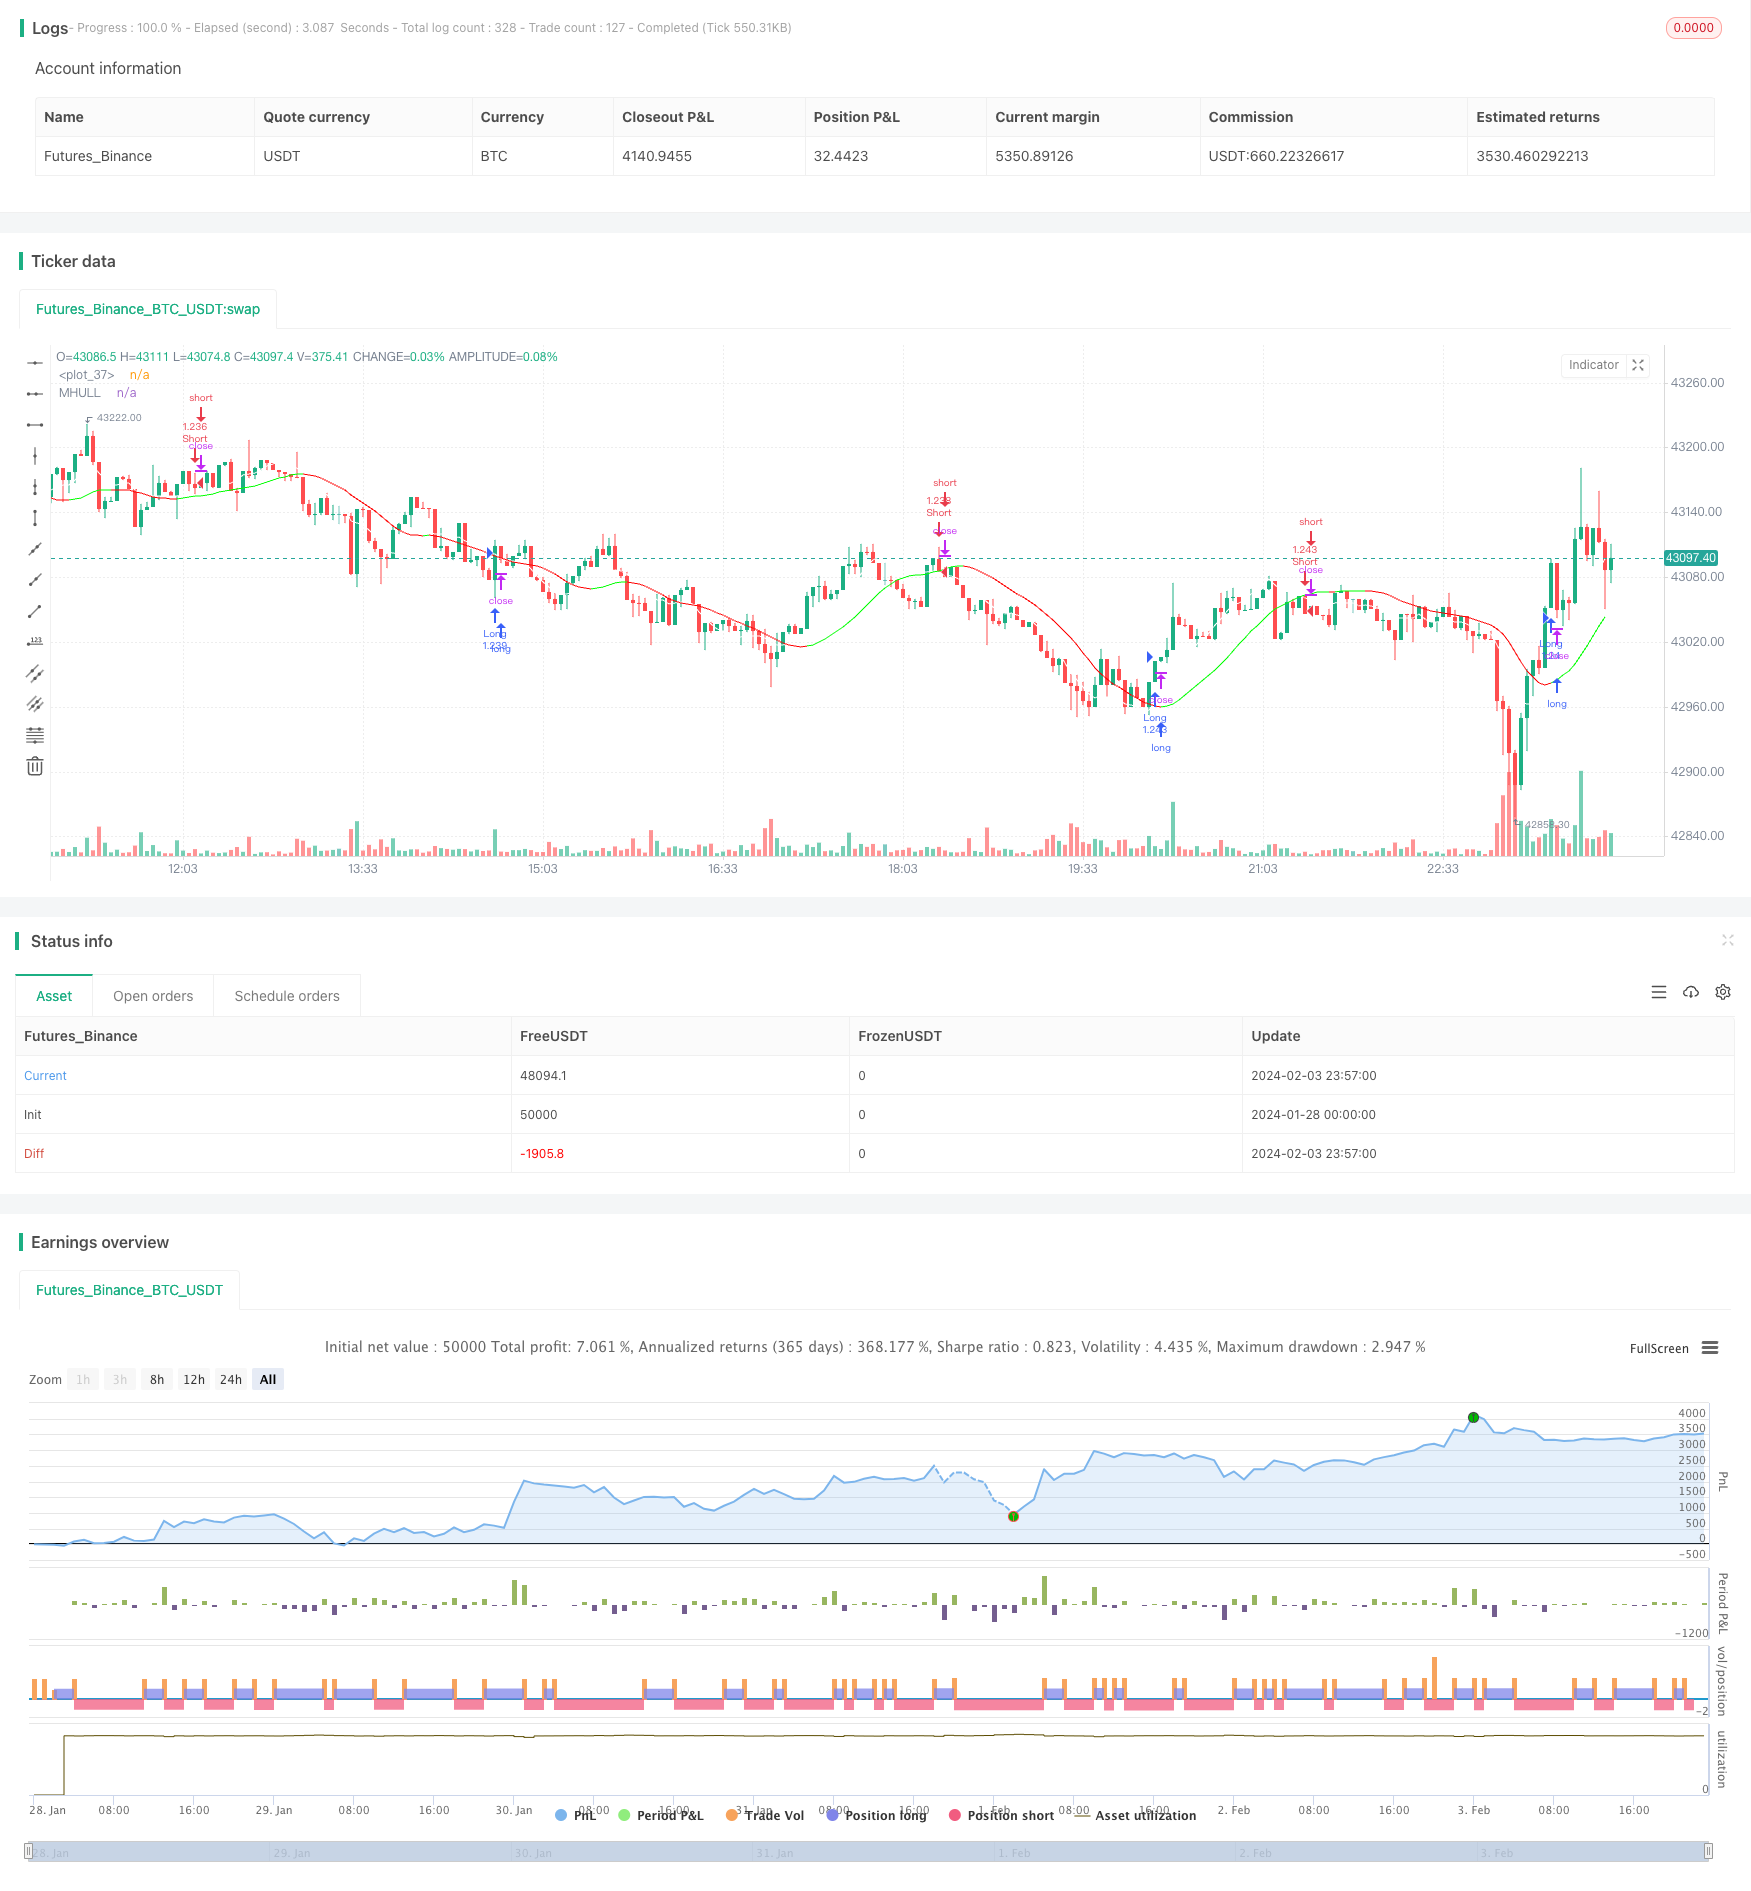
یہ حکمت عملی ہل اشارے اور ایل ایس ایم اے ((کم سے کم دوگنا منتقل اوسط) اشارے کے ساتھ مل کر رجحان کی سمت اور رجحان الٹ پوائنٹس کی شناخت کرتی ہے ، جس سے رجحانات پر عمل درآمد ہوتا ہے۔ جب ہل اشارے اوپر کی طرف بڑھتے ہوئے دکھائے جاتے ہیں اور ایل ایس ایم اے ہل اشارے کو پار کرتے ہیں تو زیادہ کریں۔ جب ہل اشارے نیچے کی طرف بڑھتے ہوئے دکھائے جاتے ہیں اور ایل ایس ایم اے ہل اشارے کو پار کرتے ہیں تو خالی ہوجائیں۔ یہ حکمت عملی درمیانی اور کم تعدد کی تجارت کے لئے موزوں ہے اور 1 منٹ کے وقت کے فریم پر استعمال کی جاسکتی ہے۔
حکمت عملی کا اصول
ہل اشارے قدر کی رجحان کی سمت کا فیصلہ کرنے کے لئے استعمال کیا جاتا ہے۔ جب وسط ریل لائن ((MHULL) نیچے کی ریل لائن ((LHULL) کے اوپر ہے تو ، اس کا اشارہ اوپر کی طرف ہے۔ اس کے برعکس ، اس کا اشارہ نیچے کی طرف ہے۔
ایل ایس ایم اے اشارے کا استعمال ٹرینڈ الٹ پوائنٹس کی شناخت کے لئے کیا جاتا ہے۔ جب ایل ایس ایم اے اشارے ایم ایچ یو ایل ایل کو عبور کرتا ہے تو ، اس کا اشارہ ہوتا ہے کہ اوپر کا رجحان تشکیل یا تیز ہوتا ہے۔ جب ایل ایس ایم اے اشارے ایم ایچ یو ایل ایل کو عبور کرتا ہے تو ، اس کا اشارہ ہوتا ہے کہ نیچے کا رجحان تشکیل یا تیز ہوتا ہے۔
ان دونوں کو جوڑ کر ، جب ہل اشارے اوپر کی طرف بڑھ رہے ہیں ((MHULL > LHULL) اور ایل ایس ایم اے اوپر سے MHULL پار کرتے ہیں تو ، زیادہ کام کریں۔ جب ہل اشارے نیچے کی طرف بڑھ رہے ہیں ((MHULL < LHULL) اور ایل ایس ایم اے نیچے سے MHULL پار کرتے ہیں تو ، خالی کریں۔
اسٹاپ نقصان کو قریب ترین اتار چڑھاؤ کے طور پر ترتیب دیا گیا ہے۔ زیادہ اسٹاپ نقصان کو قریب ترین نچلے مقام پر ، اور کم اسٹاپ نقصان کو قریب ترین اعلی مقام پر۔
طاقت کا تجزیہ
یہ حکمت عملی مندرجہ ذیل فوائد رکھتی ہے:
ہل اشارے تیزی سے ردعمل ، بروقت رجحان کی تبدیلی کو پکڑنے کے لئے؛ ایل ایس ایم اے ہموار ہے ، الٹ سگنل کی شناخت درست اور قابل اعتماد ہے۔ دونوں کا مجموعہ استعمال کرنے میں اچھا ہے۔
جعلی سگنل جو ایل ایس ایم اے کے ذریعے ٹرانسمیشن ہل اشارے کے فیصلے سے گزرتا ہے ، غلط تجارت کے امکانات کو کم کرتا ہے۔
اتار چڑھاؤ کے پوائنٹس کو روکنے کے طور پر استعمال کیا جاتا ہے، زیادہ سے زیادہ رقم کی حفاظت کے لئے.
درمیانے اور کم تعدد کی تجارت کے لئے موزوں ، 1 منٹ یا اس سے کم وقت کے فریم میں استعمال کیا جاسکتا ہے ، اور اس میں وسیع پیمانے پر اطلاق ہوتا ہے۔
خطرے کا تجزیہ
اس حکمت عملی کے کچھ خطرات بھی ہیں:
ہل انڈیکس اور ایل ایس ایم اے کے متعدد کراسنگ کے نتیجے میں ہل انڈیکس اور ایل ایس ایم اے کے درمیان متعدد کراسنگ ہوسکتی ہے ، جس کی وجہ سے ہل انڈیکس اور ایل ایس ایم اے کے مابین متعدد کراسنگ ہوسکتی ہے۔
اسٹاپ نقصان کا تعین ایک اتار چڑھاؤ نقطہ کے طور پر کیا گیا ہے جو قلیل مدتی قیمت میں ہونے والی تبدیلیوں کی وجہ سے پیدا ہوسکتا ہے۔ اسٹاپ نقصان کی جگہ کے فاصلے کو مناسب طریقے سے بڑھایا جانا چاہئے۔
ایل ایس ایم اے اشارے کی تاخیر کی وجہ سے ، تھوڑا سا غلط فہمی کا خطرہ ہے۔ اس کی تصدیق کے لئے دوسرے اشارے جیسے K لائن کی شکل کے ساتھ مل کر کیا جانا چاہئے۔
اصلاح کی سمت
اس حکمت عملی کو مندرجہ ذیل پہلوؤں سے بہتر بنایا جاسکتا ہے:
ہل اشارے اور ایل ایس ایم اے کے پیرامیٹرز کو بہتر بنائیں تاکہ اس کا مجموعہ مختلف اقسام اور وقت کے دورانیوں کے ساتھ بہتر طور پر مل سکے۔
غیر مستحکم حالات میں غلط ٹریڈنگ سے بچنے کے لئے فلٹرنگ کی شرائط میں اضافہ کریں ، جیسے اتار چڑھاؤ ، حجم وغیرہ۔
مشین لرننگ الگورتھم میں رجحانات کا اندازہ لگانے کے لئے معاون فیصلے شامل کریں۔
ڈیف لرننگ اور دیگر تکنیکوں کے ساتھ مل کر ، معاون مزاحمت کے اہم علاقوں کا اندازہ لگائیں ، تاکہ نقصانات کو زیادہ معقول بنایا جاسکے۔
خلاصہ کریں۔
یہ حکمت عملی ، ہل اشارے اور ایل ایس ایم اے کے مجموعی استعمال کے ذریعہ ، رجحان کی سمت میں تبدیلی کا فیصلہ کرتی ہے ، اور رجحان سے باخبر رہنے والی تجارت کو نافذ کرتی ہے۔ اس کی خوبی یہ ہے کہ اس کا کام آسان ہے ، فوری ردعمل ہے ، اور یہ درمیانے اور کم تعدد کی مقدار میں تجارت کے لئے وسیع پیمانے پر قابل اطلاق ہے۔ فلٹرنگ کے حالات کو مزید بہتر بنانے ، معاون فیصلے اور نقصان کو روکنے کے الگورتھم وغیرہ کے ذریعہ ، اس حکمت عملی کے بہتر نتائج کی توقع کی جاسکتی ہے۔
/*backtest
start: 2024-01-28 00:00:00
end: 2024-02-04 00:00:00
period: 3m
basePeriod: 1m
exchanges: [{"eid":"Futures_Binance","currency":"BTC_USDT"}]
*/

// This source code is subject to the terms of the Mozilla Public License 2.0 at https://mozilla.org/MPL/2.0/
// © myn

//@version=5
strategy('Strategy Myth-Busting #9 - HullSuite+LSMA - [MYN]', max_bars_back=5000, overlay=true, pyramiding=0, initial_capital=1000, currency='USD', default_qty_type=strategy.percent_of_equity, default_qty_value=1.0, commission_value=0.075, use_bar_magnifier = false)

// Hull Suite by InSilico
// Least Squares Moving Average

// Long
// Hull Suite is red and LSMA crosses above HUll Suite while red
// Stop loss latest swing low

//Short
// Hull Suite is green and LSMA crosses under HUll Suite while green
// Stop loss latest swing high

//1:4 Risk ratio
// 1 minute timeframe


/////////////////////////////////////
//* Put your strategy logic below *//
/////////////////////////////////////
//72iE0gCVjvM


// LSMA
//░░░░░░░░░░░░░░░░░░░░░░░░░░░░░░░░░░░░░░░░░░░░░░░░░░░░░░░░░░░░░░░░░░░░░░░░░░░░░░░░░░░░░░░░░░░░░░░░░░░░░░░░░░░░░░░░░░░░░░░░░░░░░░░░░░░░░░░░░░░░░░░░░░

//@version=5
//indicator(title = "Least Squares Moving Average", shorttitle="LSMA", overlay=true, timeframe="", timeframe_gaps=true)
length1 = input(title="Length", defval=25, group="Least Squares Moving Average (LSMA)")
offset1 = input(title="Offset", defval=0)
src1 = input(close, title="Source")
lsma = ta.linreg(src1, length1, offset1)
plot(lsma, color=color.white)


// Hull Suite by InSilico
//░░░░░░░░░░░░░░░░░░░░░░░░░░░░░░░░░░░░░░░░░░░░░░░░░░░░░░░░░░░░░░░░░░░░░░░░░░░░░░░░░░░░░░░░░░░░░░░░░░░░░░░░░░░░░░░░░░░░░░░░░░░░░░░░░░░░░░░░░░░░░░░░░░

//@version=5
//Basic Hull Ma Pack tinkered by InSilico
//indicator('Hull Suite by InSilico', overlay=true)

//INPUT
src = input(close, title='Source', group="Hull Suite")
modeSwitch = input.string('Hma', title='Hull Variation', options=['Hma', 'Thma', 'Ehma'])
length = input(55, title='Length(180-200 for floating S/R , 55 for swing entry)')
lengthMult = input(1.0, title='Length multiplier (Used to view higher timeframes with straight band)')

useHtf = input(false, title='Show Hull MA from X timeframe? (good for scalping)')
htf = input.timeframe('240', title='Higher timeframe')

switchColor = input(true, 'Color Hull according to trend?')
candleCol = input(false, title='Color candles based on Hull\'s Trend?')
visualSwitch = input(false, title='Show as a Band?')
thicknesSwitch = input(1, title='Line Thickness')
transpSwitch = input.int(40, title='Band Transparency', step=5)

//FUNCTIONS
//HMA
HMA(_src, _length) =>
    ta.wma(2 * ta.wma(_src, _length / 2) - ta.wma(_src, _length), math.round(math.sqrt(_length)))
//EHMA
EHMA(_src, _length) =>
    ta.ema(2 * ta.ema(_src, _length / 2) - ta.ema(_src, _length), math.round(math.sqrt(_length)))
//THMA
THMA(_src, _length) =>
    ta.wma(ta.wma(_src, _length / 3) * 3 - ta.wma(_src, _length / 2) - ta.wma(_src, _length), _length)

//SWITCH
Mode(modeSwitch, src, len) =>
    modeSwitch == 'Hma' ? HMA(src, len) : modeSwitch == 'Ehma' ? EHMA(src, len) : modeSwitch == 'Thma' ? THMA(src, len / 2) : na

//OUT
_hull = Mode(modeSwitch, src, int(length * lengthMult))
HULL = useHtf ? request.security(syminfo.ticker, htf, _hull) : _hull
MHULL = HULL[0]
SHULL = HULL[2]

//COLOR
hullColor = switchColor ? HULL > HULL[2] ? #00ff00 : #ff0000 : #ff9800

//PLOT
///< Frame
Fi1 = plot(MHULL, title='MHULL', color=hullColor, linewidth=thicknesSwitch, transp=50)
Fi2 = plot(visualSwitch ? SHULL : na, title='SHULL', color=hullColor, linewidth=thicknesSwitch, transp=50)
alertcondition(ta.crossover(MHULL, SHULL), title='Hull trending up.', message='Hull trending up.')
alertcondition(ta.crossover(SHULL, MHULL), title='Hull trending down.', message='Hull trending down.')
///< Ending Filler
fill(Fi1, Fi2, title='Band Filler', color=hullColor, transp=transpSwitch)
///BARCOLOR
barcolor(color=candleCol ? switchColor ? hullColor : na : na)


// Long
// Hull Suite is red and LSMA crosses above HUll Suite while red
// Stop loss latest swing low

//Short
// Hull Suite is green and LSMA crosses under HUll Suite while green
// Stop loss latest swing high

//1:4 Risk ratio
longEntry = hullColor == #ff0000 and ta.crossover(lsma, MHULL )
shortEntry = hullColor == #00ff00 and ta.crossunder(lsma, MHULL)

//////////////////////////////////////
//* Put your strategy rules below *//
/////////////////////////////////////

longCondition = longEntry
shortCondition = shortEntry

//define as 0 if do not want to use
closeLongCondition = 0
closeShortCondition = 0


// ADX
//░░░░░░░░░░░░░░░░░░░░░░░░░░░░░░░░░░░░░░░░░░░░░░░░░░░░░░░░░░░░░░░░░░░░░░░░░░░░░░░░░░░░░░░░░░░░░░░░░░░░░░░░░░░░░░░░░░░░░░░░░░░░░░░░░░░░░░░░░░░░░░░░░░

adxEnabled = input.bool(defval = false , title = "Average Directional Index (ADX)", tooltip = "", group ="ADX" )
adxlen = input(14, title="ADX Smoothing", group="ADX")
adxdilen = input(14, title="DI Length", group="ADX")
adxabove = input(25, title="ADX Threshold", group="ADX")

adxdirmov(len) =>
	adxup = ta.change(high)
	adxdown = -ta.change(low)
	adxplusDM = na(adxup) ? na : (adxup > adxdown and adxup > 0 ? adxup : 0)
	adxminusDM = na(adxdown) ? na : (adxdown > adxup and adxdown > 0 ? adxdown : 0)
	adxtruerange = ta.rma(ta.tr, len)
	adxplus = fixnan(100 * ta.rma(adxplusDM, len) / adxtruerange)
	adxminus = fixnan(100 * ta.rma(adxminusDM, len) / adxtruerange)
	[adxplus, adxminus]
adx(adxdilen, adxlen) =>
	[adxplus, adxminus] = adxdirmov(adxdilen)
	adxsum = adxplus + adxminus
	adx = 100 * ta.rma(math.abs(adxplus - adxminus) / (adxsum == 0 ? 1 : adxsum), adxlen)

adxsig = adxEnabled ? adx(adxdilen, adxlen) : na
isADXEnabledAndAboveThreshold = adxEnabled ? (adxsig > adxabove) : true

//Backtesting Time Period (Input.time not working as expected as of 03/30/2021.  Giving odd start/end dates
//░░░░░░░░░░░░░░░░░░░░░░░░░░░░░░░░░░░░░░░░░░░░░░░░░░░░░░░░░░░░░░░░░░░░░░░░░░░░░░░░░░░░░░░░░░░░░░░░░░░░░░░░░░░░░░░░░░░░░░░░░░░░░░░░░░░░░░░░░░░░░░░░░░
useStartPeriodTime = input.bool(true, 'Start', group='Date Range', inline='Start Period')
startPeriodTime = input(timestamp('1 Jan 2019'), '', group='Date Range', inline='Start Period')
useEndPeriodTime = input.bool(true, 'End', group='Date Range', inline='End Period')
endPeriodTime = input(timestamp('31 Dec 2030'), '', group='Date Range', inline='End Period')

start = useStartPeriodTime ? startPeriodTime >= time : false
end = useEndPeriodTime ? endPeriodTime <= time : false
calcPeriod = true

// Trade Direction
// ░░░░░░░░░░░░░░░░░░░░░░░░░░░░░░░░░░░░░░░░░░░░░░░░░░░░░░░░░░░░░░░░░░░░░░░░░░░░░░░░░░░░░░░░░░░░░░░░░░░░░░░░░░░░░░░░░░░░░░░░░░░░░░░░░░░░░░░░░░░░░░░░░░
tradeDirection = input.string('Long and Short', title='Trade Direction', options=['Long and Short', 'Long Only', 'Short Only'], group='Trade Direction')

// Percent as Points
// ░░░░░░░░░░░░░░░░░░░░░░░░░░░░░░░░░░░░░░░░░░░░░░░░░░░░░░░░░░░░░░░░░░░░░░░░░░░░░░░░░░░░░░░░░░░░░░░░░░░░░░░░░░░░░░░░░░░░░░░░░░░░░░░░░░░░░░░░░░░░░░░░░░
per(pcnt) =>
    strategy.position_size != 0 ? math.round(pcnt / 100 * strategy.position_avg_price / syminfo.mintick) : float(na)

// Take profit 1
// ░░░░░░░░░░░░░░░░░░░░░░░░░░░░░░░░░░░░░░░░░░░░░░░░░░░░░░░░░░░░░░░░░░░░░░░░░░░░░░░░░░░░░░░░░░░░░░░░░░░░░░░░░░░░░░░░░░░░░░░░░░░░░░░░░░░░░░░░░░░░░░░░░░
tp1 = input.float(title='Take Profit 1 - Target %', defval=100, minval=0.0, step=0.5, group='Take Profit', inline='Take Profit 1')
q1 = input.int(title='% Of Position', defval=100, minval=0, group='Take Profit', inline='Take Profit 1')

// Take profit 2
// ░░░░░░░░░░░░░░░░░░░░░░░░░░░░░░░░░░░░░░░░░░░░░░░░░░░░░░░░░░░░░░░░░░░░░░░░░░░░░░░░░░░░░░░░░░░░░░░░░░░░░░░░░░░░░░░░░░░░░░░░░░░░░░░░░░░░░░░░░░░░░░░░░░
tp2 = input.float(title='Take Profit 2 - Target %', defval=100, minval=0.0, step=0.5, group='Take Profit', inline='Take Profit 2')
q2 = input.int(title='% Of Position', defval=100, minval=0, group='Take Profit', inline='Take Profit 2')

// Take profit 3
// ░░░░░░░░░░░░░░░░░░░░░░░░░░░░░░░░░░░░░░░░░░░░░░░░░░░░░░░░░░░░░░░░░░░░░░░░░░░░░░░░░░░░░░░░░░░░░░░░░░░░░░░░░░░░░░░░░░░░░░░░░░░░░░░░░░░░░░░░░░░░░░░░░░
tp3 = input.float(title='Take Profit 3 - Target %', defval=100, minval=0.0, step=0.5, group='Take Profit', inline='Take Profit 3')
q3 = input.int(title='% Of Position', defval=100, minval=0, group='Take Profit', inline='Take Profit 3')

// Take profit 4
// ░░░░░░░░░░░░░░░░░░░░░░░░░░░░░░░░░░░░░░░░░░░░░░░░░░░░░░░░░░░░░░░░░░░░░░░░░░░░░░░░░░░░░░░░░░░░░░░░░░░░░░░░░░░░░░░░░░░░░░░░░░░░░░░░░░░░░░░░░░░░░░░░░░
tp4 = input.float(title='Take Profit 4 - Target %', defval=100, minval=0.0, step=0.5, group='Take Profit')

/// Stop Loss
// ░░░░░░░░░░░░░░░░░░░░░░░░░░░░░░░░░░░░░░░░░░░░░░░░░░░░░░░░░░░░░░░░░░░░░░░░░░░░░░░░░░░░░░░░░░░░░░░░░░░░░░░░░░░░░░░░░░░░░░░░░░░░░░░░░░░░░░░░░░░░░░░░░░
stoplossPercent = input.float(title='Stop Loss (%)', defval=999, minval=0.01, group='Stop Loss') * 0.01
slLongClose = close < strategy.position_avg_price * (1 - stoplossPercent)
slShortClose = close > strategy.position_avg_price * (1 + stoplossPercent)

/// Leverage
// ░░░░░░░░░░░░░░░░░░░░░░░░░░░░░░░░░░░░░░░░░░░░░░░░░░░░░░░░░░░░░░░░░░░░░░░░░░░░░░░░░░░░░░░░░░░░░░░░░░░░░░░░░░░░░░░░░░░░░░░░░░░░░░░░░░░░░░░░░░░░░░░░░░
leverage = input.float(1, 'Leverage', step=.5, group='Leverage')
contracts = math.min(math.max(.000001, strategy.equity / close * leverage), 1000000000)


/// Trade State Management
// ░░░░░░░░░░░░░░░░░░░░░░░░░░░░░░░░░░░░░░░░░░░░░░░░░░░░░░░░░░░░░░░░░░░░░░░░░░░░░░░░░░░░░░░░░░░░░░░░░░░░░░░░░░░░░░░░░░░░░░░░░░░░░░░░░░░░░░░░░░░░░░░░░░

isInLongPosition = strategy.position_size > 0
isInShortPosition = strategy.position_size < 0

/// ProfitView Alert Syntax String Generation
// ░░░░░░░░░░░░░░░░░░░░░░░░░░░░░░░░░░░░░░░░░░░░░░░░░░░░░░░░░░░░░░░░░░░░░░░░░░░░░░░░░░░░░░░░░░░░░░░░░░░░░░░░░░░░░░░░░░░░░░░░░░░░░░░░░░░░░░░░░░░░░░░░░░

alertSyntaxPrefix = input.string(defval='CRYPTANEX_99FTX_Strategy-Name-Here', title='Alert Syntax Prefix', group='ProfitView Alert Syntax')
alertSyntaxBase = alertSyntaxPrefix + '\n#' + str.tostring(open) + ',' + str.tostring(high) + ',' + str.tostring(low) + ',' + str.tostring(close) + ',' + str.tostring(volume) + ','


/// Trade Execution
// ░░░░░░░░░░░░░░░░░░░░░░░░░░░░░░░░░░░░░░░░░░░░░░░░░░░░░░░░░░░░░░░░░░░░░░░░░░░░░░░░░░░░░░░░░░░░░░░░░░░░░░░░░░░░░░░░░░░░░░░░░░░░░░░░░░░░░░░░░░░░░░░░░░

longConditionCalc = (longCondition and isADXEnabledAndAboveThreshold)
shortConditionCalc = (shortCondition and isADXEnabledAndAboveThreshold)

if calcPeriod
    if longConditionCalc and tradeDirection != 'Short Only' and isInLongPosition == false
        strategy.entry('Long', strategy.long, qty=contracts)

        alert(message=alertSyntaxBase + 'side:long', freq=alert.freq_once_per_bar_close)

    if shortConditionCalc and tradeDirection != 'Long Only' and isInShortPosition == false
        strategy.entry('Short', strategy.short, qty=contracts)

        alert(message=alertSyntaxBase + 'side:short', freq=alert.freq_once_per_bar_close)

    //Inspired from Multiple %% profit exits example by adolgo https://www.tradingview.com/script/kHhCik9f-Multiple-profit-exits-example/
    strategy.exit('TP1', qty_percent=q1, profit=per(tp1))
    strategy.exit('TP2', qty_percent=q2, profit=per(tp2))
    strategy.exit('TP3', qty_percent=q3, profit=per(tp3))
    strategy.exit('TP4', profit=per(tp4))

    strategy.close('Long', qty_percent=100, comment='SL Long', when=slLongClose)
    strategy.close('Short', qty_percent=100, comment='SL Short', when=slShortClose)

    strategy.close_all(when=closeLongCondition or closeShortCondition, comment='Close Postion')

/// Dashboard
// ░░░░░░░░░░░░░░░░░░░░░░░░░░░░░░░░░░░░░░░░░░░░░░░░░░░░░░░░░░░░░░░░░░░░░░░░░░░░░░░░░░░░░░░░░░░░░░░░░░░░░░░░░░░░░░░░░░░░░░░░░░░░░░░░░░░░░░░░░░░░░░░░░░
// Inspired by https://www.tradingview.com/script/uWqKX6A2/ - Thanks VertMT

showDashboard = input.bool(group="Dashboard", title="Show Dashboard", defval=false)

f_fillCell(_table, _column, _row, _title, _value, _bgcolor, _txtcolor) =>
    _cellText = _title + "\n" + _value
    table.cell(_table, _column, _row, _cellText, bgcolor=_bgcolor, text_color=_txtcolor, text_size=size.auto)

// Draw dashboard table
if showDashboard
    var bgcolor = color.new(color.black,0)

    // Keep track of Wins/Losses streaks
    newWin  = (strategy.wintrades  > strategy.wintrades[1]) and (strategy.losstrades == strategy.losstrades[1]) and (strategy.eventrades == strategy.eventrades[1])
    newLoss = (strategy.wintrades == strategy.wintrades[1]) and (strategy.losstrades  > strategy.losstrades[1]) and (strategy.eventrades == strategy.eventrades[1])

    varip int winRow     = 0
    varip int lossRow    = 0
    varip int maxWinRow  = 0
    varip int maxLossRow = 0

    if newWin
        lossRow := 0
        winRow := winRow + 1
    if winRow > maxWinRow
        maxWinRow := winRow

    if newLoss
        winRow := 0
        lossRow := lossRow + 1
    if lossRow > maxLossRow
        maxLossRow := lossRow


    // Prepare stats table
    var table dashTable = table.new(position.bottom_right, 1, 15, border_width=1)


    if barstate.islastconfirmedhistory
        // Update table
        dollarReturn = strategy.netprofit
        f_fillCell(dashTable, 0, 0, "Start:", str.format("{0,date,long}", strategy.closedtrades.entry_time(0)) , bgcolor, color.white) // + str.format(" {0,time,HH:mm}", strategy.closedtrades.entry_time(0))
        f_fillCell(dashTable, 0, 1, "End:", str.format("{0,date,long}", strategy.opentrades.entry_time(0)) , bgcolor, color.white) // + str.format(" {0,time,HH:mm}", strategy.opentrades.entry_time(0))
        _profit = (strategy.netprofit / strategy.initial_capital) * 100
        f_fillCell(dashTable, 0, 2, "Net Profit:", str.tostring(_profit, '##.##') + "%", _profit > 0 ? color.green : color.red, color.white)
        _numOfDaysInStrategy = (strategy.opentrades.entry_time(0) - strategy.closedtrades.entry_time(0)) / (1000 * 3600 * 24)
        f_fillCell(dashTable, 0, 3, "Percent Per Day", str.tostring(_profit / _numOfDaysInStrategy, '#########################.#####')+"%", _profit > 0 ? color.green : color.red, color.white)
        _winRate = ( strategy.wintrades / strategy.closedtrades ) * 100
        f_fillCell(dashTable, 0, 4, "Percent Profitable:", str.tostring(_winRate, '##.##') + "%", _winRate < 50 ? color.red : _winRate < 75 ? #999900 : color.green, color.white)
        f_fillCell(dashTable, 0, 5, "Profit Factor:", str.tostring(strategy.grossprofit / strategy.grossloss,  '##.###'), strategy.grossprofit > strategy.grossloss ? color.green : color.red, color.white)
        f_fillCell(dashTable, 0, 6, "Total Trades:", str.tostring(strategy.closedtrades), bgcolor, color.white)
        f_fillCell(dashTable, 0, 8, "Max Wins In A Row:", str.tostring(maxWinRow, '######') , bgcolor, color.white)
        f_fillCell(dashTable, 0, 9, "Max Losses In A Row:", str.tostring(maxLossRow, '######') , bgcolor, color.white)