Heikin Ashi پر مبنی سپر ٹرینڈ ٹریلنگ اسٹاپ نقصان کی حکمت عملی
حکمت عملی کا جائزہ
یہ حکمت عملی Heikin Ashi سلک اور سپر ٹرینڈ اشارے کے ساتھ مل کر ایک رجحان ٹریکنگ سٹاپ حکمت عملی ہے۔ یہ Heikin Ashi سلک کا استعمال مارکیٹ شور کو فلٹر کرنے کے لئے کرتا ہے ، سپر ٹرینڈ اشارے رجحان کی سمت کا فیصلہ کرتے ہیں ، اور سپر ٹرینڈ کو متحرک اسٹاپ لائن کے طور پر استعمال کرتے ہیں ، تاکہ موثر رجحان ٹریکنگ اور خطرے پر قابو پایا جاسکے۔
حکمت عملی کا اصول
- Heikin Ashi کی سلائیڈ کا حساب لگائیں: اوپن ، بند ، زیادہ سے زیادہ ، کم سے کم قیمت شامل ہے۔
- سپر ٹرینڈ اشارے کا حساب لگائیں: اے ٹی آر اور قیمتوں کے حساب سے اوپری اور ڈاؤن ریل۔
- Heikin Ashi سلائیڈ اور سپر رجحانات کے ساتھ مل کر رجحانات کی سمت کا تعین کریں۔
- جب ہیکن آش کی اختتامی قیمت پچھلے ایک کے لائن اختتامی قیمت سے زیادہ قریب سپر رجحان کی اوپری ٹریک پر ہو تو اس میں بیز رجحان ہوتا ہے۔ جب ہیکن آش کی اختتامی قیمت پچھلے ایک کے لائن اختتامی قیمت سے زیادہ قریب سپر رجحان کی نچلی ٹریک پر ہو تو اس میں بیز رجحان ہوتا ہے۔
- بیجنگ رجحان میں ، سپر ٹرینڈ کو اپ ٹریک کرنے کے لئے اسٹاپ لائن کی پیروی کریں؛ بیجنگ رجحان میں ، سپر ٹرینڈ کو نیچے کرنے کے لئے اسٹاپ لائن کی پیروی کریں۔
اسٹریٹجک فوائد
- Heikin Ashi فلٹر کا استعمال کرتے ہوئے، رجحان سگنل کی شناخت کے لئے جعلی ٹوٹ پھوٹ کا استعمال کیا جاتا ہے.
- سپر ٹرینڈ ایک متحرک اسٹاپ نقصان کے طور پر کام کرتا ہے ، جس سے رجحان کو زیادہ سے زیادہ فائدہ ہوتا ہے اور اس سے زیادہ واپسی سے بچا جاتا ہے۔
- مختلف ٹائم پیکیج کے ساتھ مل کر فاریکس ٹریڈنگ کے فوائد کا تعین کرنے کے لئے ، اعلی اور کم بیج سگنل کی تصدیق زیادہ قابل اعتماد ہے۔
- ٹائمنگ پیسٹ فنکشن کسی خاص وقت کے غیر معقول طرز عمل کے اثرات سے بچنے کے لئے۔
اسٹریٹجک رسک
- جب رجحان الٹ جاتا ہے تو اس کا خاتمہ کرنا آسان ہے۔ اس خطرے کو کم کرنے کے لئے اسٹاپ لائن کو مناسب طریقے سے نرمی دی جاسکتی ہے۔
- سپر ٹرینڈ پیرامیٹرز کی غلط ترتیب سے اسٹاپ نقصان بہت وسیع یا بہت تنگ ہوسکتا ہے۔ مختلف پیرامیٹرز کے مجموعے کی جانچ کی جاسکتی ہے۔
- فنڈ مینجمنٹ کے مسائل پر غور نہیں کیا گیا۔ پوزیشن کنٹرول قائم کیا جانا چاہئے۔
- ٹرانزیکشن لاگت کو مدنظر نہیں رکھا گیا ہے۔ لاگت کے اثرات کا اندازہ لگایا جانا چاہئے۔
حکمت عملی کی اصلاح کی سمت
- سپر ٹرینڈ پیرامیٹرز کے مجموعے کو بہتر بنائیں ، بہترین پیرامیٹرز تلاش کریں۔
- اضافی پوزیشن کنٹرول۔
- اضافی لاگت کے عوامل جیسے ٹرانسمیشن فیس، سلائڈ پوائنٹس وغیرہ۔
- اسٹاپ نقصان کی حد کو رجحان کی طاقت اور کمزوری کے مطابق لچکدار طریقے سے ایڈجسٹ کیا جاسکتا ہے۔
- دوسرے اشارے کے ساتھ مل کر انٹری سگنل کو فلٹر کرنے پر غور کریں۔
خلاصہ کریں۔
اس حکمت عملی میں ہیکن آشی اور سپر ٹرینڈ دونوں اشارے کی خوبیوں کو مربوط کیا گیا ہے ، جو رجحان کی سمت کو پکڑنے کے قابل ہے ، جبکہ سپر ٹرینڈ کا استعمال کرتے ہوئے خود کار طریقے سے متحرک ٹریکنگ اسٹاپ نقصان کو لاک کرنے کے لئے کیا جاتا ہے۔ حکمت عملی کا خطرہ بنیادی طور پر رجحان کی تبدیلی اور پیرامیٹرز کی اصلاح سے آتا ہے ، ان دونوں پہلوؤں کو مزید اصلاح کے ذریعہ بہتر بنایا جاسکتا ہے۔ مجموعی طور پر ، اس حکمت عملی میں اشارے کے انضمام کا استعمال تجارتی نظام کی استحکام اور منافع کی جگہ کو بہتر بناتا ہے۔
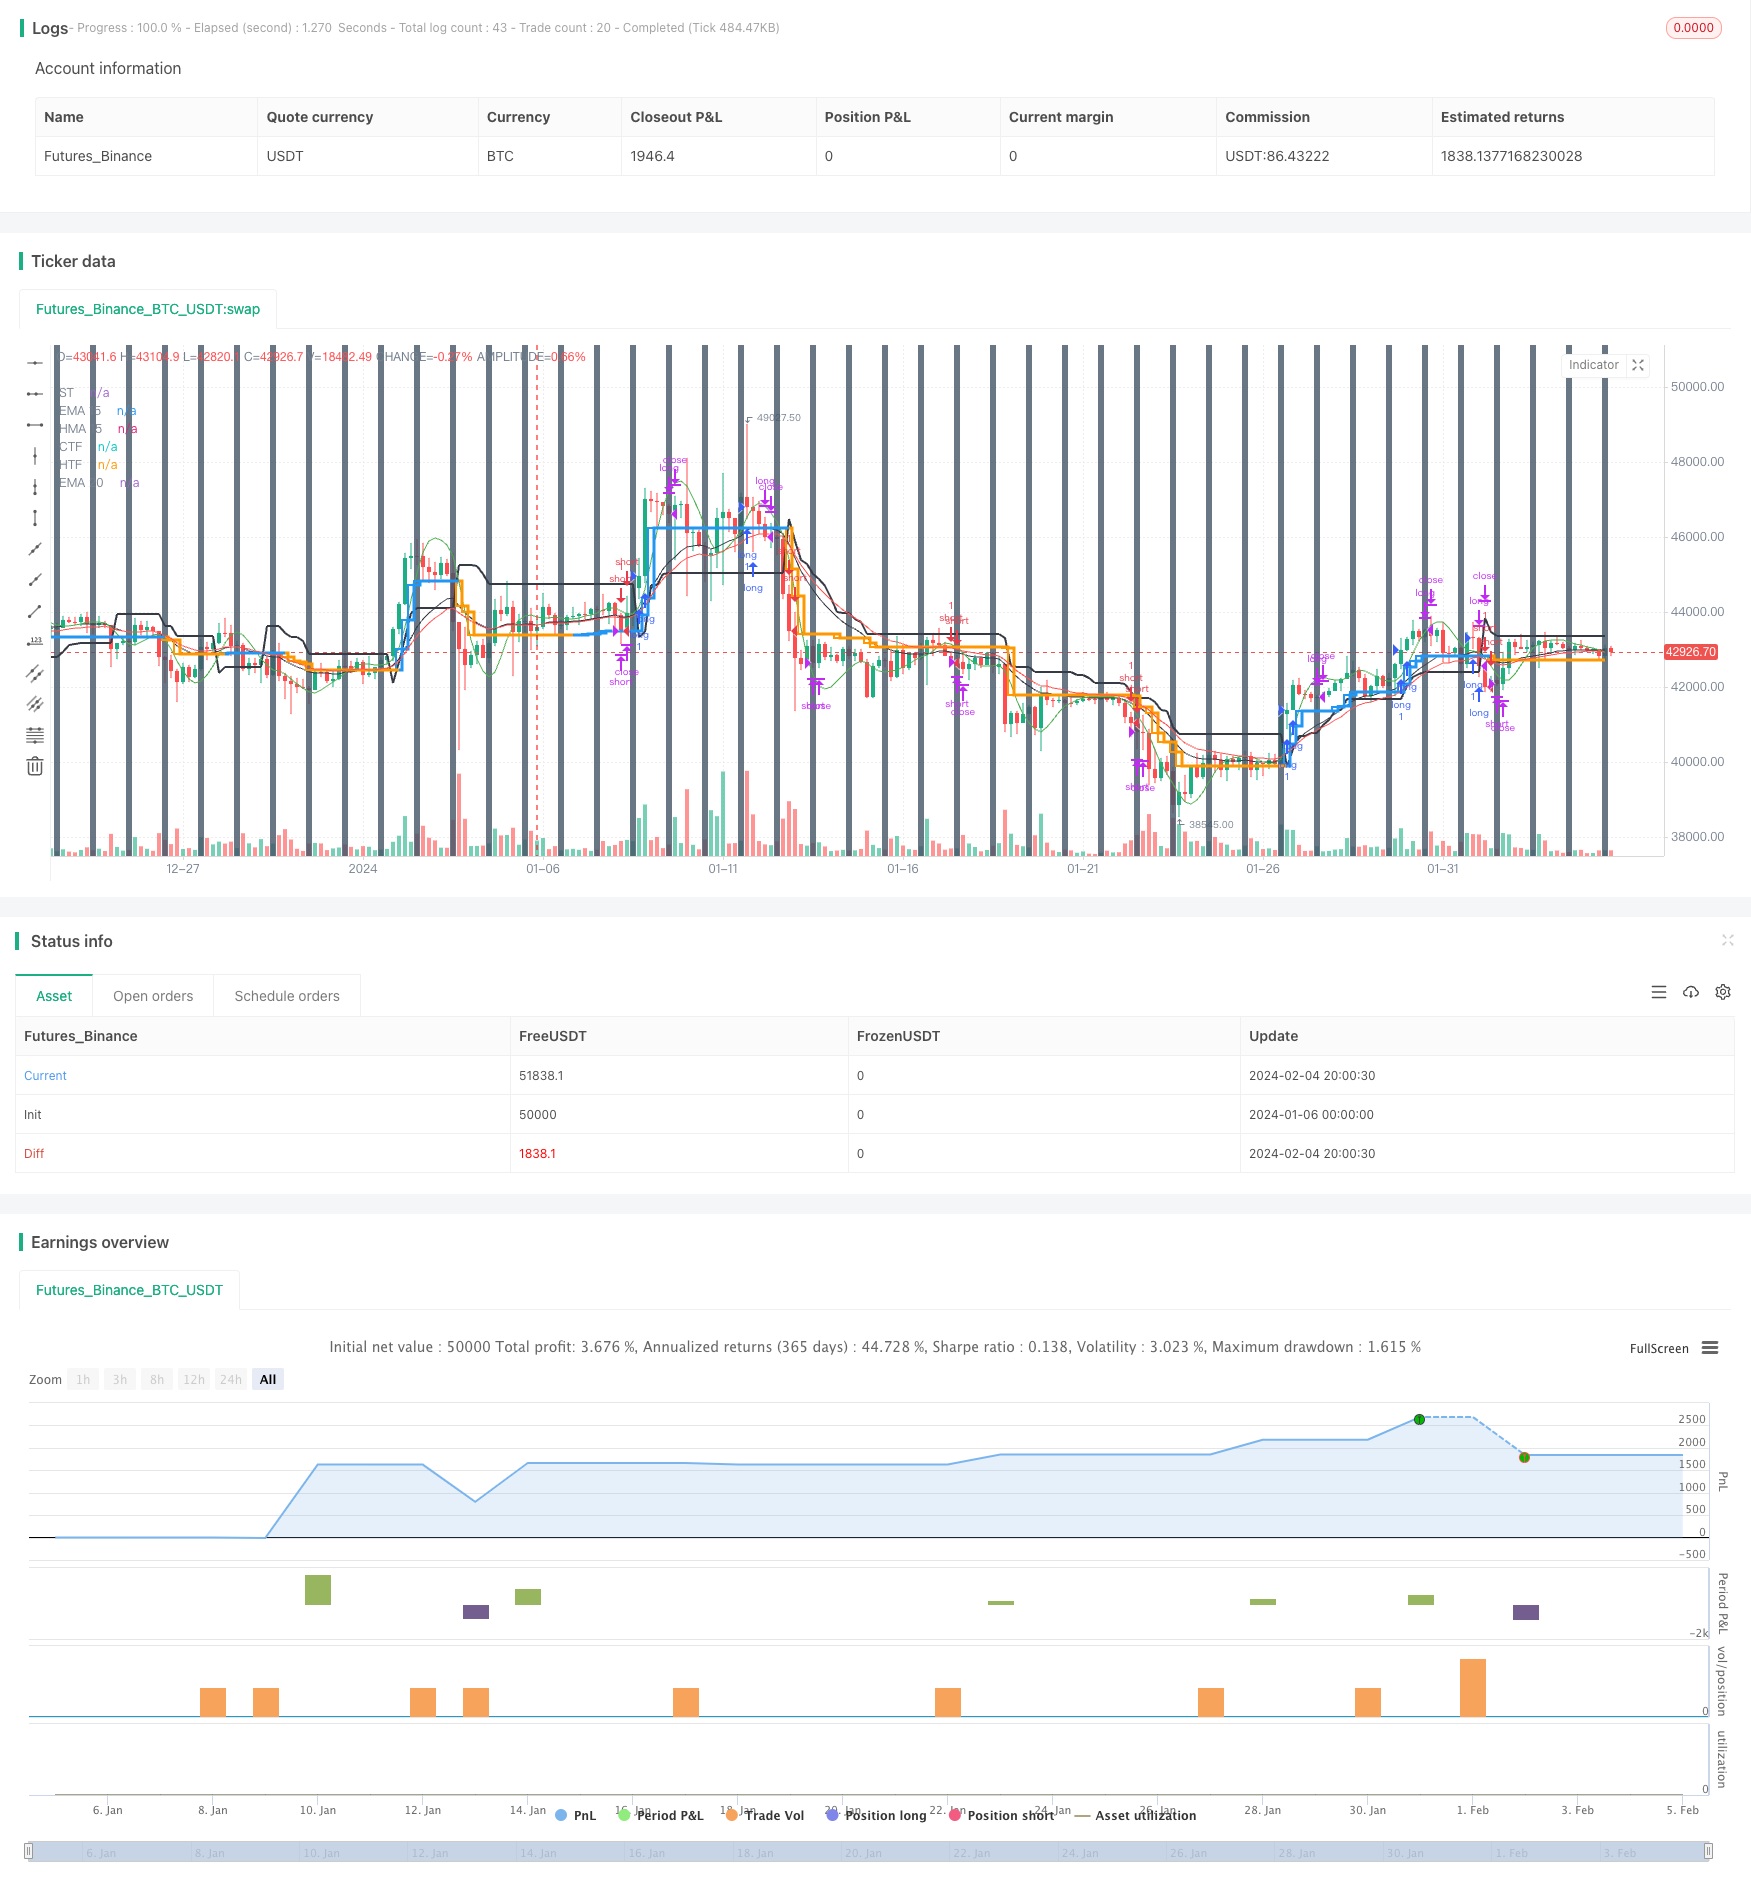
/*backtest
start: 2024-01-06 00:00:00
end: 2024-02-05 00:00:00
period: 4h
basePeriod: 15m
exchanges: [{"eid":"Futures_Binance","currency":"BTC_USDT"}]
*/

// This source code is subject to the terms of the Mozilla Public License 2.0 at https://mozilla.org/MPL/2.0/
// © ringashish

//@version=4
strategy("sa-strategy with HTF-TSL", overlay=true)


Pd = input(title="ATR Period", type=input.integer, defval=4)
Factor = input(title="ATR Multiplier", type=input.float, step=0.1, defval=2)
ST= supertrend(Factor, Pd)

heikinashi_close = security(heikinashi(syminfo.tickerid), timeframe.period, close)
heikinashi_low = security(heikinashi(syminfo.tickerid), timeframe.period, low)
heikinashi_open = security(heikinashi(syminfo.tickerid), timeframe.period, open)
heikinashi_high = security(heikinashi(syminfo.tickerid), timeframe.period, high)

heikinashi_close30 = security(heikinashi(syminfo.tickerid), "30", close)
//res1 = input("30", type=input.resolution, title="higher Timeframe")


//CCI TSL

res = input("240",type=input.resolution,title = "Higher Time Frame")
CCI = input(20)
ATR = input(5)
Multiplier=input(1,title='ATR Multiplier')
original=input(false,title='original coloring')
thisCCI = cci(close, CCI)
lastCCI = nz(thisCCI[1])


calcx()=>
    bufferDn= high + Multiplier * sma(tr,ATR)
    bufferUp= low - Multiplier * sma(tr,ATR)
    if (thisCCI >= 0 and lastCCI < 0)
        bufferUp := bufferDn[1]
    if (thisCCI <= 0 and lastCCI > 0)
        bufferDn := bufferUp[1]

    if (thisCCI >= 0)
        if (bufferUp < bufferUp[1])
            bufferUp := bufferUp[1]
    else
        if (thisCCI <= 0)
            if (bufferDn > bufferDn[1])
                bufferDn := bufferDn[1]


    x = 0.0
    x := thisCCI >= 0 ?bufferUp:thisCCI <= 0 ?bufferDn:x[1]
    x

tempx = calcx()

calcswap() =>
    swap = 0.0
    swap := tempx>tempx[1]?1:tempx<tempx[1]?-1:swap[1]
    swap

tempswap = calcswap()

swap2=tempswap==1?color.blue:color.orange
swap3=thisCCI >=0 ?color.blue:color.orange
swap4=original?swap3:swap2

//display current timeframe's Trend

plot(tempx,"CTF",color=swap4,transp=0,linewidth=2, style = plot.style_stepline)


htfx = security(syminfo.tickerid,res,tempx[1],lookahead = barmerge.lookahead_on)
htfswap4 = security(syminfo.tickerid,res,swap4[1],lookahead = barmerge.lookahead_on)

plot(htfx,"HTF",color=htfswap4,transp=0,linewidth=3,style = plot.style_stepline)


//supertrend
Supertrend(Factor, Pd) =>
    Up=hl2-(Factor*atr(Pd))
    Dn=hl2+(Factor*atr(Pd))

    TrendUp = 0.0
    TrendUp := heikinashi_close[1]>TrendUp[1] ? max(Up,TrendUp[1]) : Up
    TrendDown = 0.0
    TrendDown := heikinashi_close[1]<TrendDown[1]? min(Dn,TrendDown[1]) : Dn
    Trend = 0.0
    Trend := heikinashi_close > TrendDown[1] ? 1: heikinashi_close< TrendUp[1]? -1: nz(Trend[1],1)
    Tsl = Trend==1? TrendUp: TrendDown

    S_Buy = Trend == 1 ? 1 : 0
    S_Sell = Trend != 1 ? 1 : 0

    [Trend, Tsl]

[Trend,Tsl] = Supertrend(Factor, Pd)
// Security
//ST1_Trend_MTF = security(syminfo.tickerid, res1, Tsl,barmerge.lookahead_on)
//plot(ST1_Trend_MTF, "higher ST")

crossdn = crossunder(heikinashi_close,Tsl) or crossunder(heikinashi_close[1],Tsl) or crossunder(heikinashi_close[2],Tsl) or heikinashi_close < Tsl
crossup = crossover(heikinashi_close,Tsl) or crossover(heikinashi_close[1],Tsl) or crossover(heikinashi_close[2],Tsl) or heikinashi_close > Tsl
plot(Tsl,"ST",color = color.black,linewidth =2)
plot(ema(heikinashi_close,20),"EMA 20",color=color.red)
plot(hma(heikinashi_close,15),"HMA 15",color=color.green)
plot(ema(heikinashi_close,15),"EMA 15",color=color.black)

closedown = (heikinashi_close < hma(heikinashi_close,15) and heikinashi_high > hma(heikinashi_close,15)) or(heikinashi_close < ema(heikinashi_close,20) and heikinashi_high > ema(heikinashi_close,20))
closeup = (heikinashi_close > hma(heikinashi_close,15) and heikinashi_low < hma(heikinashi_close,15)) or (heikinashi_close > ema(heikinashi_close,20) and heikinashi_low < ema(heikinashi_close,20))

buy = heikinashi_open == heikinashi_low and closeup and crossup  and close > htfx
//buy = heikinashi_open == heikinashi_low and heikinashi_close > ema(close,20) and heikinashi_low < ema(close,20) and crossup
buyexit = cross(close,tempx) //heikinashi_open == heikinashi_high //and heikinashi_close < ema(close,15) and heikinashi_high > ema(close,15)

//if heikinashi_close30[1] < ST1_Trend_MTF
//sell = heikinashi_open == heikinashi_high and heikinashi_close < ema(close,20) and heikinashi_high > ema(close,20) and rsi(close,14)<60 and crossdn
sell = heikinashi_open == heikinashi_high and closedown and rsi(close,14)<55 and crossdn  and close < htfx
sellexit = cross(close,tempx) //heikinashi_open == heikinashi_low //and heikinashi_close > ema(close,15) and heikinashi_low < ema(close,15)

rg = 0
rg := buy ? 1 : buyexit ? 2 : nz(rg[1])

longLogic = rg != rg[1] and rg == 1
longExit = rg != rg[1] and rg == 2

//plotshape(longExit,"exit buy",style = shape.arrowup,location = location.belowbar,color = color.red, text ="buy exit", textcolor = color.red)
//plotshape(longLogic,"BUY",style = shape.arrowup,location = location.belowbar,color = color.green, text ="buy", textcolor= color.green)

nm = 0
nm := sell ? 1 : sellexit ? 2 : nz(nm[1])

shortLogic = nm != nm[1] and nm == 1
shortExit = nm != nm[1] and nm == 2

//plotshape(shortExit,"exit sell",style = shape.arrowup,location = location.belowbar,color = color.red, text ="sell exit", textcolor = color.red)
//plotshape(shortLogic,"SELL",style = shape.arrowup,location = location.belowbar,color = color.green, text ="sell", textcolor= color.green)


//Exit at particular time

ExitHour = input(title="Exit Hour Of Day", type=input.integer, defval=15, step = 5, maxval = 24, minval = 0)
ExitMint = input(title="Exit Minute Of Day", type=input.integer, defval=15, step = 5, maxval = 24, minval = 0)
bgc = input(title="Highlight Background Color?", type=input.bool, defval=true)
mRound(num,rem) => (floor(num/rem)*rem)
exitTime = (hour(time) >= ExitHour and (minute == mRound(ExitMint, timeframe.multiplier))) ? 1 : 0
exitTime := exitTime == 0 ? (hour(time) >= ExitHour and (minute + timeframe.multiplier >= ExitMint)) ? 1 : 0 : exitTime

MarketClose =  exitTime and not exitTime[1]

alertcondition(exitTime and not exitTime[1], title="Intraday Session Close Time", message="Close All Positions")
bgcolor(exitTime and not exitTime[1] and bgc ? #445566 : na, transp =40)


longCondition = longLogic
if (longCondition)
    strategy.entry("long", strategy.long)


shortCondition = shortLogic
if (shortCondition)
    strategy.entry("short", strategy.short)


strategy.close("short", when =cross(close,tempx)  or MarketClose)
strategy.close( "long", when =cross(close,tempx) or MarketClose )