تین K-لائن ٹرینڈ ریورسل حکمت عملی
جائزہ
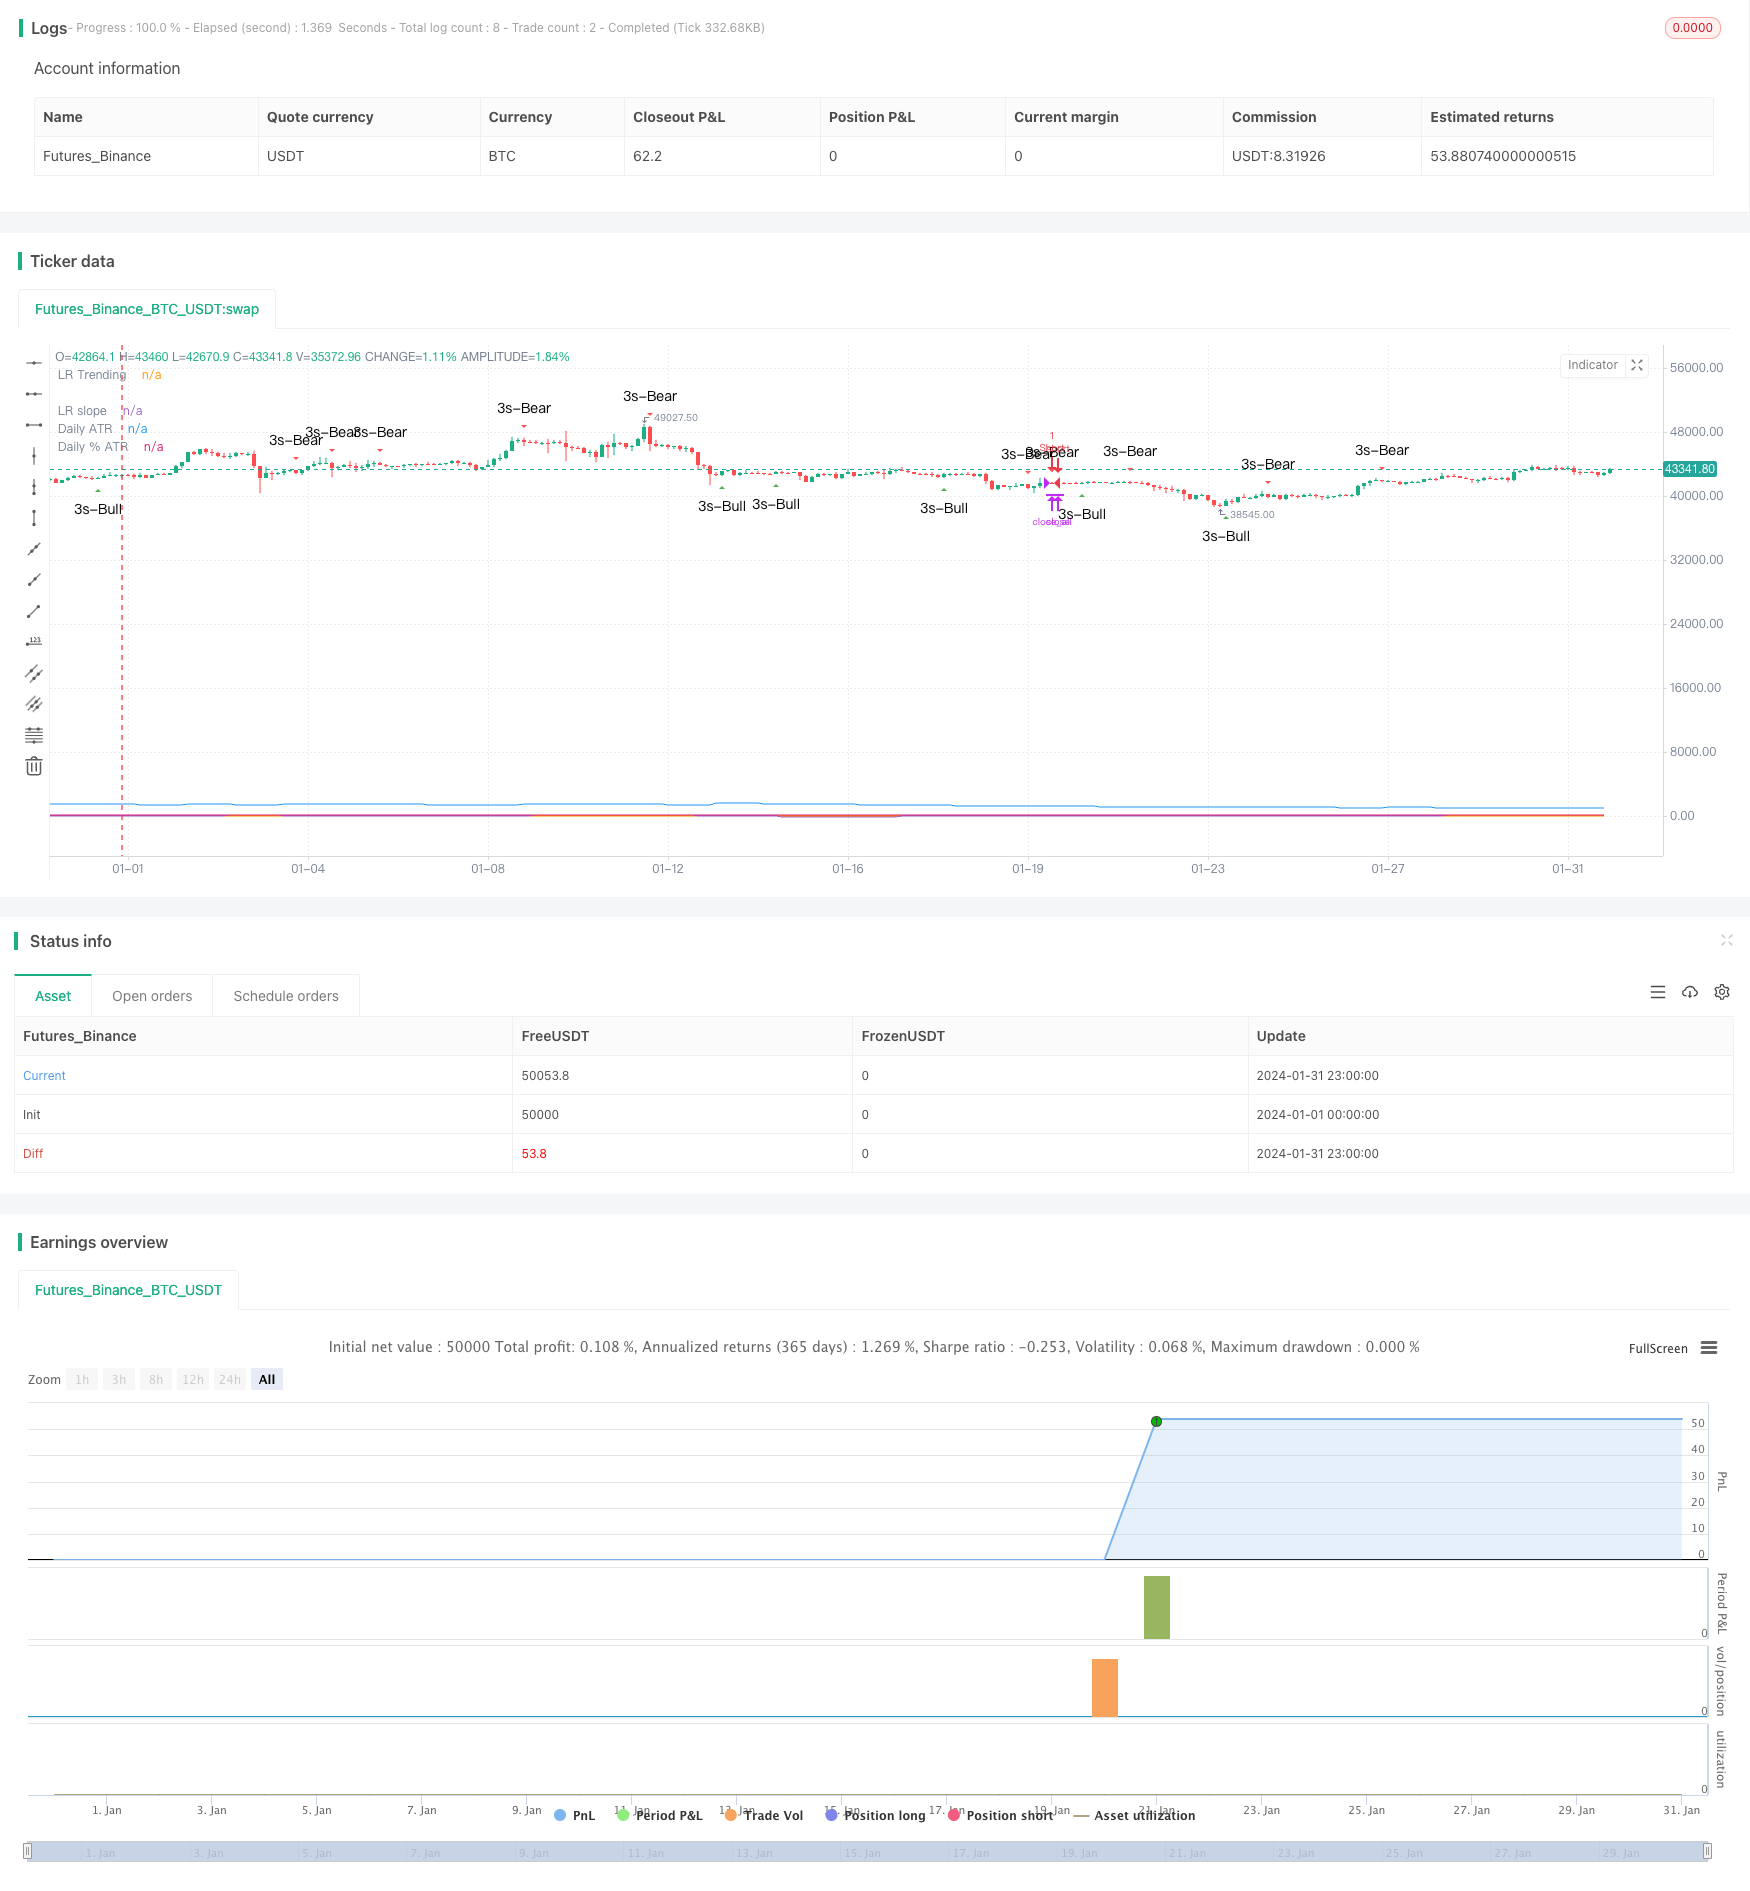
تین موم بتیوں کے الٹ رجحان کی حکمت عملی ایک مختصر لائن ٹریڈنگ حکمت عملی ہے جو مختصر لائن کے رجحان کے الٹ ہونے کا تعین کرنے کے لئے تین مسلسل یارن یا یارن کی نشاندہی کرتی ہے ، جس کے بعد ایک نگلنے والی K لائن ہے ، جس میں متعدد تکنیکی اشارے شامل ہیں۔ اس حکمت عملی میں 1: 3 کے اسٹاپ نقصان اور اسٹاپ نقصان کا تناسب ہے ، جو اضافی منافع حاصل کرنے کے لئے موزوں ہے۔
حکمت عملی کا اصول
اس حکمت عملی کا بنیادی منطق یہ ہے کہ تین مسلسل پالو لائن یا پالو لائن کی K لائن کی شکل کی نشاندہی کی جائے ، جو عام طور پر قلیل مدتی رجحان کی تبدیلی کی نشاندہی کرتی ہے۔ جب تین پالو لائنوں کا پتہ چلتا ہے تو ، اگلی نگلنے والی پالو لائن آنے تک انتظار کریں ، زیادہ کام کریں۔ اس کے برعکس ، جب تین پالو لائنوں کا پتہ چلتا ہے تو ، اگلی نگلنے والی نگلنے والی پالو لائن آنے تک ، خالی ہوجائیں۔
اس کے علاوہ ، حکمت عملی میں داخلے کے وقت کو فلٹر کرنے کے لئے متعدد تکنیکی اشارے بھی متعارف کروائے گئے ہیں۔ ایس ایم اے اوسط ، جس میں دو مختلف پیرامیٹرز کی ترتیب ہے ، صرف اس وقت غور کیا جاتا ہے جب وہ تیز لائن پر سست لائن کو عبور کرتے ہیں۔ اس کے علاوہ ، مارکیٹ میں ہلچل اور رجحان کی حالت کا فیصلہ کرنے کے لئے لکیری رجعت اشارے کا استعمال کیا جاتا ہے ، اور صرف رجحان کی حالت میں ہی تجارت کی جاتی ہے۔ حکمت عملی میں ایک سوئچ بھی فراہم کیا گیا ہے ، جس میں یہ منتخب کیا جاسکتا ہے کہ آیا اس میں گولڈ کراسنگ ہوتی ہے یا نہیں۔ ان اشارے کے مجموعی فیصلے سے ، زیادہ تر شور کو فلٹر کیا جاسکتا ہے ، اور داخلے کی درستگی کو بہتر بنایا جاسکتا ہے۔
اسٹاپ نقصان کی حد کی ترتیب پر ، حکمت عملی کا تقاضا ہے کہ خطرہ کی واپسی کا تناسب 1: 3 سے کم نہ ہو۔ اسٹاپ نقصان کی حد کی ترتیب کا حساب لگانے کے لئے ، حالیہ این روٹ کے لائن کی اتار چڑھاؤ کی شدت کے اے ٹی آر اشارے کا حساب لگانا ، اتار چڑھاؤ کی شدت کے فیصد کے ساتھ مل کر ، اور پھر اسٹاپ کی سطح کا حساب لگانا۔ اس طرح ایک خاص خطرہ برداشت کرنے کی شرط پر مناسب اضافی واپسی حاصل کی جاسکتی ہے۔
اسٹریٹجک فوائد
تین K لائن رجحانات کی واپسی کی حکمت عملی کے فوائد ہیں:
- مختصر مدت کے رجحانات کی تبدیلی کی شناخت اور مواقع کو بروقت فائدہ اٹھانا
- زیادہ سے زیادہ اشارے کو فلٹر کریں اور زیادہ سے زیادہ درستگی حاصل کریں
- نقصانات کو روکنے کا طریقہ کار معقول ہے ، اور خطرہ معتدل ہے
- سادہ پیرامیٹرز کی ترتیب، آپریشن کو سمجھنے کے لئے آسان
اسٹریٹجک رسک
اس حکمت عملی کے کچھ خطرات بھی ہیں جن کے بارے میں آگاہ ہونا ضروری ہے:
- مختصر مدت میں الٹ جانا لازمی طور پر طویل مدتی رجحانات کی الٹ نہیں ہے ، اس لئے اعلی مدت کے رجحانات پر توجہ دینے کی ضرورت ہے۔ آپ فلٹرنگ کی شرائط کے طور پر طویل مدت کی اوسط لائن ترتیب دے سکتے ہیں۔
- ایک واحد K لائن شکل سگنل میں غلط فہمی پیدا ہوسکتی ہے ، اور اس کے علاوہ دیگر معاون فیصلہ سگنل شامل کرنے پر غور کیا جاسکتا ہے۔
- اسٹاپ نقصان کی ترتیب ممکنہ طور پر زیادہ پرامید ہوسکتی ہے ، اور اسٹاپ نقصان کی حد کو مناسب طریقے سے تنگ کیا جاسکتا ہے۔
- اس کے علاوہ ، اس نے کہا ہے کہ اس نے اس کے بارے میں کوئی معلومات نہیں دی ہے ، اور اس نے کہا ہے کہ اس کے بارے میں کوئی معلومات نہیں ہے۔
حکمت عملی کی اصلاح کی سمت
اس حکمت عملی کو مندرجہ ذیل طریقوں سے بہتر بنایا جاسکتا ہے:
- اوسط اور لکیری رجعت کے پیرامیٹرز کو ایڈجسٹ کریں تاکہ رجحان کی حالت کا اندازہ لگانے کے لئے بہتر بنایا جاسکے
- اسٹوچ اشارے جیسے دیگر معاون فیصلہ کن اشارے شامل کریں ، سگنل کی درستگی کو بہتر بنائیں
- اے ٹی آر پیرامیٹرز اور اسٹاپ نقصان کی حد کے پیرامیٹرز کی ترتیبات کو بہتر بنانا ، خطرہ اور منافع کو متوازن کرنا
- ٹرینڈ بریک پوائنٹ ٹریکنگ میکانزم کو بڑھانا اور منافع بخش صلاحیت کو بہتر بنانا
- زیادہ سخت فنڈ مینجمنٹ کی حکمت عملی بنانا اور ٹریڈنگ کے خطرات کو کنٹرول کرنا
خلاصہ کریں۔
مجموعی طور پر ، تینوں K لائن الٹ رجحان کی حکمت عملی ایک مختصر لائن ٹریڈنگ حکمت عملی ہے جو مناسب خطرے سے فائدہ اٹھانے کے توازن پر مبنی ہے ، جس میں قیمتوں کی سادہ شکلوں کے ساتھ متعدد معاون اشارے کے فیصلے شامل ہیں۔ اس نے کم پیچیدگی کے ساتھ اچھی کارکردگی کا مظاہرہ کیا ، سرمایہ کاروں کی توجہ اور جانچ کے قابل ، اور بہت ساری جگہ میں بہتری ہے۔ پیرامیٹرز کی اصلاح اور ضابطے کی تکمیل کے ذریعہ ، اس کی امید ہے کہ یہ ایک مستحکم اور اعلی کارکردگی کی مقدار کی تجارت کی حکمت عملی بن جائے۔
/*backtest
start: 2024-01-01 00:00:00
end: 2024-01-31 23:59:59
period: 3h
basePeriod: 15m
exchanges: [{"eid":"Futures_Binance","currency":"BTC_USDT"}]
*/

// This source code is subject to the terms of the Mozilla Public License 2.0 at https://mozilla.org/MPL/2.0/
// © platsn
//
// Mainly developed for SPY trading on 1 min chart. But feel free to try on other tickers.

// Basic idea of this strategy is to look for 3 candle reversal pattern within trending market structure. The 3 candle reversal pattern consist of 3 consecutive bullish or bearish candles,
// followed by an engulfing candle in the opposite direction. This pattern usually signals a reversal of short term trend. This strategy also uses multiple moving averages to filter long or short
// entries. ie. if the 21 smoothed moving average is above the 50, only look for long (bullish) entries, and vise versa. There is option change these moving average periods to suit your needs.
// I also choose to use Linear Regression to determine whether the market is ranging or trending. It seems the 3 candle pattern is more successful under trending market. Hence I use it as a filter.

// There is also an option to combine this strategy with moving average crossovers. The idea is to look for 3 canddle pattern right after a fast moving average crosses over a slow moving average.
// By default , 21 and 50 smoothed moving averages are used. This gives additional entry opportunites and also provides better results.

// This strategy aims for 1:3 risk to reward ratio. Stop losses are calculated using the closest low or high values for long or short entries, respectively, with an offset using a percentage of
// the daily ATR value. This allows some price flucuation without being stopped out prematurely. Price target is calculated by multiplying the difference between the entry price and the stop loss
// by a factor of 3. When price target is reach, this strategy will set stop loss at the price target and wait for exit considion to maximize potential profit.

// This strategy will exit an order if an opposing 3 candle pattern is detected, this could happend before stop loss or price target is reached, and may also happen after price target is reached.

// *Note that this strategy is designed for same day SPY option scalping. I haven't determined an easy way to calculate the # of contracts to represent the equivalent option values. Plus the option
// prices varies greatly depending on which strike and expiry that may suits your trading style. Therefore, please be mindful of the net profit shown. By default, each entry is approxiately equal
// to buying 10 of same day or 1 day expiry call or puts at strike $1 - $2 OTM. This strategy will close all open trades at 3:45pm EST on Mon, Wed, and Fri.

// **Note that this strategy also takes into account of extended market data.

// ***Note pyramiding is set to 2 by default, so it allows for multiple entries on the way towards price target.

// Remember that market conditions are always changing. This strategy was only able to be backtested using 1 month of data. This strategy may not work the next month. Please keep that in mind.

// *****************************************************************************************************************************************************************************************************

//@version=5
strategy("3 Candle Strike Stretegy", overlay=true, pyramiding=2, initial_capital=5000, commission_type=strategy.commission.cash_per_contract, commission_value = 0.01)

// ******************** Period **************************************
startY = input(title='Start Year', defval=2011, group = "Trading window")
startM = input.int(title='Start Month', defval=1, minval=1, maxval=12, group = "Trading window")
startD = input.int(title='Start Day', defval=1, minval=1, maxval=31, group = "Trading window")
finishY = input(title='Finish Year', defval=2050, group = "Trading window")
finishM = input.int(title='Finish Month', defval=12, minval=1, maxval=12, group = "Trading window")
finishD = input.int(title='Finish Day', defval=31, minval=1, maxval=31, group = "Trading window")
timestart = timestamp(startY, startM, startD, 00, 00)
timefinish = timestamp(finishY, finishM, finishD, 23, 59)
t1 = time(timeframe.period, "0930-1545:23456")
window = true

// *****************************************************

isSPY = input.bool(defval=true,title="SPY trading only", group = "Trading Options")
SPY_option = input.int(defval=10,title="# of SPY options per trade", group = "Trading Options")
reinvest = input.bool(defval=false,title="reinvest profit?", group = "Trading Options")
src = close

// ***************************************************************************************************** Daily ATR *****************************************************
// Inputs
atrlen = input.int(14, minval=1, title="ATR period", group = "Daily ATR")
iPercent = input.float(5, minval=1, maxval=100, step=0.1, title="% ATR to use for SL / PT", group = "Daily ATR")
// PTPercent = input.int(100, minval=1, title="% ATR for PT")

// Logic
percentage = iPercent * 0.01
datr = request.security(syminfo.tickerid, "1D", ta.rma(ta.tr, atrlen))
datrp = datr * percentage
// datrPT = datr * PTPercent * 0.01

plot(datr,"Daily ATR")
plot(datrp, "Daily % ATR")

// ***************************************************************************************************************** Moving Averages ************************

len0 = input.int(8, minval=1, title='Fast EMA', group= "Moving Averages")
ema1 = ta.ema(src, len0)

len1 = input.int(21, minval=1, title='Fast SMMA', group= "Moving Averages")
smma1 = 0.0
sma_1 = ta.sma(src, len1)
smma1 := na(smma1[1]) ? sma_1 : (smma1[1] * (len1 - 1) + src) / len1

len2 = input.int(50, minval=1, title='Slow SMMA', group= "Moving Averages")
smma2 = 0.0
sma_2 = ta.sma(src, len2)
smma2 := na(smma2[1]) ? sma_2 : (smma2[1] * (len2 - 1) + src) / len2

len3 = input.int(200, minval=1, title='Slow SMMA', group= "Moving Averages")
smma3 = 0.0
sma_3 = ta.sma(src, len3)
smma3 := na(smma3[1]) ? sma_3 : (smma3[1] * (len3 - 1) + src) / len3

ma_bull = smma1 > smma2 and smma1 > smma1[1]
ma_bear = smma1 < smma2 and smma1 < smma1[1]

ma_bull_macro = smma1 > smma3 and smma2 > smma3
ma_bear_macro = smma1 < smma3 and smma2 < smma3

// plot(ma_bull? 1 : 0, "MA bull")
// plot(ma_bear? 1 : 0 , "MA bear")

// **************************************************************************************************************** Linear Regression *************************

//Input
clen = input.int(defval = 50, minval = 1, title = "Linear Regression Period", group = "Linear Regression")
slen = input.int(defval=50, minval=1, title="LR Slope Period" , group = "Linear Regression")
glen = input.int(defval=14, minval=1, title="LR Signal Period", group = "Linear Regression")
LR_thres = input.float(0.03, minval=0, step=0.001, title="LR Threshold for Ranging vs Trending" , group = "Linear Regression")

//Linear Regression Curve
lrc = ta.linreg(src, clen, 0)
//Linear Regression Slope
lrs = (lrc-lrc[1])/1
//Smooth Linear Regression Slope
slrs = ta.ema(lrs, slen)
//Signal Linear Regression Slope
alrs = ta.sma(slrs, glen)

up_accel = lrs > alrs and lrs > 0
down_accel = lrs < alrs and lrs < 0

LR_ranging  = math.abs(slrs) <= LR_thres
LR_trending = math.abs(slrs) > LR_thres

plot(slrs, "LR slope")
plot(LR_trending?1:0, "LR Trending")

// *********************************************************************************************************************************** Candle conditions **************************

bull_3s = close[3] <= open[3] and close[2] <= open[2] and close[1] <= open[1] and close > open[1]
bear_3s = close[3] >= open[3] and close[2] >= open[2] and close[1] >= open[1] and close < open[1]

plotshape(bull_3s, style=shape.triangleup, color=color.new(color.green, 0), location=location.belowbar, size=size.small, text='3s-Bull', title='3 Line Strike Up')
plotshape(bear_3s, style=shape.triangledown, color=color.new(color.red, 0), location=location.abovebar, size=size.small, text='3s-Bear', title='3 Line Strike Down')

// ***************************************************************************************************************************************** SL & PT ***********************************
RR = input.float(3.0, minval = 1, step = 0.1, title="Reward to Risk Ratio", group = "Trading Options")

barsSinceLastEntry()=>
    strategy.opentrades > 0 ? (bar_index - strategy.opentrades.entry_bar_index(strategy.opentrades-1)) : na

last_high = math.max(high, high[1], high[2], high[3])
last_low = math.min(low, low[1], low[2], low[3])

long_SL = last_low - datrp
short_SL = last_high + datrp

long_PT = last_high
short_PT = last_low

last_entry = strategy.opentrades.entry_price(strategy.opentrades-1)
risk = last_entry - long_SL

if strategy.opentrades > 0
    long_SL := math.min(long_SL[barsSinceLastEntry()], last_low)
    short_SL := math.max(short_SL[barsSinceLastEntry()], last_high)
    risk := last_entry - long_SL
    long_PT := last_entry + (last_entry - long_SL) * RR
    short_PT := last_entry - (short_SL - last_entry) * RR
else
    long_PT := open + (open - long_SL) * RR
    short_PT := open - (short_SL - open) * RR

// plot(short_SL,title = "Short SL", color=color.new(color.purple,30))
// plot(long_SL,title = "Long SL", color=color.new(color.purple,30))
// plot(long_PT,title = "Long PT", color=color.new(color.white,50))
// plot(short_PT,title = "Short PT", color=color.new(color.white,50))
// plot(last_entry, title = "Last entry")
// plot(risk, title = "Risk")

// **************************************************************************************************************************************** Trade Pauses ****************************************
bool trade_pause = false
bool trade_pause2 = false

if high - low > datr*0.3
    trade_pause := true
else
    trade_pause := false

no_longat10 = input.bool(true, title="No long entry between 10 - 10:30 (Avoid 10 am dump)", group = "Trading Options")

// ************************************************************************************************************************************ Entry conditions **************************

trade_3s = input.bool(title='Trade 3s candle pattern', defval=true, group = "Trading Options")
L_entry1 = bull_3s and ma_bull and LR_trending
S_entry1 = bear_3s and ma_bear and LR_trending

trade_ma_reversal = input.bool(title='Trade MA Cross Reversal Signal', defval=true, group = "Trading Options")
L_entry2 = ma_bear_macro and ema1 > smma1 and bull_3s and ta.barssince(ta.cross(ema1,smma1)) < 10
S_entry2 = ma_bull_macro and ema1 < smma1 and bear_3s and ta.barssince(ta.cross(ema1,smma1)) < 10

// ************************************************************************************************************************************** Exit Conditions ********************************

// bsle_thres = input.int(0, "Bar since entry threshold")

// exit0 = barsSinceLastEntry() >= bsle_thres
exit0 = true

L_exit1 = bear_3s
S_exit1 = bull_3s

// ************************************************************************************************************************************ Entry and Exit orders *****************************
strategy.initial_capital = 50000
trade_amount = math.floor(strategy.initial_capital / close)

if isSPY
    if strategy.netprofit > 0 and reinvest
        trade_amount := math.floor((strategy.initial_capital + strategy.netprofit) * 0.2 / 600) * 10 * SPY_option
    else
        trade_amount := math.floor(strategy.initial_capital * 0.2 / 600) * 10 * SPY_option


if not(trade_pause) and not(trade_pause2) and time(timeframe.period, "0930-1540:23456")
    if trade_3s
        if not(time(timeframe.period, "1000-1030:23456")) and no_longat10
            strategy.entry("Long", strategy.long, 1, when = L_entry1 and window, comment="Long 3s" + " SL=" + str.tostring(math.round(long_SL,2)) + " PT=" + str.tostring(math.round(long_PT,2)))
        strategy.entry("Short", strategy.short, 1, when = S_entry1 and window, comment = "Short 3s" + " SL=" + str.tostring(math.round(short_SL,2)) + " PT=" + str.tostring(math.round(short_PT,2)))
    if trade_ma_reversal
        strategy.entry("Long", strategy.long, 1, when = L_entry2 and window, comment="Long MA cross" + " SL=" + str.tostring(math.round(long_SL,2)) + " PT=" + str.tostring(math.round(long_PT,2)))
        strategy.entry("Short", strategy.short, 1, when = S_entry2 and window, comment = "Short MA corss" + " SL=" + str.tostring(math.round(short_SL,2)) + " PT=" + str.tostring(math.round(short_PT,2)))

if high > long_PT
    long_SL := low[1]
    strategy.exit("Exit", "Long", when = exit0 and low < long_PT, stop= long_SL, comment = "Exit Long SL/PT hit")
strategy.close("Long", when = L_exit1, comment = "Exit on Bear Signal")

if low < short_PT
    short_SL := high[1]
    strategy.exit("Exit", "Short", when= exit0 and high > short_PT, stop= short_SL, comment = "Exit Short SL/PT hit")
strategy.close("Short", when = S_exit1, comment = "Exit on Bull Signal")

if time(timeframe.period, "1545-1600:246")
    strategy.close_all()