
ملٹی ٹائم فریم ٹرینڈ ہنٹر حکمت عملی ایک حکمت عملی ہے جس میں متعدد اشارے استعمال کیے جاتے ہیں جو خود کار طریقے سے ٹریڈنگ سگنل کو پورا کرتے ہیں۔ یہ حکمت عملی متحرک اوسط ، سپر ٹرینڈ اشارے اور ایک کلاؤڈ گراف اشارے وغیرہ کا استعمال کرتے ہوئے متعدد ٹائم فریموں میں رجحان کی سمت کا فیصلہ کرتی ہے تاکہ ممکنہ تجارتی مواقع کا پتہ لگایا جاسکے۔
اس حکمت عملی کا بنیادی اصول یہ ہے کہ اعلی ٹائم فریم اور نچلے ٹائم فریم میں ایک ہی وقت میں رجحان کی سمت کا فیصلہ کریں۔ حکمت عملی پہلے اعلی ٹائم فریم میں اہم منتقل اوسط ، سپر ٹرینڈ لائن اور ایک کلاؤڈ چارٹ کی تبدیلی کی لائن ، بیس لائن وغیرہ کا حساب لگاتی ہے۔ پھر کم ٹائم فریم میں سپر ٹرینڈ لائن کا حساب لگاتا ہے۔ جب اعلی اور کم ٹائم فریم کی سپر ٹرینڈ لائن کی سمت ایک جیسی ہوتی ہے تو ، موجودہ مجموعی رجحان کی سمت کی تصدیق ہوتی ہے۔ اس کے علاوہ ، حکمت عملی یہ بھی جاننا چاہتی ہے کہ آیا قیمت منتقل اوسط یا ایک کلاؤڈ چارٹ کے بادل کو توڑ دیتی ہے ، تاکہ رجحان کی وشوسنیی کو مزید جانچ پڑتال کی جاسکے۔
جب کچھ شرائط پوری ہوجاتی ہیں تو ، حکمت عملی خریدنے یا بیچنے کے لئے ایک تجارتی سگنل پیدا کرتی ہے۔ صارف اپنی ضرورت کے مطابق صرف لمبی ، مختصر یا دونوں تجارت کا انتخاب کرسکتا ہے۔ اس کے علاوہ ، صارف حکمت عملی کی کارکردگی کو بہتر بنانے کے لئے متحرک اوسط پیرامیٹرز ، سپر ٹرینڈ پیرامیٹرز ، ایک کلاؤڈ گراف پیرامیٹرز وغیرہ کو تشکیل دے سکتا ہے۔
اس حکمت عملی کا سب سے بڑا فائدہ متعدد ٹائم فریموں اور متعدد اشارے کے امتزاج میں ہے ، جس سے رجحانات کی سمت کا تعین کرنے کی درستگی میں بہتری آسکتی ہے ، اور وقت پر الٹ جانے کے مواقع کا پتہ لگایا جاسکتا ہے۔ مخصوص فوائد یہ ہیں:
اس حکمت عملی کا بنیادی خطرہ یہ ہے کہ پیرامیٹرز کی غلط ترتیب سے زیادہ بار بار تجارت یا کھوئے ہوئے مواقع پیدا ہوسکتے ہیں۔ اس کے علاوہ ، اشارے کے غلط سگنل سے نقصان بھی ہوسکتا ہے۔ مخصوص خطرات اور حل مندرجہ ذیل ہیں:
اس حکمت عملی میں مزید اصلاحات کی گنجائش موجود ہے:
خلاصہ یہ ہے کہ ، کثیر ٹائم فریم ٹرینڈ ہنٹر حکمت عملی ایک عمدہ کارکردگی کا مظاہرہ کرنے والی کوانٹم ٹریڈنگ حکمت عملی ہے ، جس میں متعدد اشارے اور کثیر ٹائم فریم کا استعمال کرتے ہوئے رجحانات کا اندازہ لگایا جاسکتا ہے ، تاکہ ریورس کے مواقع کو بروقت فائدہ اٹھایا جاسکے۔ اس حکمت عملی میں اعلی انضمام ، وسیع پیمانے پر اطلاق ہوتا ہے ، اور مستقبل میں بہت زیادہ اصلاح کی گنجائش باقی ہے ، جس میں کوانٹم ٹریڈرز کو تحقیق اور اطلاق جاری رکھنے کے قابل ہے۔
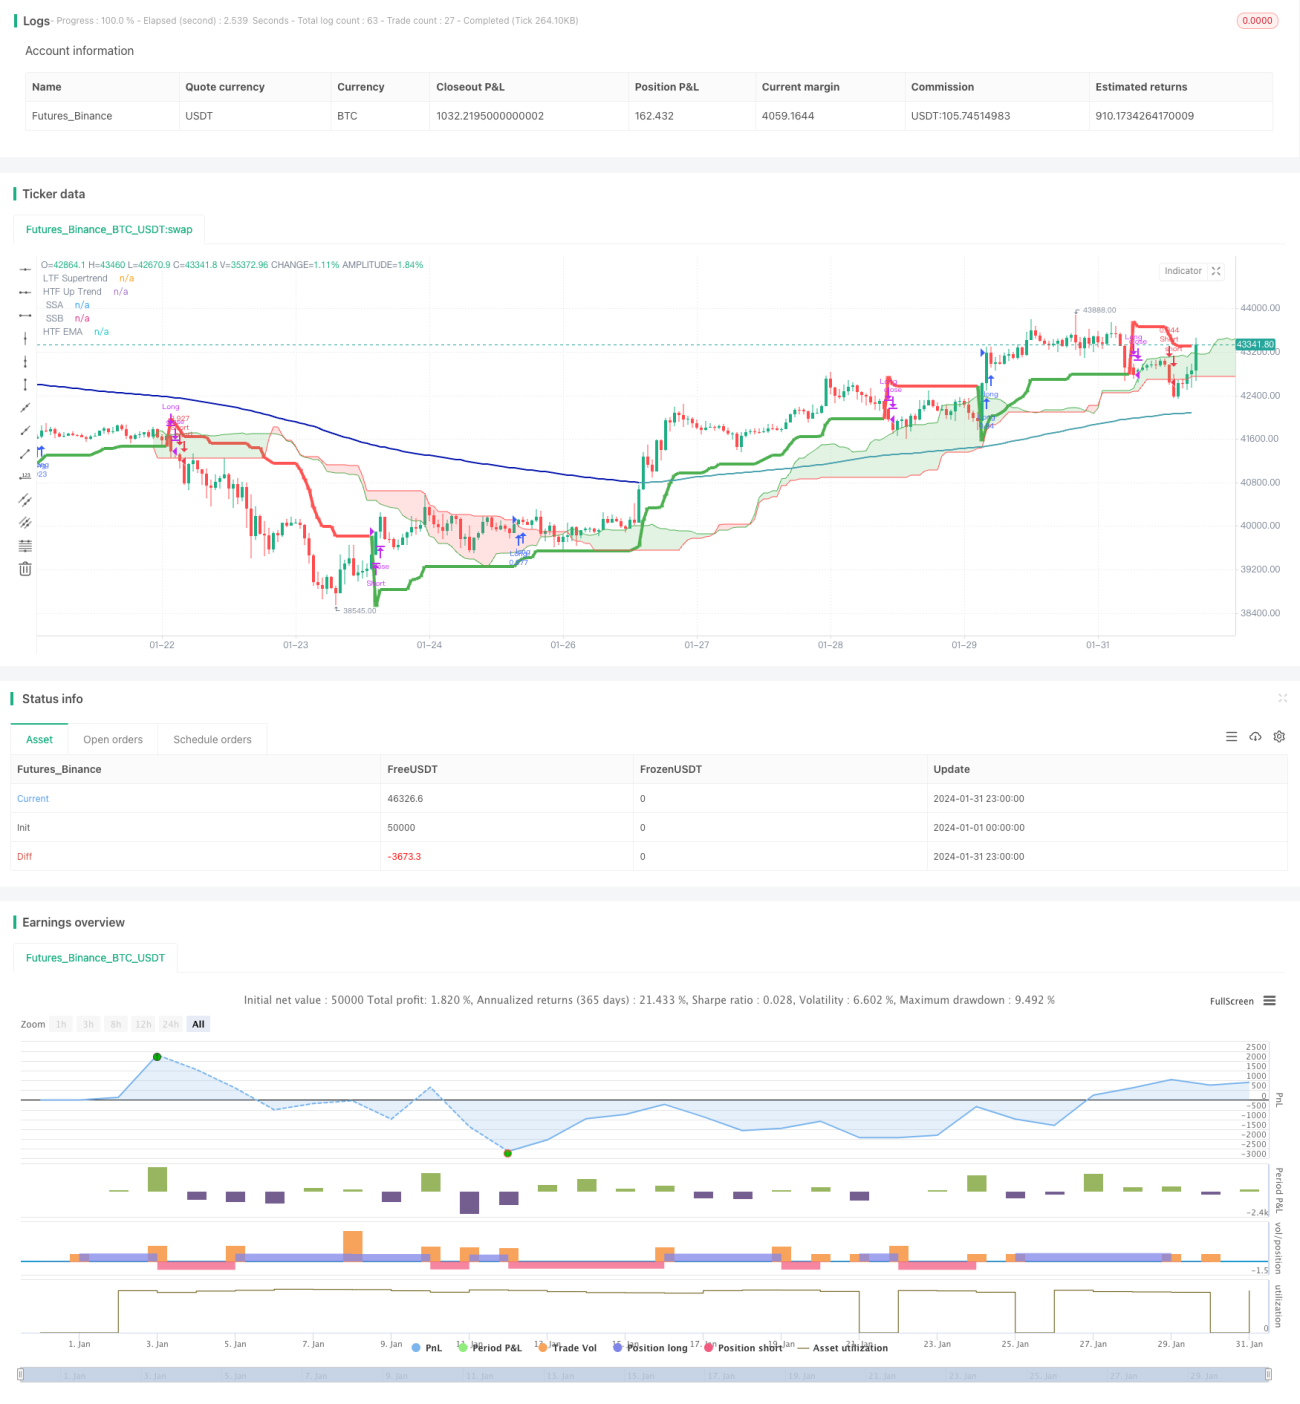
/*backtest
start: 2024-01-01 00:00:00
end: 2024-01-31 23:59:59
period: 1h
basePeriod: 15m
exchanges: [{"eid":"Futures_Binance","currency":"BTC_USDT"}]
*/
// This Pine Script™ code is subject to the terms of the Mozilla Public License 2.0 at https://mozilla.org/MPL/2.0/
// © godzcopilot / blockybears
// Thanks to anthonyf50 for his MTF Ichimoku https://www.tradingview.com/script/Pw9cBFma/
// Thanks to KivancOzbilgic for his SuperTrend https://www.tradingview.com/script/r6dAP7yi/
// Thanks to ZenAndTheArtOfTrading / PineScriptMastery for their Higher Timeframe EMA https://www.tradingview.com/script/Vh3XG9sD-Higher-Timeframe-EMA/
//@version=5
strategy("TrendHunter [Blocky]", overlay=true, default_qty_type=strategy.percent_of_equity, default_qty_value=80, initial_capital=1000, pyramiding=0)
// ================
// Strategy Inputs
// ================
// Defines user inputs for configuring the strategy.
// Higher Time Frame Selection
HTF_TimeFrame = input.timeframe(title='Higher Time Frame', defval='60', group = '== Timeframe ==', tooltip = "Select Chart for standard functionality")
// Inputs for EMA
len = input.int(title="EMA Length", defval=200, group ='== EMA ==')
col = input.bool(title="Colour EMA", defval=true, group ='== EMA ==')
// SuperTrend
Periods = input(title='ATR Period', defval=10, group = '== Supertrend ==')
Multiplier = input.float(title='ATR Multiplier', step=0.1, defval=3.0, group = '== Supertrend ==')
Src = input.source(title='Source', defval=hl2, group = '== Supertrend ==')
// Ichimoku
conversionPeriods = input.int(9, minval=1, title='Conversion Line Periods', group = '== Ichimoku ==')
basePeriods = input.int(26, minval=1, title='Base Line Periods', group = '== Ichimoku ==')
laggingSpan2Periods = input.int(52, minval=1, title='Lagging Span 2 Periods', group = '== Ichimoku ==')
displacement = input.int(26, minval=1, title='Displacement', group = '== Ichimoku ==')
// Ichimoku Display Options
isActiveConversion = input(false, 'Conversion Line', group = '== Ichimoku ==', inline = 'lines1')
isActiveBase = input(false, 'Base Line', group = '== Ichimoku ==', inline = 'lines1')
isActiveLagging = input(false, 'Lagging Span', group = '== Ichimoku ==', inline = 'lines2')
isActiveCloud = input(true, 'Cloud', group = '== Ichimoku ==', inline = 'lines2')
// ================
// Strategy Options
// ================
bTable = input.bool(true, title='Trade Table', group='== Strategy Options ==', tooltip = "Show table that shows current selected options and trade trade entry parameters")
bLong = input.bool(true, title='Enter Longs', group='== Strategy Options ==', inline = 'LongShort')
bShort = input.bool(true, title='Enter Shorts', group='== Strategy Options ==', inline = 'LongShort', tooltip = "Filter long / short trade signals")
bPriceCloud = input.bool(true, title='Price outside cloud', group='== Strategy Options ==', inline='PriceCloud')
bPriceCloudBody = input.bool(false, title='Full Body', group='== Strategy Options ==', inline='PriceCloud', tooltip = 'Only trade when price action outside the cloud.\nLongs when price action above the cloud.\nShort when price action below the cloud')
bPriceEMA = input.bool(false, title='Price above/below EMA', group='== Strategy Options ==', inline='PriceEMA')
bPriceEMABody = input.bool(false, title='Full Body', group='== Strategy Options ==', inline='PriceEMA', tooltip = 'Longs when price action above the EMA.\nShort when price action below the EMA')
bSuper = input.bool(true, title='Supertrend transistions', group='== Strategy Options ==', tooltip = "Trade in direction of the supertrend transitions")
bLTF = input.bool(false, title='LTF/HTF Supertrend alignment', group='== Strategy Options ==', tooltip = "Utilise a dual supertrends, chart and defined higher time frame")
bEMACloud1 = input.bool(true, title='EMA Outside Cloud', group='== Strategy Options ==', tooltip = "EMA must be outside the ichimoku cloud")
bEMACloud2 = input.bool(false, title='EMA above/below Cloud', group='== Strategy Options ==', tooltip = "Longs when EMA above the cloud.\nShort when EMA below the cloud")
bExitHTFTrail = input.bool(true, title='Super Trend Exits: HTF', group='== Strategy Options ==', inline = 'Exits')
bExitLTFTrail = input.bool(true, title='LTF', group='== Strategy Options ==', inline = 'Exits', tooltip = 'Exit trades when price crosses the supertrend line\nIf neither selected trade closes when opposite trade opens\nIf using LTF closes turn on HTF/LTF alignment')
// ===========================
// EMA Functions and Plotting
// ===========================
// Calculate EMA
ema = ta.ema(close, len)
emaSmooth = request.security(syminfo.tickerid, HTF_TimeFrame, ema[barstate.isrealtime ? 1 : 0], gaps=barmerge.gaps_on)[barstate.isrealtime ? 0 : 1]
// Draw EMA
plot(emaSmooth, color=col ? (close > emaSmooth ? color.rgb(76, 163, 175) : color.rgb(6, 23, 173)) : color.black, linewidth=2, title="HTF EMA")
// ==================================
// Supertrend Functions and Plotting
// ==================================
// Function to calculate SuperTrend
calcSuperTrend(src, atrPeriods, multiplier) =>
atr = ta.atr(atrPeriods)
up = src - multiplier * atr
up1 = nz(up[1], up)
up := close[1] > up1 ? math.max(up, up1) : up
dn = src + multiplier * atr
dn1 = nz(dn[1], dn)
dn := close[1] < dn1 ? math.min(dn, dn1) : dn
trend = 1
trend := nz(trend[1], trend)
trend := trend == -1 and close > dn1 ? 1 : trend == 1 and close < up1 ? -1 : trend
[up, dn, trend]
// Calculate SuperTrend for the current time frame
[up, dn, trend] = calcSuperTrend(Src, Periods, Multiplier)
// Plotting for the current time frame
plot(trend == 1 ? up : dn, title='LTF Supertrend', color=trend == 1 ?color.green : color.red, linewidth=1, style = plot.style_stepline)
// Fetching the higher time frame data
[HTF_up, HTF_dn, HTF_trend] = request.security(syminfo.tickerid, HTF_TimeFrame, calcSuperTrend(hl2, Periods, Multiplier), lookahead=barmerge.lookahead_on)
// Plotting for the higher time frame
plot(HTF_trend == 1 ? HTF_up : HTF_dn, title='HTF Up Trend', color= HTF_trend == 1 ? color.green : color.red, linewidth=4)
// ===============================
// Ichimoku Functions and Plotting
// ===============================
// Function to convert timeframe to hours
f_convertTimeframeToHours(tf) =>
val = 0.0
if tf == "1S" or tf == "S"
val := 1.0 / 3600.0
else if str.contains(tf, "S")
val := str.tonumber(str.replace(tf, "S", "")) / 3600.0
else if tf == "1D" or tf == "D"
val := 24.0
else if str.contains(tf, "D")
val := str.tonumber(str.replace(tf, "D", "")) * 24.0
else if tf == "1W" or tf == "W"
val := 24.0 * 7.0
else if str.contains(tf, "W")
val := str.tonumber(str.replace(tf, "W", "")) * 24.0 * 7.0
else if tf == "1M" or tf == "M"
val := 24.0 * 30.0 // Approximation for a month
else if str.contains(tf, "M")
val := str.tonumber(str.replace(tf, "M", "")) * 24.0 * 30.0 // Approximation for months
else
// Default to minutes
val := str.tonumber(tf) / 60.0
val
// Time
timeOffset = time - time[1]
// Returns the displacement based on the chart / HTF resolution
f_getDisplacement(_res) =>
_res == '' ? displacement : math.round(f_convertTimeframeToHours(_res) / f_convertTimeframeToHours(timeframe.period) * displacement)
//f_avgDilationOf(_res) * displacement
// Returns average value between lowest and highest
f_avgLH(_len) =>
math.avg(ta.lowest(_len), ta.highest(_len))
// Returns f_donchian data
f_donchian(_tf, _src) =>
request.security(syminfo.tickerid, _tf, _src, barmerge.gaps_off, barmerge.lookahead_on)
// Returns ichimoku data
f_ichimokuData(_tf) =>
_isShow = _tf == '' or f_convertTimeframeToHours(_tf) >= f_convertTimeframeToHours(timeframe.period)
_displacement = _isShow ? f_getDisplacement(_tf) : na
_Conversion = _isShow ? f_donchian(_tf, f_avgLH(conversionPeriods)) : na
_Base = _isShow ? f_donchian(_tf, f_avgLH(basePeriods)) : na
_Lagging = _isShow ? f_donchian(_tf, close) : na
_SSA = _isShow ? math.avg(_Conversion, _Base) : na
_SSB = _isShow ? f_donchian(_tf, f_avgLH(laggingSpan2Periods)) : na
_middleCloud = _isShow ? _SSA[0] > _SSB[0] ? _SSA[0] - math.abs(_SSA[0] - _SSB[0]) / 2 : _SSA[0] + math.abs(_SSA[0] - _SSB[0]) / 2 : na
[_displacement, _Conversion, _Base, _Lagging, _SSA, _SSB, _middleCloud]
// Plotting ichimoku data
[Displacement, Conversion, Base, Lagging, SSA, SSB, fisrtMiddleCloud] = f_ichimokuData(HTF_TimeFrame)
// ————— Conversion
plot(isActiveConversion ? Conversion : na, color=color.new(color.blue, 0), title=' Conversion', linewidth=1)
// ————— Base
plot(isActiveBase ? Base : na, color=color.new(color.fuchsia, 0), title=' Base', linewidth=2)
// ————— Lagging
plot(isActiveLagging ? Lagging : na, offset=-Displacement, color=color.new(color.green, 0), title=' Lagging')
// ————— SSA + SSB
ssa = plot(isActiveCloud ? SSA : na, offset=Displacement, color=color.new(color.green, 0), title=' SSA', linewidth=1)
ssb = plot(isActiveCloud ? SSB : na, offset=Displacement, color=color.new(color.red, 0), title=' SSB', linewidth=1)
fill(ssa, ssb, color=color.new(SSA > SSB ? color.green : color.red , 80), title=' Cloud')
// ===============================
// Strategy Entries
// ===============================
// Checks whether price is inside the Ichimoku cloud
f_PriceCloud(dir) =>
_enter = false
if bPriceCloud
if bLong and dir == 1
if bPriceCloudBody
_enter := close > math.max(SSA[Displacement], SSB[Displacement]) and open > math.max(SSA[Displacement], SSB[Displacement])
else
_enter := close > math.max(SSA[Displacement], SSB[Displacement])
if bShort and dir == 2
if bPriceCloudBody
_enter := close < math.min(SSA[Displacement], SSB[Displacement]) and open < math.min(SSA[Displacement], SSB[Displacement])
else
_enter := close < math.min(SSA[Displacement], SSB[Displacement])
else
_enter := na
_enter
// Checks whether price is above / below the ema
f_PriceEMA(dir) =>
_enter = false
if bPriceEMA
if bLong and dir == 1
if bPriceEMABody
_enter := close > emaSmooth and open > emaSmooth
else
_enter := close > emaSmooth
if bShort and dir == 2
if bPriceEMABody
_enter := close < emaSmooth and open < emaSmooth
else
_enter := close < emaSmooth
else
_enter := na
_enter
// Checks HTF supertrend direction
f_Super(dir) =>
_enter = false
if bSuper
if bLong and dir == 1
_enter := HTF_trend == 1
if bShort and dir == 2
_enter := HTF_trend == -1
else
_enter := na
_enter
// Checks LTF supertrend direction
f_LTF(dir) =>
_enter = false
if bLTF
if bLong and dir == 1
_enter := trend == 1 and HTF_trend == 1
if bShort and dir == 2
_enter := trend == -1 and HTF_trend == -1
else
_enter := na
_enter
// Checks whether ema is inside the Ichimoku cloud
f_EMACloud1(dir) =>
_enter = false
if bEMACloud1
if bLong and dir == 1
_enter := (emaSmooth > math.max(SSA[Displacement], SSB[Displacement])) or (emaSmooth < math.min(SSA[Displacement], SSB[Displacement]))
if bShort and dir == 2
_enter := (emaSmooth > math.max(SSA[Displacement], SSB[Displacement])) or (emaSmooth < math.min(SSA[Displacement], SSB[Displacement]))
else
_enter := na
_enter
// Checks whether ema is above/below Ichimoku cloud
f_EMACloud2(dir) =>
_enter = false
if bEMACloud2
if bLong and dir == 1
_enter := emaSmooth > math.max(SSA[Displacement], SSB[Displacement])
if bShort and dir == 2
_enter := emaSmooth < math.min(SSA[Displacement], SSB[Displacement])
else
_enter := na
_enter
// Check if a value is 'na' or true.
f_NATrue(val) =>
_enter = false
if na(val)
_enter := true
if val
_enter := true
_enter
// Consolidates entry conditions.
f_checkCondition(dir) =>
_enter = false
if na(f_PriceCloud(dir)) and na(f_PriceEMA(dir)) and na(f_Super(dir)) and na(f_LTF(dir)) and na(f_EMACloud1(dir)) and na(f_EMACloud2(dir))
_enter := false
else if f_NATrue(f_PriceCloud(dir)) and f_NATrue(f_PriceEMA(dir)) and f_NATrue(f_Super(dir)) and f_NATrue(f_LTF(dir)) and f_NATrue(f_EMACloud1(dir)) and f_NATrue(f_EMACloud2(dir))
_enter := true
_enter
// Execute long trade entries
longCondition = bLong and f_checkCondition(1)
if (longCondition)
strategy.entry("Long", strategy.long)
// Execute short trade entries
shortCondition = bShort and f_checkCondition(2)
if (shortCondition)
strategy.entry("Short", strategy.short)
// Excute trade exits
exitLong = (bExitHTFTrail and (close < HTF_up or HTF_trend == -1)) or (bExitLTFTrail and (close < up or trend == -1))
exitShort = (bExitHTFTrail and (close > HTF_dn or HTF_trend == 1)) or (bExitLTFTrail and (close > dn or trend == 1))
if exitLong
strategy.close("Long")
if exitShort
strategy.close("Short")
// Creates a table shoing all the user options and their current status for entering a trade
if bTable
// Create a table
tbl = table.new(position = position.bottom_right, columns = 4, rows = 9, bgcolor=color.new(color.white, 50), border_width = 1)
table.cell(tbl, 1, 0, "Selected")
table.cell(tbl, 2, 0, "Long", bgcolor=na(bLong) ? color.gray : bShort ? color.rgb(4, 112, 8) : color.rgb(100, 7, 7))
table.cell(tbl, 3, 0, "Short", bgcolor=na(bShort) ? color.gray : bShort ? color.rgb(4, 112, 8) : color.rgb(100, 7, 7))
table.cell(tbl, 0, 1, "Entry")
table.cell(tbl, 2, 1, str.tostring(longCondition), bgcolor=longCondition ? color.green : color.red)
table.cell(tbl, 3, 1, str.tostring(shortCondition), bgcolor=shortCondition ? color.green : color.red)
table.cell(tbl, 0, 3, "Price Cloud")
table.cell(tbl, 1, 3, str.tostring(bPriceCloud), bgcolor=na(bPriceCloud) ? color.gray : bPriceCloud ? color.green : color.red)
table.cell(tbl, 2, 3, str.tostring(f_PriceCloud(1)), bgcolor=na(f_PriceCloud(1)) ? color.gray : f_PriceCloud(1) ? color.green : color.red)
table.cell(tbl, 3, 3, str.tostring(f_PriceCloud(2)), bgcolor=na(f_PriceCloud(2)) ? color.gray : f_PriceCloud(2) ? color.green : color.red)
table.cell(tbl, 0, 4, "Price EMA")
table.cell(tbl, 1, 4, str.tostring(bPriceEMA), bgcolor=na(bPriceEMA) ? color.gray : bPriceEMA ? color.green : color.red)
table.cell(tbl, 2, 4, str.tostring(f_PriceEMA(1)), bgcolor=na(f_PriceEMA(1)) ? color.gray : f_PriceEMA(1) ? color.green : color.red)
table.cell(tbl, 3, 4, str.tostring(f_PriceEMA(2)), bgcolor=na(f_PriceEMA(2)) ? color.gray : f_PriceEMA(2) ? color.green : color.red)
table.cell(tbl, 0, 5, "SuperTrend")
table.cell(tbl, 1, 5, str.tostring(bSuper), bgcolor=na(bSuper) ? color.gray : bSuper ? color.green : color.red)
table.cell(tbl, 2, 5, str.tostring(f_Super(1)), bgcolor=na(f_Super(1)) ? color.gray : f_Super(1) ? color.green : color.red)
table.cell(tbl, 3, 5, str.tostring(f_Super(2)), bgcolor=na(f_Super(2)) ? color.gray : f_Super(2) ? color.green : color.red)
table.cell(tbl, 0, 6, "HTF/LTF")
table.cell(tbl, 1, 6, str.tostring(bLTF), bgcolor=na(bLTF) ? color.gray : bLTF ? color.green : color.red)
table.cell(tbl, 2, 6, str.tostring(f_LTF(1)), bgcolor=na(f_LTF(1)) ? color.gray : f_LTF(1) ? color.green : color.red)
table.cell(tbl, 3, 6, str.tostring(f_LTF(2)), bgcolor=na(f_LTF(2)) ? color.gray : f_LTF(2) ? color.green : color.red)
table.cell(tbl, 0, 7, "EMA Outside Cloud")
table.cell(tbl, 1, 7, str.tostring(bEMACloud1), bgcolor=na(bEMACloud1) ? color.gray : bEMACloud1 ? color.green : color.red)
table.cell(tbl, 2, 7, str.tostring(f_EMACloud1(1)), bgcolor=na(f_EMACloud1(1)) ? color.gray : f_EMACloud1(1) ? color.green : color.red)
table.cell(tbl, 3, 7, str.tostring(f_EMACloud1(2)), bgcolor=na(f_EMACloud1(2)) ? color.gray : f_EMACloud1(2) ? color.green : color.red)
table.cell(tbl, 0, 8, "EMA Above/Below Cloud")
table.cell(tbl, 1, 8, str.tostring(bEMACloud2), bgcolor=na(bEMACloud2) ? color.gray : bEMACloud2 ? color.green : color.red)
table.cell(tbl, 2, 8, str.tostring(f_EMACloud2(1)), bgcolor=na(f_EMACloud2(1)) ? color.gray : f_EMACloud2(1) ? color.green : color.red)
table.cell(tbl, 3, 8, str.tostring(f_EMACloud2(2)), bgcolor=na(f_EMACloud2(2)) ? color.gray : f_EMACloud2(2) ? color.green : color.red)