ڈبل کاؤنٹر مومینٹم حکمت عملی پر مبنی
جائزہ
ڈبل ریٹرننگ حجم کی حکمت عملی قیمتوں میں الٹ اور اتار چڑھاؤ کی شرح میں الٹ کے اشارے کو جوڑ کر رجحان کی تجارت کو انجام دیتی ہے۔ یہ بنیادی طور پر 123 کی شکل پر مبنی قیمتوں میں الٹ کا فیصلہ کرتی ہے ، جبکہ ڈونچیئن چینل کے اتار چڑھاؤ کو غلط سگنل کو فلٹر کرنے میں معاون ہے۔ یہ حکمت عملی درمیانی اور لمبی لائن کی پوزیشنوں کے لئے موزوں ہے ، اور ڈبل ریٹرننگ فلٹرنگ کے ذریعہ ، مارکیٹ کے موڑ کے نقطہ کو مؤثر طریقے سے پکڑنے اور اضافی منافع حاصل کرنے کے لئے استعمال کیا جاسکتا ہے۔
حکمت عملی کا اصول
قیمتوں کے الٹ جانے والے حصے میں 123 شکل کا فیصلہ کیا جاتا ہے۔ اس شکل کا مطلب یہ ہے کہ قیمت کی پہلی دو K لائنیں الٹ ہوجاتی ہیں ((بڑھتی ہیں یا گرتی ہیں) ، اور تیسری K لائن دوبارہ الٹ ہوجاتی ہے ((بڑھتی ہیں یا بڑھتی ہیں) ، لہذا اسے 123 شکل کہا جاتا ہے۔ جب قیمت میں تین K لائن الٹ ہوتی ہے تو ، یہ عام طور پر ایک قلیل مدتی رجحان کا اشارہ کرتا ہے۔ قیمت کے الٹ جانے کی وشوسنییتا کو مزید جانچنے کے لئے ، اس حکمت عملی میں بے ترتیب اشارے کا فیصلہ بھی کیا گیا ہے ، جو صرف اس وقت ٹریڈ سگنل کو متحرک کرتا ہے جب بے ترتیب اشارے بھی الٹ ہوجاتے ہیں ((تیز واپسی یا تیز رفتار) ۔
اتار چڑھاؤ کی شرح کا الٹ حصہ ڈونچیئن چینل اتار چڑھاؤ کا استعمال کرتا ہے۔ ڈونچیئن چینل بنیادی طور پر قیمتوں کے اتار چڑھاؤ کی حد کی عکاسی کرتا ہے۔ جب قیمتوں میں اتار چڑھاؤ بڑھتا ہے تو ، ڈونچیئن چینل کی چوڑائی بھی پھیل جاتی ہے۔ جب قیمتوں میں اتار چڑھاؤ کم ہوتا ہے تو ، ڈونچیئن چینل کی چوڑائی بھی تنگ ہوجاتی ہے۔ ڈونچیئن چینل اتار چڑھاؤ کی چوڑائی ((درجہ) مارکیٹ میں اتار چڑھاؤ کی حد اور خطرے کی سطح کا مؤثر اندازہ لگاتا ہے۔ اس حکمت عملی میں ڈونچیئن چینل اتار چڑھاؤ کی شرح کا الٹ استعمال کیا جاتا ہے تاکہ جعلی سگنل کو روک سکے۔ صرف اس صورت میں جب اتار چڑھاؤ کی شرح اور قیمت ایک ساتھ الٹ ہوتی ہے تو ، تجارتی سگنل جاری کیا جاتا ہے ، اور اس سے بچنے کے لپیٹ میں آنے سے بچنے کے لئے۔
مجموعی طور پر ، اس حکمت عملی نے دوہری الٹ پلٹ کی توثیق کے ذریعے تجارتی سگنل کی وشوسنییتا کو یقینی بنایا اور خطرے کو کنٹرول کیا ، جو ایک نسبتا strong مضبوط رجحان سازی ہے۔
اسٹریٹجک فوائد
- ڈبل فلٹرنگ میکانزم ، جو ٹریڈنگ سگنل کی وشوسنییتا کو یقینی بناتا ہے اور جعلی بریک سے بچتا ہے
- خطرے پر قابو پانا اور نقصانات کو کم کرنا
- مڈل اور لانگ لائنز کے لئے موزوں پوزیشنیں ، مارکیٹ شور سے بچیں ، اضافی آمدنی پر قبضہ کریں
- پیرامیٹرز کو بہتر بنانے کے لئے کافی جگہ ہے اور اسے زیادہ سے زیادہ حالت میں ایڈجسٹ کیا جاسکتا ہے
- ایک منفرد انداز اور عام تکنیکی اشارے کے مجموعے کے ساتھ استعمال میں بہت اچھا
اسٹریٹجک رسک
- پیرامیٹرز کی اصلاح پر انحصار کرتا ہے ، غلط پیرامیٹرز حکمت عملی کی کارکردگی کو متاثر کرتے ہیں
- اسٹاپ نقصان کی حکمت عملی کو مزید بہتر بنانے کی ضرورت ہے ، زیادہ سے زیادہ واپسی کے کنٹرول میں بہتری لانا ہے۔
- ہائی فریکوئینسی الگورتھم ٹریڈنگ کے لئے غیر موزوں ہونے کی وجہ سے کم ٹرانزیکشن فریکوئینسی
- مناسب قسم اور وقت کی مدت کا انتخاب، محدود استعمال
- مشین لرننگ اور دیگر طریقوں کے ذریعہ زیادہ سے زیادہ پیرامیٹرز تلاش کریں
اصلاح کی سمت
- زیادہ سے زیادہ واپسی کو نمایاں طور پر کم کرنے کے لئے ایڈجسٹمنٹ اسٹاپ نقصان ماڈیول شامل کریں
- اعلی حجم میں اضافے کے دوران اندراج کو یقینی بنانے کے لئے حجم اشارے شامل کریں
- زیادہ سے زیادہ استحکام کے لئے پیرامیٹرز کو بہتر بنائیں
- مختلف اقسام اور ٹائم سائیکلوں کو آزمائیں اور بہترین ماحول تلاش کریں
- دوسرے اشارے یا حکمت عملی کے ساتھ کوشش کریں تاکہ 1+1>2 کے ہم آہنگی کا اثر ہو سکے
خلاصہ کریں۔
ڈبل ریٹرنومینٹ حکمت عملی قیمت کی تبدیلی اور اتار چڑھاؤ کی شرح کی تبدیلی کی دوہری توثیق کے ذریعہ بہتر خطرے کے کنٹرول کو حاصل کرتی ہے۔ یہ ایک ہی اشارے کے مقابلے میں بہت سارے شور کو فلٹر کرتی ہے اور اس کی استحکام بہتر ہے۔ اس حکمت عملی کو پیرامیٹرز کی اصلاح ، نقصان دہ ماڈیول میں اضافہ ، مقدار میں طاقت متعارف کروانے جیسے ذرائع کے ذریعہ سگنل کے معیار اور آمدنی کی استحکام کو مزید بہتر بنایا جاسکتا ہے۔ یہ اسٹاک ، ڈیجیٹل کرنسی وغیرہ کی درمیانی لمبی حکمت عملی کا ایک جزو ہے ، جو دوسرے ماڈیول کے ساتھ معقول طور پر جوڑا جاتا ہے ، جس سے اچھی اضافی آمدنی حاصل کی جاسکتی ہے۔
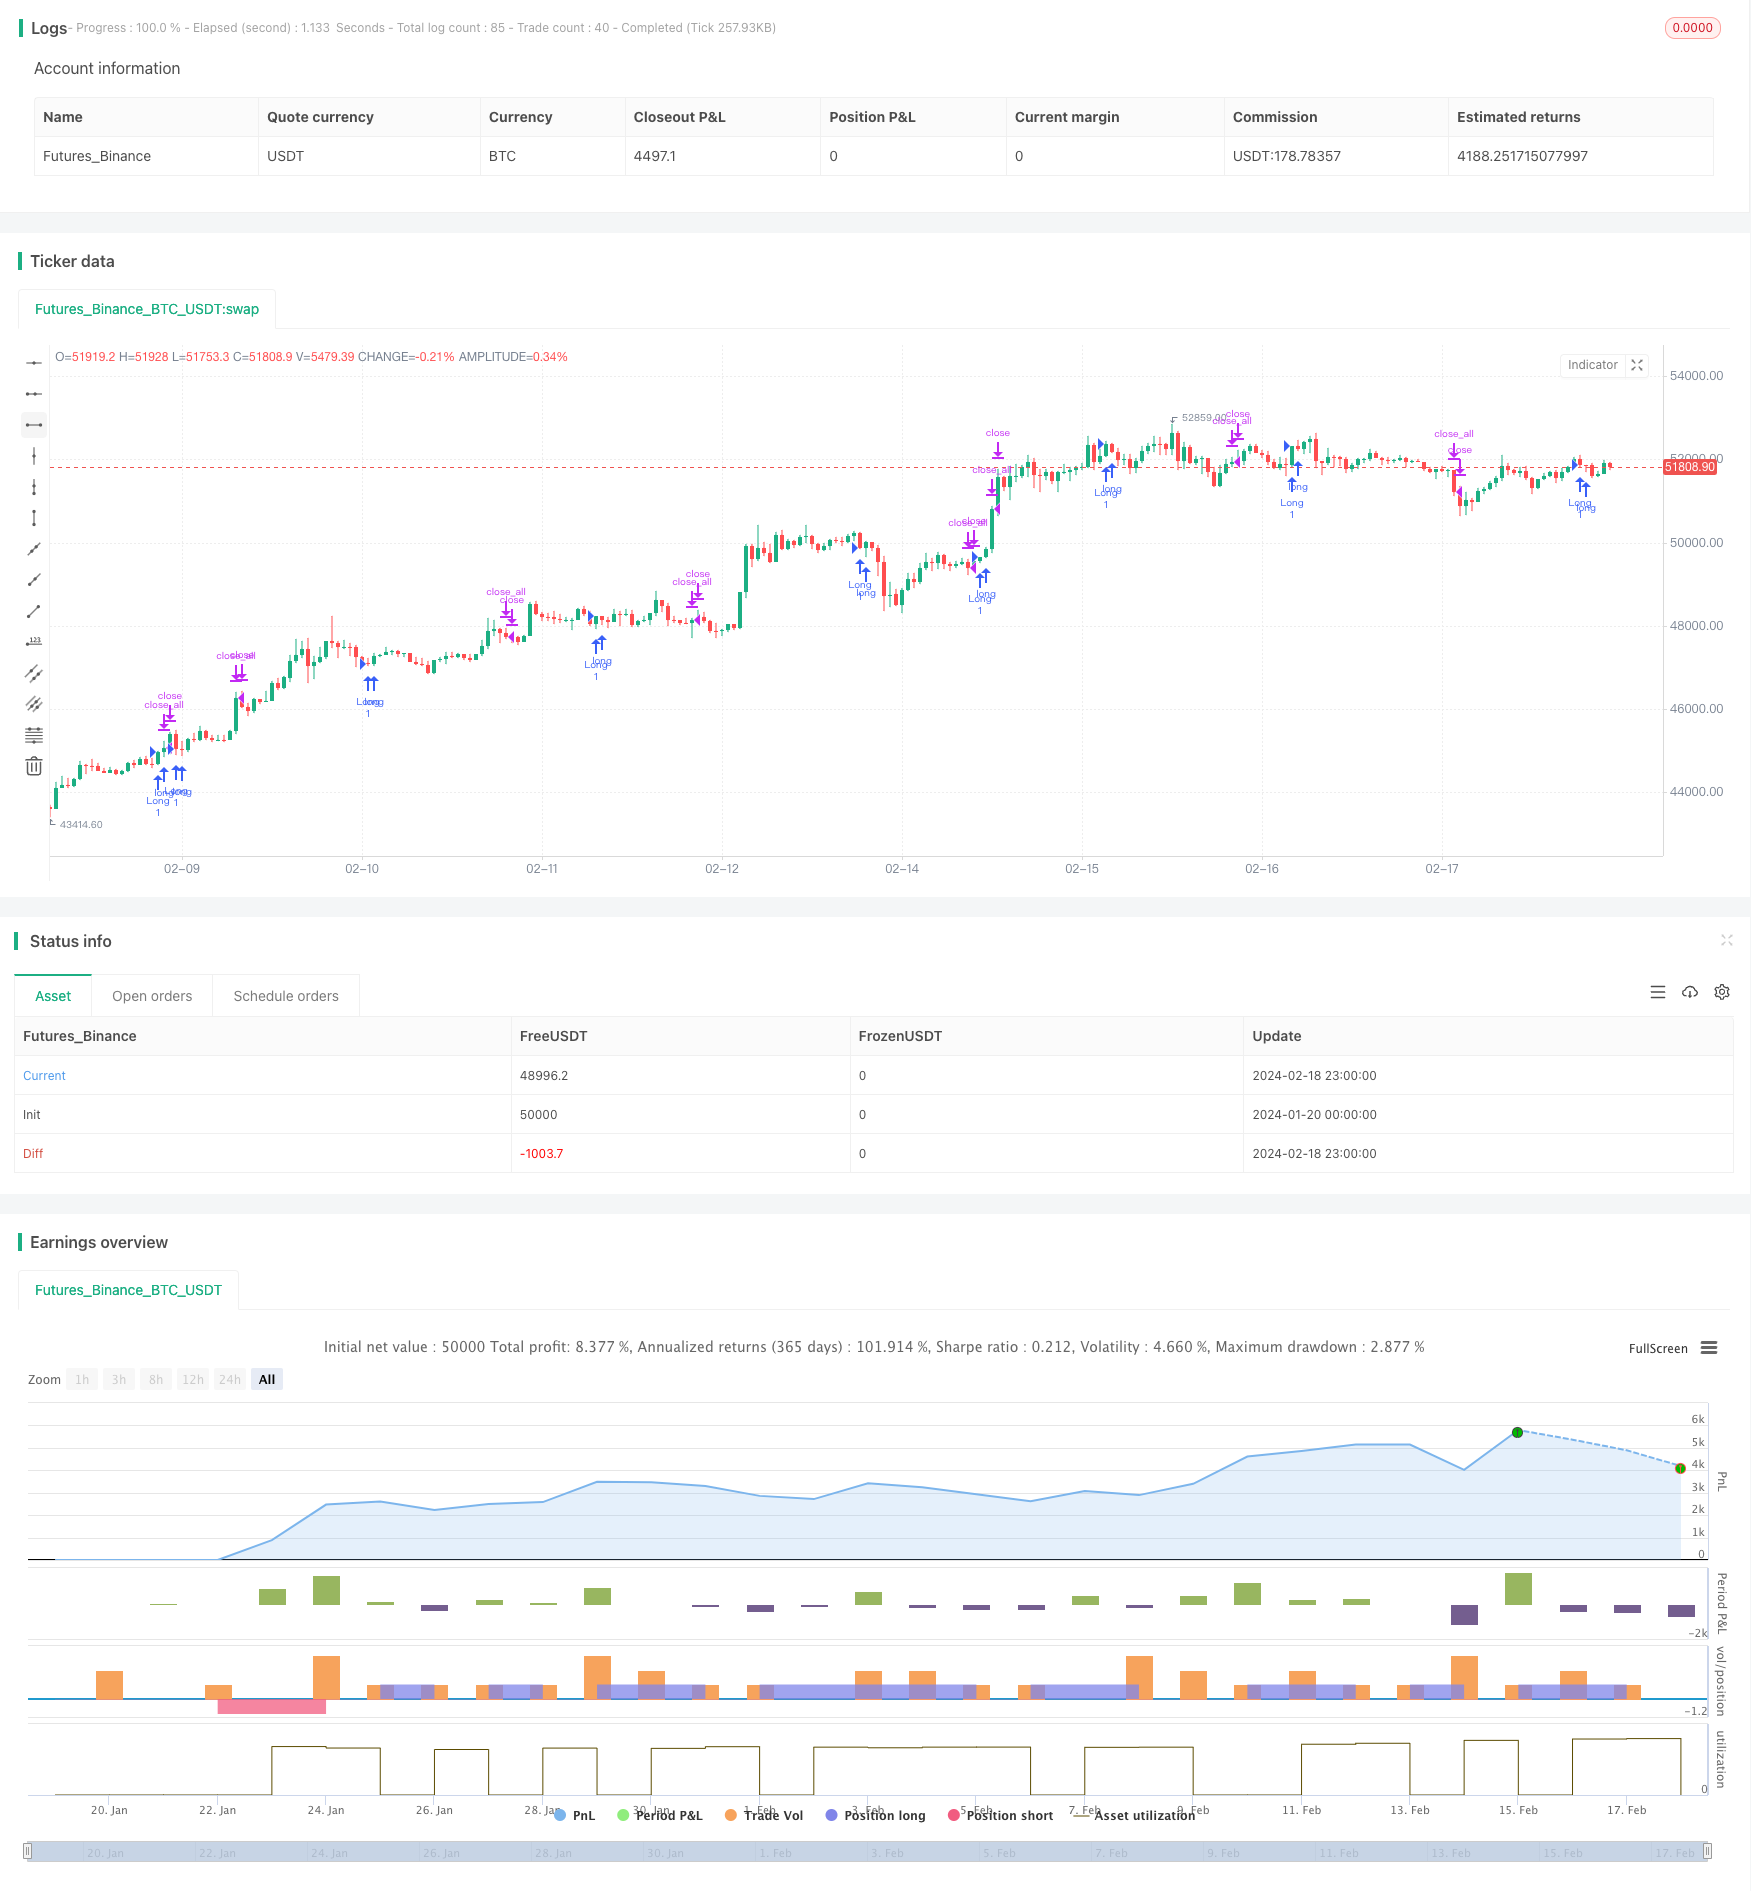
/*backtest
start: 2024-01-20 00:00:00
end: 2024-02-19 00:00:00
period: 1h
basePeriod: 15m
exchanges: [{"eid":"Futures_Binance","currency":"BTC_USDT"}]
*/

//@version=4
////////////////////////////////////////////////////////////
//  Copyright by HPotter v1.0 06/03/2020
// This is combo strategies for get a cumulative signal.
//
// First strategy
// This System was created from the Book "How I Tripled My Money In The
// Futures Market" by Ulf Jensen, Page 183. This is reverse type of strategies.
// The strategy buys at market, if close price is higher than the previous close
// during 2 days and the meaning of 9-days Stochastic Slow Oscillator is lower than 50.
// The strategy sells at market, if close price is lower than the previous close price
// during 2 days and the meaning of 9-days Stochastic Fast Oscillator is higher than 50.
//
// Second strategy
// The Donchian Channel was developed by Richard Donchian and it could be compared
// to the Bollinger Bands. When it comes to volatility analysis, the Donchian Channel
// Width was created in the same way as the Bollinger Bandwidth technical indicator was.
//
// As was mentioned above the Donchian Channel Width is used in technical analysis to measure
// volatility. Volatility is one of the most important parameters in technical analysis.
// A price trend is not just about a price change. It is also about volume traded during this
// price change and volatility of a this price change. When a technical analyst focuses his/her
// attention solely on price analysis by ignoring volume and volatility, he/she only sees a part
// of a complete picture only. This could lead to a situation when a trader may miss something and
// lose money. Lets take a look at a simple example how volatility may help a trader:
//
//    Most of the price based technical indicators are lagging indicators.
//    When price moves on low volatility, it takes time for a price trend to change its direction and
// it could be ok to have some lag in an indicator.
//    When price moves on high volatility, a price trend changes its direction faster and stronger.
// An indicator's lag acceptable under low volatility could be financially suicidal now - Buy/Sell signals could be generated when it is already too late.
//
// Another use of volatility - very popular one - it is to adapt a stop loss strategy to it:
//    Smaller stop-loss recommended in low volatility periods. If it is not done, a stop-loss could
// be generated when it is too late.
//    Bigger stop-loss recommended in high volatility periods. If it is not done, a stop-loss could
// be triggered too often and you may miss good trades.
//
// WARNING:
// - For purpose educate only
// - This script to change bars colors.
////////////////////////////////////////////////////////////
Reversal123(Length, KSmoothing, DLength, Level) =>
    vFast = sma(stoch(close, high, low, Length), KSmoothing)
    vSlow = sma(vFast, DLength)
    pos = 0.0
    pos := iff(close[2] < close[1] and close > close[1] and vFast < vSlow and vFast > Level, 1,
	         iff(close[2] > close[1] and close < close[1] and vFast > vSlow and vFast < Level, -1, nz(pos[1], 0)))
	pos

DCW(length, smoothe) =>
    pos = 0.0
    xUpper = highest(high, length)
    xLower = lowest(low, length)
    xDonchianWidth = xUpper - xLower
    xSmoothed = sma(xDonchianWidth, smoothe)
    pos := iff(xDonchianWidth > xSmoothed, -1,
              iff(xDonchianWidth < xSmoothed, 1, nz(pos[1], 0)))
    pos

strategy(title="Combo Backtest 123 Reversal & Donchian Channel Width", shorttitle="Combo", overlay = true)
Length = input(14, minval=1)
KSmoothing = input(1, minval=1)
DLength = input(3, minval=1)
Level = input(50, minval=1)
//-------------------------
LengthDCW = input(20, minval=1)
SmootheSCW = input(22, minval=1)
reverse = input(false, title="Trade reverse")
posReversal123 = Reversal123(Length, KSmoothing, DLength, Level)
posDCW = DCW(LengthDCW, SmootheSCW)
pos = iff(posReversal123 == 1 and posDCW == 1 , 1,
	   iff(posReversal123 == -1 and posDCW == -1, -1, 0))
possig = iff(reverse and pos == 1, -1,
          iff(reverse and pos == -1 , 1, pos))
if (possig == 1)
    strategy.entry("Long", strategy.long)
if (possig == -1)
    strategy.entry("Short", strategy.short)
if (possig == 0)
    strategy.close_all()
barcolor(possig == -1 ? #b50404: possig == 1 ? #079605 : #0536b3 )