مقداری تجارتی پلیٹ فارم پر مبنی انکولی گرڈ تجارتی حکمت عملی
جائزہ
یہ حکمت عملی ایک انکولی گرڈ ٹریڈنگ حکمت عملی ہے جو ایک مقداری ٹریڈنگ پلیٹ فارم پر مبنی ہے۔ اس حکمت عملی میں گرڈ ٹریڈنگ کو خود کار طریقے سے یا دستی طور پر گرڈ ٹریڈنگ کا دائرہ مقرر کرکے ، خرید و فروخت کے احکامات کو برابر وقفے پر رکھا جاتا ہے۔ جب قیمت گرڈ کے اوپری اور نچلے حصے کو توڑ دیتی ہے تو حکمت عملی خود بخود گرڈ کے دائرے کو ایڈجسٹ کرتی ہے۔
حکمت عملی کا اصول
گرڈ کی اوپر اور نیچے کی قیمتوں کا تعین کریں۔ قیمتوں کو ایک مخصوص حد کے اندر اندر اعلی ترین اور کم ترین قیمتوں کا حساب کتاب کرنے کے لئے خود کار طریقے سے حساب کتاب کیا جاسکتا ہے ، یا آپ دستی طور پر مقررہ اوپر اور نیچے کی قیمتوں کا تعین کرسکتے ہیں۔
ہر گرڈ کی قیمت کا فاصلہ اوپر اور نیچے کی قیمتوں اور گرڈ کی تعداد کے حساب سے کیا جاتا ہے۔
اوپر اور نیچے کی حد کی قیمتوں کے درمیان ، ایک ہی وقفے کے ساتھ متعدد خرید و فروخت کے مقامات کو بطور گرڈ ترتیب دیں۔
جب مارکیٹ کی قیمت گرڈ کی نچلی حد کو توڑتی ہے تو ، اگلے گرڈ میں ایک خریدنے والا آرڈر لگایا جاتا ہے جہاں تازہ ترین اسٹاک آرڈرز موجود ہیں۔ جب مارکیٹ کی قیمت گرڈ کی بالائی حد کو توڑتی ہے تو ، تازہ ترین اسٹاک آرڈرز والے گرڈ میں ایک بیچنے والا آرڈر لگایا جاتا ہے۔
اس طرح ، گرڈ پر نچلی حد کے مابین خرید و فروخت کا عمل جاری رہتا ہے۔ جب قیمت کا رجحان الٹ جاتا ہے تو ، پچھلے احکامات آہستہ آہستہ رک جاتے ہیں یا ضائع ہوجاتے ہیں۔
اسٹریٹجک فوائد
گرڈ ٹریڈنگ کا فائدہ افقی اور ہلچل کے حالات میں ہوتا ہے۔
خود کار طریقے سے ایڈجسٹ گرڈ کی حد، مارکیٹ کے اتار چڑھاو کے مطابق خود کار طریقے سے ایڈجسٹ کیا جا سکتا ہے، بغیر کسی انسانی مداخلت کی ضرورت ہوتی ہے.
اس کے علاوہ، آپ کو ہر خطرے پر قابو پانے کے لئے ہر گرڈ پر فنڈز کی مقدار کو مختص کرنے کی اجازت دیتا ہے.
سادہ منطق، آسانی سے سمجھنے کے لئے، پیرامیٹرز کو ایڈجسٹ کرنے کے لئے لچکدار.
خطرات اور ان کا مقابلہ
اوپری اور نچلی حد سے تجاوز
- حل: مناسب طریقے سے سٹاپ نقصان کی پوزیشن مقرر کریں۔
رجحانات کے نتیجے میں بار بار نقصان
- حل: رجحانات کی نشاندہی کریں اور بروقت تجارت کو روکیں۔
پیرامیٹرز کی غلط ترتیب
- حل: گرڈ کی تعداد کو ایڈجسٹ کریں ، قیمت کے فاصلے کے پیرامیٹرز
اصلاح کی سمت
مشین لرننگ کا استعمال کرتے ہوئے قیمتوں کے اتار چڑھاو کی حد اور رجحانات کی پیش گوئی کریں ، گرڈ پیرامیٹرز کو متحرک طور پر ایڈجسٹ کریں۔
رجحانات کے دوران ، گرڈ ٹریڈنگ کے نقصانات سے بچنے کے لئے رجحانات پر تجارت کریں۔
فنڈز کے استعمال کی شرح ، منافع کی شرح جیسے اشارے کے ساتھ خطرے پر قابو پالیں۔
اس کے علاوہ ، اس نے ایک بار پھر اس بات کی تصدیق کی ہے کہ اس کی مصنوعات کی قیمتوں میں اضافہ ہوا ہے۔
خلاصہ کریں۔
یہ حکمت عملی ایک خود کار طریقے سے ایڈجسٹ کیا جا سکتا ہے پیرامیٹرز کے لئے انکولی گرڈ حکمت عملی ہے، کے لئے لاگو کیا جا سکتا ہے شیک افقی اسٹاک، ڈیجیٹل کرنسیوں اور غیر ملکی کرنسی کی قسم، پیرامیٹرز کی ایڈجسٹمنٹ کے تحت، مارکیٹ کے مختلف حالات کے مطابق ڈھال لیا جا سکتا ہے، اور کچھ حقیقی قدر ہے.
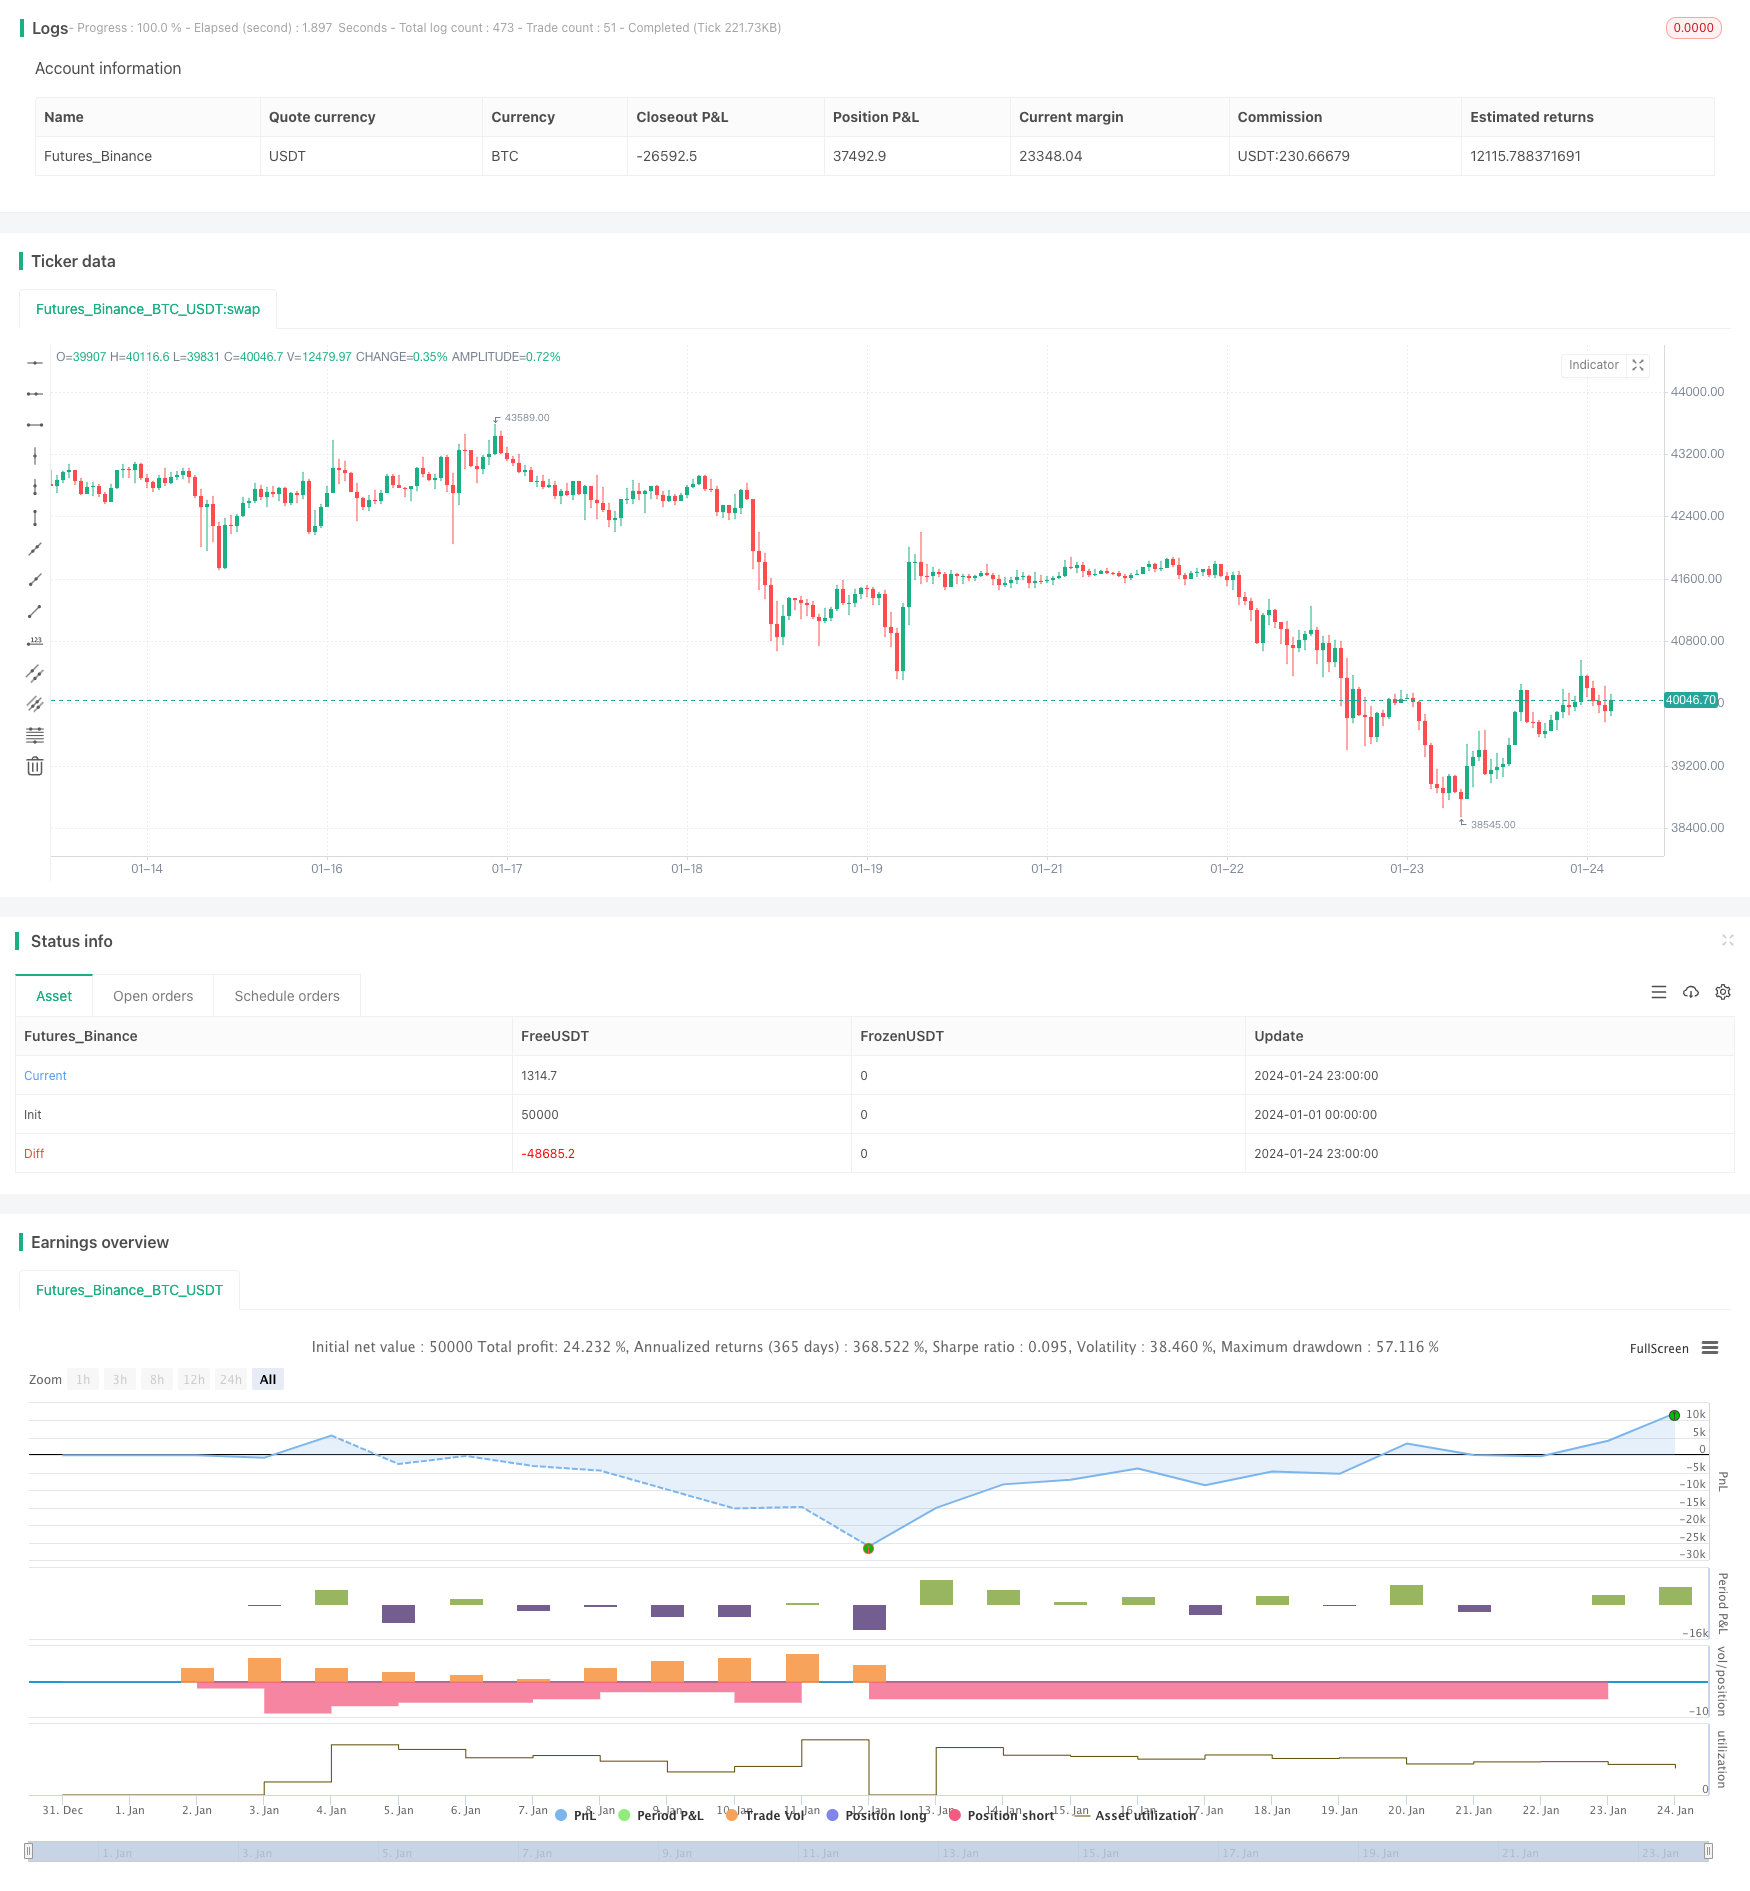
/*backtest
start: 2024-01-01 00:00:00
end: 2024-01-24 23:59:59
period: 1h
basePeriod: 15m
exchanges: [{"eid":"Futures_Binance","currency":"BTC_USDT"}]
*/

//@version=4
//hk4jerry

strategy("Grid Bot Backtesting", overlay=false, pyramiding=3000, close_entries_rule="ANY", default_qty_type=strategy.cash, initial_capital=100.0, currency="USD", commission_type=strategy.commission.percent, commission_value=0.025)
i_autoBounds    = input(group="Grid Bounds", title="Use Auto Bounds?", defval=true, type=input.bool)                             // calculate upper and lower bound of the grid automatically? This will theorhetically be less profitable, but will certainly require less attention
i_boundSrc      = input(group="Grid Bounds", title="(Auto) Bound Source", defval="Hi & Low", options=["Hi & Low", "Average"])     // should bounds of the auto grid be calculated from recent High & Low, or from a Simple Moving Average
i_boundLookback = input(group="Grid Bounds", title="(Auto) Bound Lookback", defval=250, type=input.integer, maxval=500, minval=0) // when calculating auto grid bounds, how far back should we look for a High & Low, or what should the length be of our sma
i_boundDev      = input(group="Grid Bounds", title="(Auto) Bound Deviation", defval=0.10, type=input.float, maxval=1, minval=-1)  // if sourcing auto bounds from High & Low, this percentage will (positive) widen or (negative) narrow the bound limits. If sourcing from Average, this is the deviation (up and down) from the sma, and CANNOT be negative.
i_upperBound    = input(group="Grid Bounds", title="(Manual) Upper Boundry(상단 가격)", defval=0.285, type=input.float)                      // for manual grid bounds only. The upperbound price of your grid
i_lowerBound    = input(group="Grid Bounds", title="(Manual) Lower Boundry(하단 가격)", defval=0.225, type=input.float)                      // for manual grid bounds only. The lowerbound price of your grid.
i_gridQty       = input(group="Grid Lines",  title="Grid Line Quantity(그리드 수)", defval=30, maxval=999, minval=1, type=input.integer)       // how many grid lines are in your grid
initial_balance = input(group="Trading option", title="Initial balance(투자금액)", defval=100, step=0.01)


start_time = input(group="Trading option",defval=timestamp('15 March 2023 06:00'), title='Start Time', type = input.time)
end_time = input(group="Trading option",defval=timestamp('31 Dec 2035 20:00'), title='End Time', type = input.time)
isAfterStartDate = true

tradingtime= (timenow - start_time)/(86400000*30)
yeartime=tradingtime/12


f_getGridBounds(_bs, _bl, _bd, _up) =>
    if _bs == "Hi & Low"
        _up ? highest(close, _bl) * (1 + _bd) : lowest(close, _bl)  * (1 - _bd)
    else
        avg = sma(close, _bl)
        _up ? avg * (1 + _bd) : avg * (1 - _bd)

f_buildGrid(_lb, _gw, _gq) =>
    gridArr = array.new_float(0)
    for i=0 to _gq-1
        array.push(gridArr, _lb+(_gw*i))
    gridArr

f_getNearGridLines(_gridArr, _price) =>
    arr = array.new_int(3)
    for i = 0 to array.size(_gridArr)-1
        if array.get(_gridArr, i) > _price
            array.set(arr, 0, i == array.size(_gridArr)-1 ? i : i+1)
            array.set(arr, 1, i == 0 ? i : i-1)
            break
    arr

var upperBound      = i_autoBounds ? f_getGridBounds(i_boundSrc, i_boundLookback, i_boundDev, true) : i_upperBound  // upperbound of our grid
var lowerBound      = i_autoBounds ? f_getGridBounds(i_boundSrc, i_boundLookback, i_boundDev, false) : i_lowerBound // lowerbound of our grid
var gridWidth       = (upperBound - lowerBound)/(i_gridQty-1)                                                       // space between lines in our grid
var gridLineArr     = f_buildGrid(lowerBound, gridWidth, i_gridQty)                                                 // an array of prices that correspond to our grid lines
var orderArr        = array.new_bool(i_gridQty, false)                                                              // a boolean array that indicates if there is an open order corresponding to each grid line

var closeLineArr    = f_getNearGridLines(gridLineArr, close)                                                        // for plotting purposes - an array of 2 indices that correspond to grid lines near price
var nearTopGridLine = array.get(closeLineArr, 0)                                                                    // for plotting purposes - the index (in our grid line array) of the closest grid line above current price
var nearBotGridLine = array.get(closeLineArr, 1)                                                                    // for plotting purposes - the index (in our grid line array) of the closest grid line below current price
if isAfterStartDate
    for i = 0 to (array.size(gridLineArr) - 1)
        if close < array.get(gridLineArr, i) and not array.get(orderArr, i) and i < (array.size(gridLineArr) - 1)
            buyId = i
            array.set(orderArr, buyId, true)
            strategy.entry(id=tostring(buyId), long=true, qty=(initial_balance/(i_gridQty-1))/close, comment="#"+tostring(buyId))
        if close > array.get(gridLineArr, i) and i != 0
            if array.get(orderArr, i-1)
                sellId = i-1
                array.set(orderArr, sellId, false)
                strategy.close(id=tostring(sellId), comment="#"+tostring(sellId))

    if i_autoBounds
        upperBound  := f_getGridBounds(i_boundSrc, i_boundLookback, i_boundDev, true)
        lowerBound  := f_getGridBounds(i_boundSrc, i_boundLookback, i_boundDev, false)
        gridWidth   := (upperBound - lowerBound)/(i_gridQty-1)
        gridLineArr := f_buildGrid(lowerBound, gridWidth, i_gridQty)

    closeLineArr    := f_getNearGridLines(gridLineArr, close)
    nearTopGridLine := array.get(closeLineArr, 0)
    nearBotGridLine := array.get(closeLineArr, 1)


var table table = table.new(position.top_right,6,8, frame_color = color.rgb(255, 255, 255),frame_width = 2,border_width = 2, border_color=color.rgb(255, 255, 255))


//제목
table.cell(table,0,0,"상단 라인 :", bgcolor=color.new(color.black,0),text_color =color.white)
table.cell(table,0,1,"하단 라인 :",bgcolor=color.new(color.black,0),text_color =color.white)
table.cell(table,0,2,"그리드 수 :",bgcolor=color.new(color.black,0),text_color =color.white)
table.cell(table,0,3,"투자금액 :",text_color =color.white,bgcolor=color.new(color.black,0))
table.cell(table,0,4,"그리드당 투자금액 :",text_color =color.white,bgcolor=color.new(color.black,0))
//수치
table.cell(table,1,0, tostring(upperBound, '###.#####')+ "  USDT", bgcolor=color.new(#5a637e, 0),text_color =color.white)
table.cell(table,1,1, tostring(lowerBound, '###.#####')+ "  USDT", bgcolor=color.new(#5a637e, 0),text_color =color.white)
table.cell(table,1,2, tostring(i_gridQty, '###'), bgcolor=color.new(#5a637e, 0),text_color =color.white)
table.cell(table,1,3, tostring(initial_balance,'###.##')+ "  USDT", bgcolor=color.new(#5a637e, 0),text_color =color.white)
table.cell(table,1,4, tostring(initial_balance/i_gridQty,'###.##')+ "  USDT", bgcolor=color.new(#5a637e, 0),text_color =color.white)

//제목
table.cell(table,2,0,"현재 포지션 :",text_color =color.white,bgcolor=color.new(color.black,0))
table.cell(table,2,1,"현재 포지션 평단가 :",text_color =color.white,bgcolor=color.new(color.black,0))
table.cell(table,2,2,"현재 포지션 수익 :",bgcolor=color.new(color.black,0),text_color =color.white)
table.cell(table,2,3,"현재 포지션 수익 % :",bgcolor=color.new(color.black,0),text_color =color.white)
table.cell(table,2,4,"현재 포지션 수수료 :",text_color =color.white,bgcolor=color.new(color.black,0))

//수치
table.cell(table,3,0, tostring(strategy.position_size) +   syminfo.basecurrency + "\n"  + tostring(strategy.position_size*strategy.position_avg_price/1, '###.##') + "USDT" ,text_color =color.white,bgcolor=color.new(#5a637e, 0))
table.cell(table,3,1, text=strategy.position_size>0 ? tostring(strategy.position_avg_price,'###.####')+ "  USDT" : "NOT TRADING",text_color =color.white,bgcolor=color.new(#5a637e, 0))
table.cell(table,3,2, tostring(strategy.openprofit, '###.##')+ "  USDT",text_color =color.white,bgcolor=strategy.openprofit > 0 ? color.teal : color.maroon)
table.cell(table,3,3, tostring(strategy.openprofit/initial_balance*100, '###.##')+ "%",text_color =color.white,bgcolor=strategy.openprofit > 0 ? color.teal : color.maroon)
table.cell(table,3,4, "-" + tostring(strategy.position_avg_price*strategy.position_size*0.025/100,'###.##')+ "  USDT",text_color =color.white,bgcolor=color.new(#5a637e, 0))

//제목
table.cell(table,4,0,"그리드 수익 :",text_color =color.white,bgcolor=color.new(color.black,0))
table.cell(table,4,1,"그리드 수익률 :",text_color =color.white,bgcolor=color.new(color.black,0))
table.cell(table,4,2,"총 수익 :", bgcolor=color.new(color.black,0),text_color =color.white)
table.cell(table,4,3,"총 수익률 :",bgcolor=color.new(color.black,0),text_color =color.white)
table.cell(table,4,4,"현재 자산 :",bgcolor=color.new(color.black,0),text_color =color.white)


//수치
table.cell(table,5,0, tostring(strategy.netprofit, '###.#####')+ "USDT", text_color =color.white,bgcolor=strategy.netprofit > 0 ? color.teal : color.maroon)
table.cell(table,5,1, tostring((strategy.netprofit)/initial_balance*100/tradingtime, '####.##') + "%",text_color =color.white,bgcolor=strategy.netprofit > 0 ? color.teal : color.maroon)
table.cell(table,5,2, tostring(strategy.netprofit+strategy.openprofit, '###.##') + "  USDT",text_color =color.white,bgcolor=strategy.netprofit+strategy.openprofit > 0 ? color.teal : color.maroon)
table.cell(table,5,3, tostring((strategy.netprofit+strategy.openprofit)/initial_balance*100, '####.##') + "%",text_color =color.white,bgcolor=strategy.netprofit+strategy.openprofit > 0 ? color.teal : color.maroon)
table.cell(table,5,4, tostring(initial_balance+strategy.netprofit+strategy.openprofit, '###.##')+ "  USDT", text_color =color.white,bgcolor=color.new(#3d4d7c, 0))


// plot(strategy.initial_capital+ strategy.netprofit+strategy.openprofit, "총 수익 USDT",color=color.rgb(81, 137, 128))
// plot(initial_balance, "투자금액",color=color.rgb(81, 137, 128))