پرچم بریک آؤٹ حکمت عملی
جائزہ
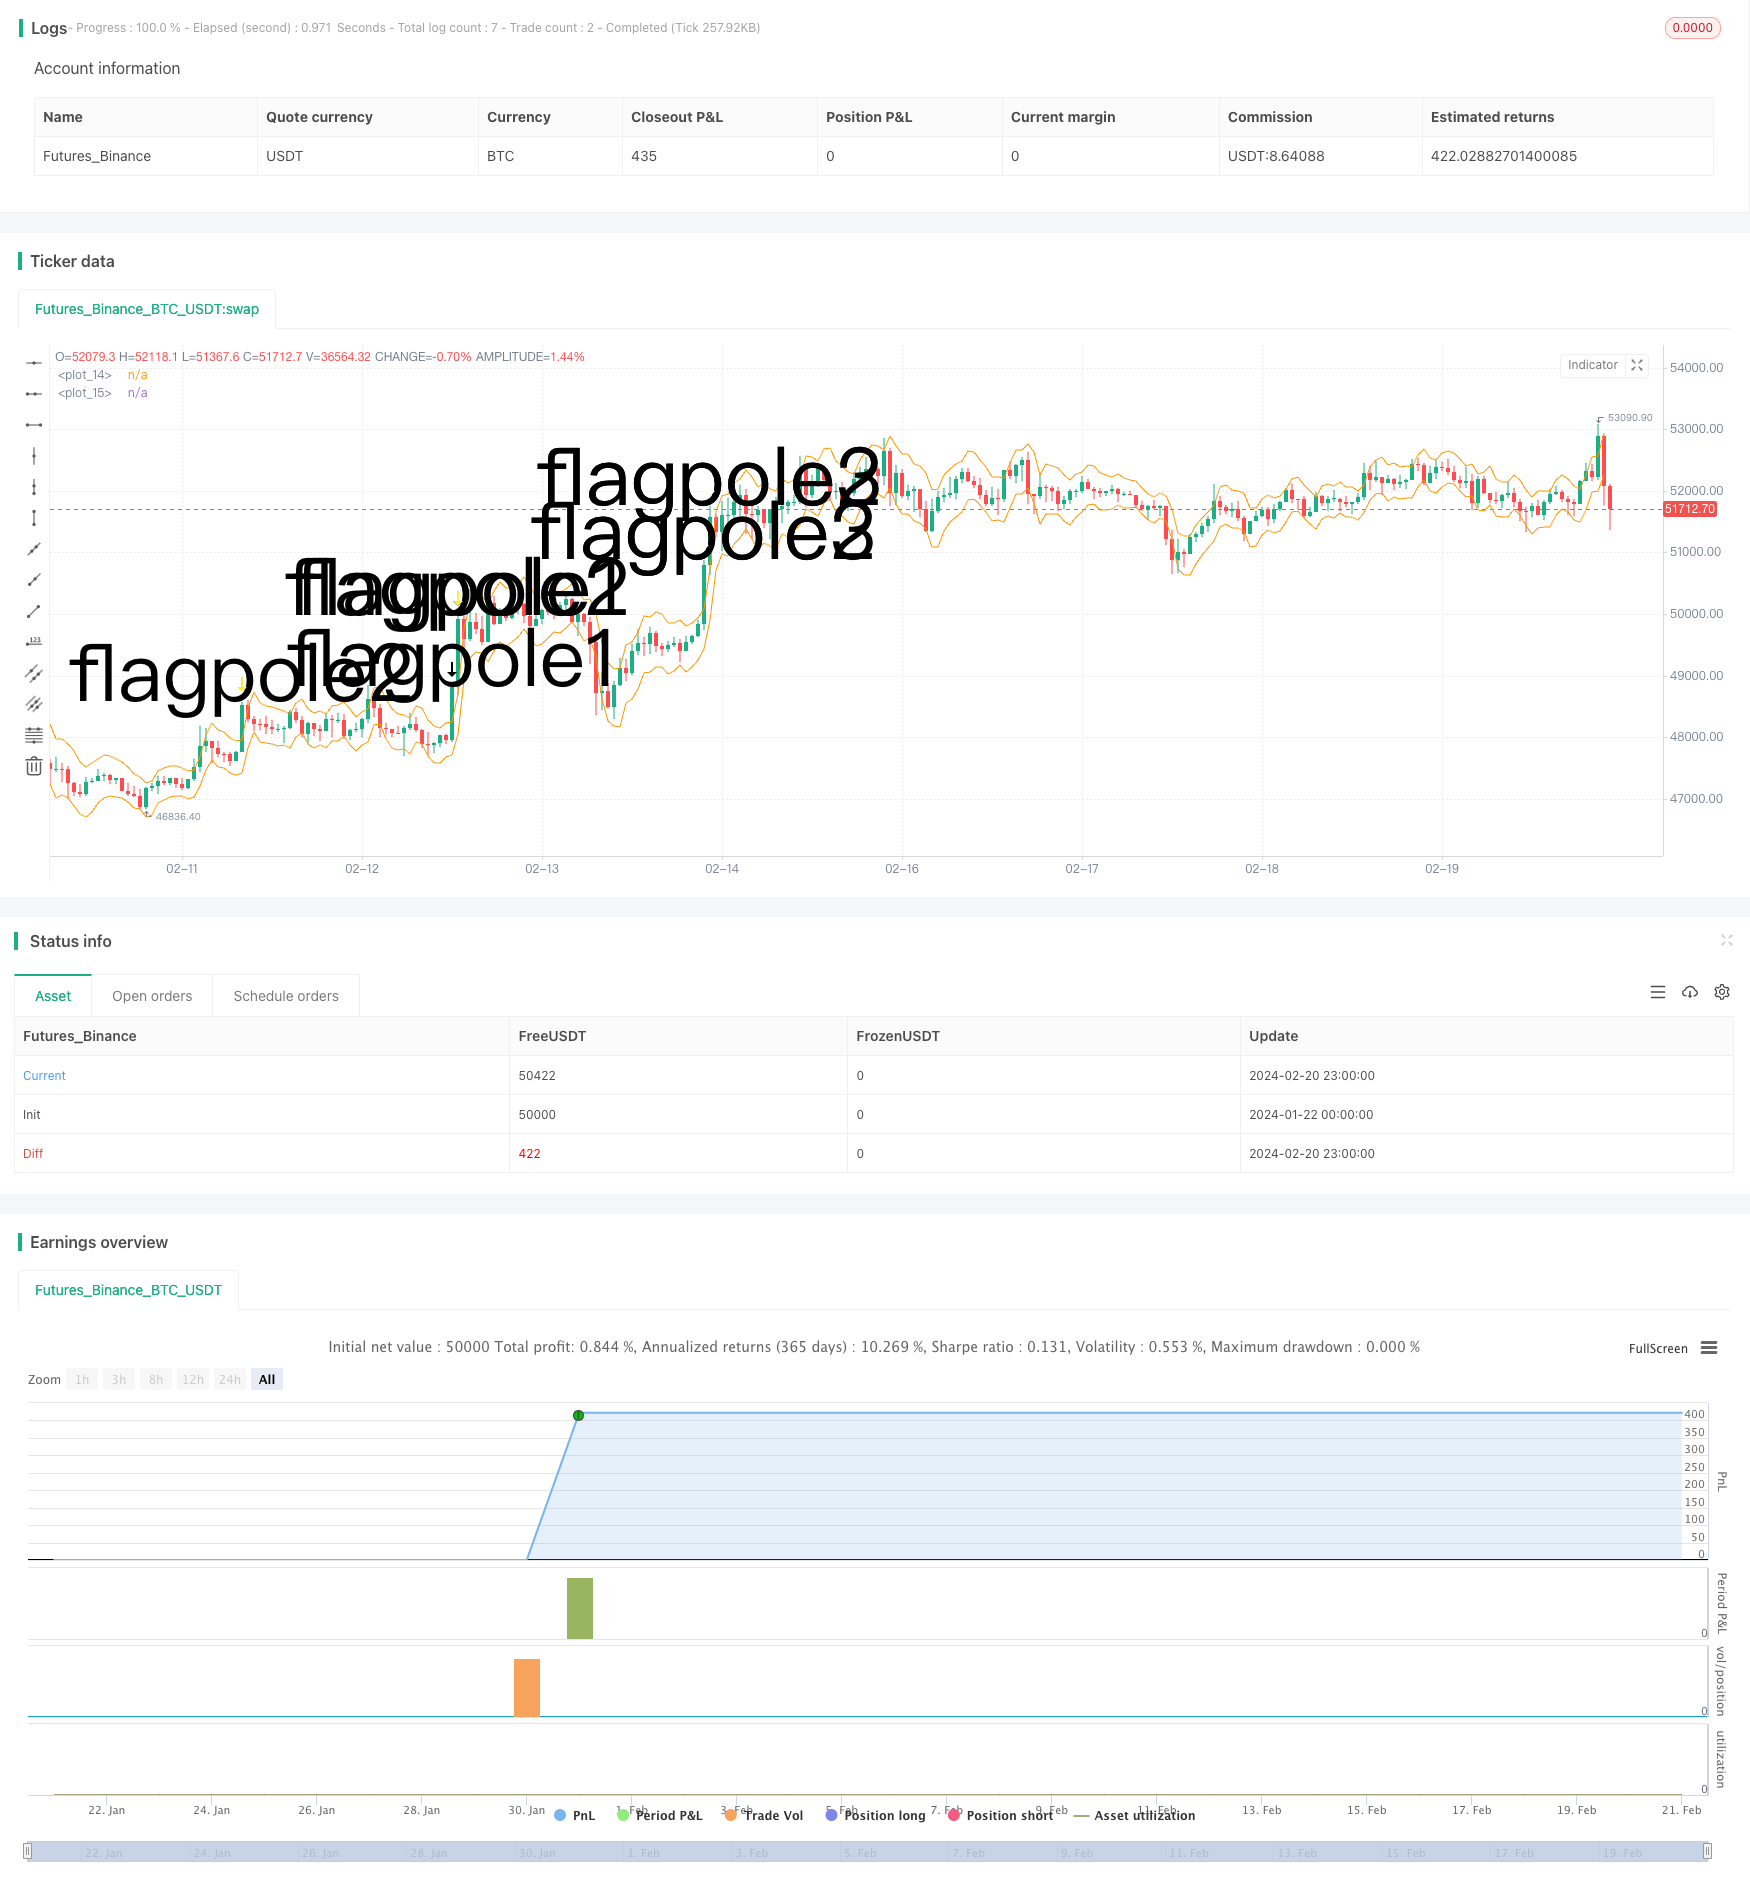
پرچم توڑنے کی حکمت عملی ایک تکنیکی تجزیہ کی حکمت عملی ہے جس کا مقصد رجحانات کو پکڑنے کے لئے پرچم گراف کی نشاندہی کرکے اور اس کے نقطہ نظر کو توڑنے کے لئے شروع کرنا ہے۔ یہ حکمت عملی اوسط حقیقی اتار چڑھاؤ کی حد (ATR) کے اشارے کے معاون فیصلے کا استعمال کرتی ہے تاکہ واضح پرچم کے بعد پرچم کی حد کا فیصلہ کیا جاسکے ، تاکہ داخلے کے مواقع کو چھانٹ لیا جاسکے۔
حکمت عملی کا اصول
اس حکمت عملی میں مندرجہ ذیل اہم اقدامات شامل ہیں:
- فائنل پرچم: قیمتوں میں جدت طرازی اور اے ٹی آر چینل کو توڑنے کی ضرورت ہے۔
- پرچم کی اونچائی کا تعین کریں: پرچم کی چوٹی سے پچھلے ایس ایم اے کے فاصلے کی پیمائش کریں۔
- جھنڈے کی حد مقرر کریں: جھنڈے کا نچلا نقطہ جھنڈے کی اونچائی کا 33٪ ہے ، جو جھنڈے کی کم سے کم حد ہے۔
- جھنڈے کی قسم کا تعین کریں: فیصلہ کریں کہ آیا پہلی 3 K لائنیں تمام جھنڈے کی حد میں ہیں۔
- داخلہ: جھنڈے کی صورت میں زیادہ سے زیادہ۔
- باہر نکلیں: 6 K لائنوں کے بعد صفائی کا مستقل انعقاد
جھنڈے اور جھنڈوں کا فیصلہ کرتے وقت ، حکمت عملی نے واضح طور پر توڑنے کا فیصلہ کرنے کے لئے اے ٹی آر کے اشارے کا چالاکی سے استعمال کیا ، اور جھنڈے کی اونچائی کو جھنڈے کی اونچائی کے 33٪ کے اندر سختی سے محدود کیا ، تاکہ بہت زیادہ جعلی سگنل سے بچا جاسکے۔ اس کے علاوہ ، یہ فیصلہ کیا گیا ہے کہ مسلسل 3 K لائنیں جھنڈے کی تشکیل کرتی ہیں ، جس کی اعلی وشوسنییتا ہے۔ مجموعی طور پر ، حکمت عملی کے قواعد کو سختی سے ڈیزائن کیا گیا ہے ، اور رجحانات کو پکڑنے کے لئے ابتدائی توڑنے میں واقعی ایک خاص فائدہ ہے۔
طاقت کا تجزیہ
اس حکمت عملی کے کچھ اہم فوائد یہ ہیں:
- رجحانات کا تعین کرنے کے لئے پرچم کی ساخت کا استعمال کرتے ہوئے شروع کرنا تکنیکی تجزیہ کا ایک کلاسک طریقہ ہے ، جس میں کامیابی کی شرح زیادہ ہے۔
- اے ٹی آر اشارے اور سخت رینج کی پابندی سے بہت سارے جھوٹے اشارے سے بچنے اور داخلے کی درستگی میں اضافہ ہوتا ہے۔
- فکسڈ 6K لائن آؤٹ پٹ سے منافع میں سے کچھ کو لاک کیا جاسکتا ہے ، جس سے رجحان کو تبدیل کرنے کا خطرہ ہوتا ہے۔
- حکمت عملی کے قواعد واضح ہیں، ان پر عمل درآمد آسان ہے، ان کو سمجھنا اور ان پر عمل کرنا آسان ہے۔
- اس کے علاوہ، آپ کو مختلف حالات میں مواقع تلاش کرنے کے لئے زیادہ لچکدار ہونا چاہئے.
خطرے کا تجزیہ
اس حکمت عملی کے اہم خطرات میں شامل ہیں:
- اس کے علاوہ ، یہ بھی کہا گیا ہے کہ اس طرح کے جھنڈوں میں بہت سے ناکامیاں بھی ہوتی ہیں ، جن میں سے کچھ کو ابھی تک مکمل طور پر نہیں دیکھا گیا ہے۔
- 6K لائنوں کا انتخاب بہت بے جا ہے اور اس کی وجہ سے یہ ممکن ہے کہ وہ جلد ہی باہر نکل جائیں۔
- اس کے علاوہ ، یہ بھی کہا گیا ہے کہ اس کے نتیجے میں ، اس کے نتیجے میں ، اس کے نتیجے میں ، اس کے نتیجے میں ، اس کے نتیجے میں۔
- انفرادی نقصانات کو مؤثر طریقے سے کنٹرول کرنے میں ناکام۔
مندرجہ بالا خطرے کے لئے، ہم سٹاپ نقصان کی حکمت عملی قائم کر سکتے ہیں، یا باہر نکلنے کے طریقہ کار کو بہتر بنانے، منافع کا ایک خاص تناسب تک پہنچنے پر وقت میں منافع کا خاتمہ. اس کے علاوہ، ہم دوسرے اشارے کے ساتھ مل کر فلٹرنگ کر سکتے ہیں، جب مارکیٹ میں بہت زیادہ ہلچل پیدا کرنے سے بچنے کے لئے.
اصلاح کی سمت
اس حکمت عملی کو مندرجہ ذیل طریقوں سے بہتر بنایا جاسکتا ہے:
- MACD، KD اور دیگر اشارے کے مجموعے کا استعمال کرتے ہوئے، زلزلے کے حالات میں غلط سگنل سے بچنے کے لئے.
- مارکیٹ کے زمرے کے مطابق اے ٹی آر ضرب ، دورانیہ وغیرہ کو پیرامیٹرائز کرنا ، حکمت عملی کو زیادہ موافقت بخش بناتا ہے۔
- متحرک کھیلنے کے مقابلے میں موزوں اسٹاپ نقصان یا منافع کی واپسی پر غور کریں۔
- مشین لرننگ کے طریقوں کو آزمائیں تاکہ جھنڈے کی اونچائی کا تعین کرنے کے لئے زیادہ درست خصوصیات تلاش کی جاسکیں۔
- اصل جیت کی شرح اور منافع کی شرح کا اندازہ کریں ، اور پوزیشن کے سائز کو متحرک طور پر ایڈجسٹ کریں۔
خلاصہ کریں۔
مجموعی طور پر ، پرچم بردار توڑنے کی حکمت عملی تکنیکی شکل کے فیصلے کے رجحان کا استعمال کرتے ہوئے شروع ہوتی ہے ، یہ ایک زیادہ کلاسیکی طریقہ ہے ، جو داخلے کے قواعد کے ڈیزائن پر سخت ہے ، اور بہت سارے جعلی سگنلوں کو فلٹر کرسکتا ہے۔ تاہم ، خطرے پر قابو پانے اور باہر نکلنے کے میکانزم میں ابھی بھی اصلاح کی گنجائش موجود ہے ، اور ہم اس حکمت عملی کو مختلف مارکیٹوں میں مستحکم کام کرنے کے لئے مجموعی طور پر غور کرسکتے ہیں۔ اگر اس کی جانچ پڑتال اور اصلاح کی جائے تو ، یہ حکمت عملی کوانٹم ٹریڈنگ سسٹم کا ایک قیمتی جزو بن سکتی ہے۔
/*backtest
start: 2024-01-22 00:00:00
end: 2024-02-21 00:00:00
period: 1h
basePeriod: 15m
exchanges: [{"eid":"Futures_Binance","currency":"BTC_USDT"}]
*/

// © smith26
//This strategy enters on a bull flag and closes position 6 bars later.  Average true range is used instead of a moving average.
//The reason for ATR instead of MA is because with volatile securities, the flagpole must stand up a noticable "distance" above the trading range---which you can't determine with a MA alone.
//This is broken up into multiple parts: Defining a flagpole, defining the pole height, and defining the flag, which will be constrained to the top third (33%) of the pole height to be considered a flag.
//@version=4
strategy("Bull Flag v1.00", overlay=true)

ATR = atr(10) //Average True Range over last 10 bars.

upperATR = ohlc4[1] + ATR[1]  //Open + High + Low + Close divided by 4, + prior ATR.  Just used here for visually plotting the ATR upper channel.
lowerATR = ohlc4[1] - ATR[1] //Open + High + Low + Close divided by 4, - prior ATR.  Just used here for visually plotting the ATR lower channel.

//uncomment these two lines to see ATR channels
plot(upperATR, color=color.orange)
plot (lowerATR, color=color.orange)

//Current close higher than previous close, and current close minus current open is greater than 3 times the previous ATR.  "3x ATR" is chosen because any less was not a noticeable distance above the trading range.
flagpole1 = close>close[1] and (close-open) > (ATR[1] * 3)
plotshape(flagpole1, text="flagpole1", style=shape.arrowdown, size=size.huge) //Plots an arrow for flagpole1 for QA testing

//Two consecutive close higer than their previous close, and current close minus PREVIOUS open is greater than 3 times the previous ATR.
flagpole2 = close>close[1] and close[1]>close[2] and (close-open[1]) > (ATR[1] * 3)
plotshape(flagpole2, text="flagpole2", style=shape.arrowdown, size=size.huge, color=color.yellow) //Plots an arrow for flagpole2 for QA testing

//Three consecutive close higer than their previous close, and current close minus open from 2 bars ago is greater than 3 times the previous ATR.
flagpole3 = close>close[1] and close[1]>close[2] and close[2]>close[3] and (close-open[2]) > (ATR[1] * 3)
plotshape(flagpole3, text="flagpole3", style=shape.arrowdown, size=size.huge, color=color.white) //Plots an arrow for flagpole3 for QA testing

//A flagpole can be any of the three definitions of flagpole.
flagpole = flagpole1 or flagpole2 or flagpole3

//This will return the number of bars since "flagpole" was true.  Not being used, but could be useful.
//since_flagpole = barssince(flagpole)

after_pole_1 = flagpole[1] //This marks the bar directly after a flagpole.
//plotshape(after_pole_1, text="after_pole_1", style=shape.cross, size=size.large, color=color.white) //Plots a cross for after_pole_1 for QA testing
after_pole_2 = flagpole[2] //This marks the bar two bars after a flagpole.
after_pole_3 = flagpole[3] //This marks the bar three bars after a flagpole.

//This returns the price at the "top" of the flagpole (using close price) at the most recent occurence, 0.
pole_top = valuewhen(flagpole, close, 0)
//plot(pole_top, trackprice=true)  //plots a horizontal line at the most recent pole_top

//Measures the distance between last pole top and the previous SMA.
pole_height = pole_top - sma(close, 10)[1]
//plot(pole_height)

//This marks 33% below the pole_top, which will be the lowest point a flag can be.
flag_bottom = pole_top - (.33 * pole_height)
//plot(flag_bottom)

//The first, second, and third bars after the pole are considered part of a flag when open and close are between the pole_top and flag_bottom
flag1 = after_pole_1 and (open >= flag_bottom) and (open <= pole_top) and (close >= flag_bottom) and (close <= pole_top)
//plotshape(flag1, text="flag1", style=shape.flag, size=size.large, color=color.teal)
flag2 = after_pole_2 and (open >= flag_bottom) and (open <= pole_top) and (close >= flag_bottom) and (close <= pole_top)
//plotshape(flag2, text="flag2", style=shape.flag, size=size.large, color=color.teal)
flag3 = after_pole_3 and (open >= flag_bottom) and (open <= pole_top) and (close >= flag_bottom) and (close <= pole_top)
//plotshape(flag3, text="flag3", style=shape.flag, size=size.large, color=color.teal)

//When all three bars after a flagpole are a flag, the criteria are met and we have a "bull_flag"
//Specifically, when current bar is flag3, previous bar is flag2, and 2 bars ago is flag1, we have a bull_flag.
bull_flag = flag3 and flag2[1] and flag1[2]
plotshape(bull_flag, text="bull_flag", style=shape.flag, size=size.large, color=color.white) //Plots a flag for bull_flag for QA testing


if (bull_flag)
    strategy.entry("Long", strategy.long)

if barssince(bull_flag) == 6 //close 6 bars after entry.
    strategy.close("Long")