ٹرپل اوورلیپ سپر ٹرینڈ حکمت عملی
جائزہ
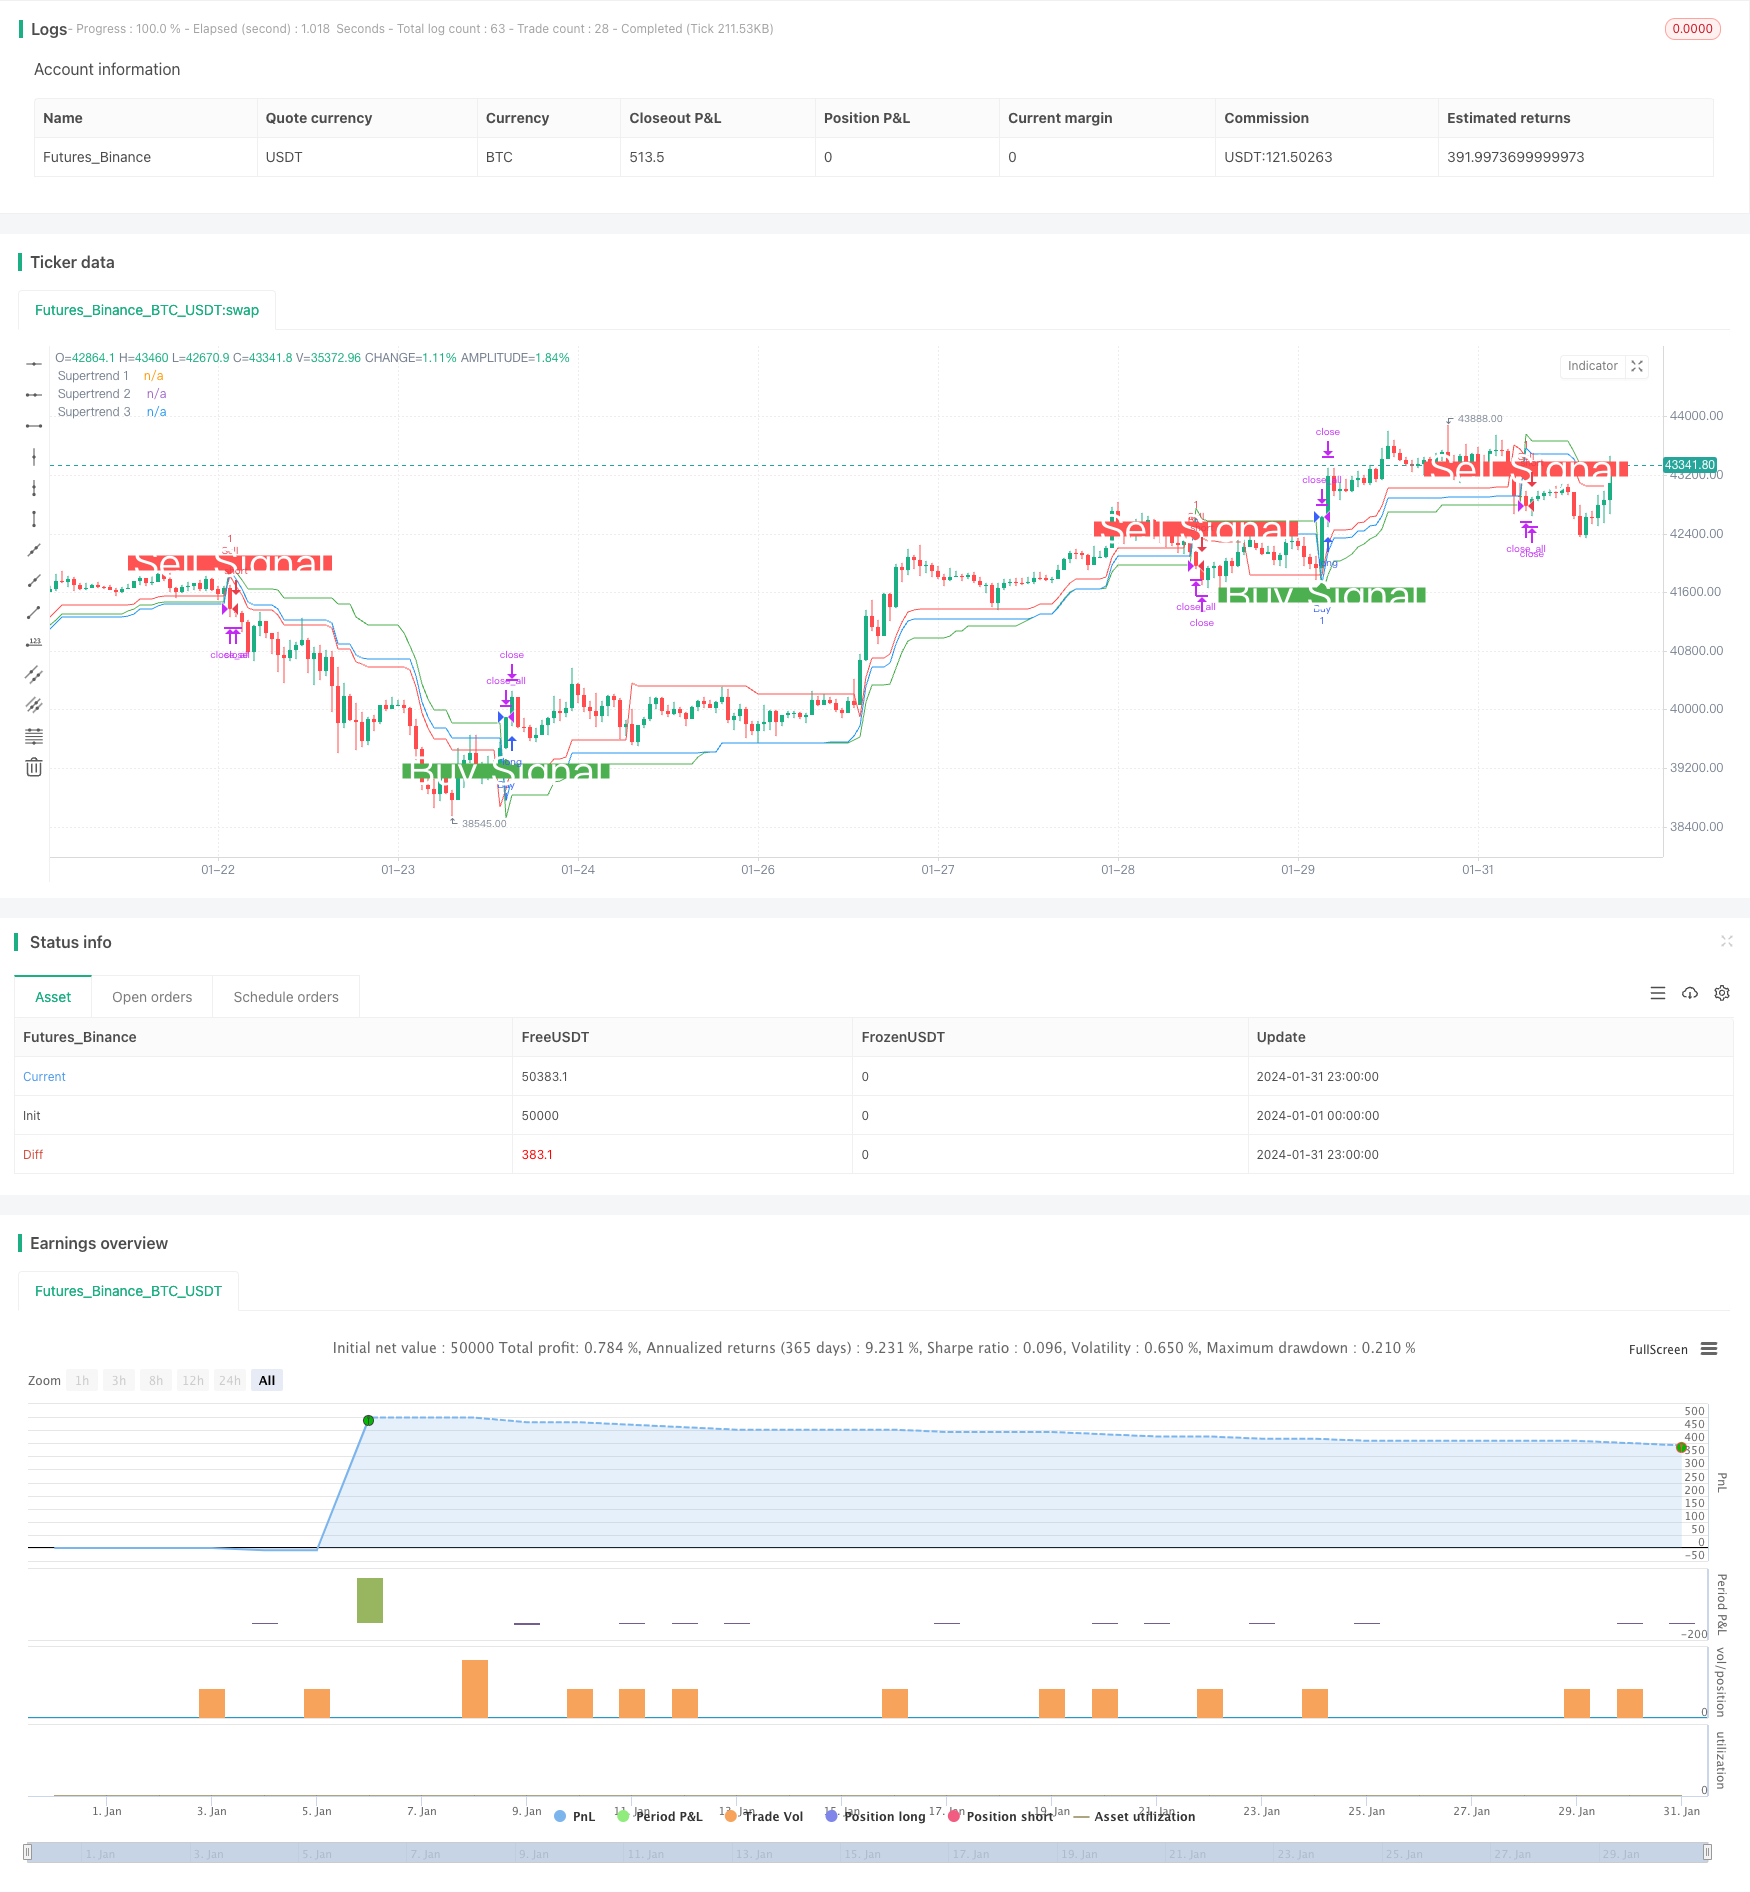
یہ ایک حکمت عملی ہے جس میں ٹریڈنگ کے فیصلے کے لئے ٹرپل اور سپر ٹرینڈ اشارے کا استعمال کیا جاتا ہے۔ یہ رجحان کے حالات میں بڑے سمت کے مواقع کو پکڑ سکتا ہے۔
حکمت عملی کا اصول
یہ حکمت عملی ta.supertrend() فنکشن کا استعمال کرتی ہے جو تین مختلف پیرامیٹرز کے سیٹ کے ساتھ ایک سپر ٹرینڈ اشارے کا حساب لگاتا ہے۔ 10 دن 3 گنا اے ٹی آر کا ایک سپر ٹرینڈ ، 1 ، 14 دن 2 گنا اے ٹی آر کا ایک سپر ٹرینڈ ، 2 ، اور 20 دن 2.5 گنا اے ٹی آر کا ایک سپر ٹرینڈ 3۔ جب قیمت تمام تین سپر ٹرینڈز کو عبور کرتی ہے تو خریدنے کا اشارہ پیدا کرتی ہے۔ جب قیمت تمام تین سپر ٹرینڈز کو عبور کرتی ہے تو فروخت کا اشارہ پیدا کرتی ہے۔
ٹرانس ٹرینڈ اشارے کے ساتھ مل کر اے ٹی آر اشارے ، قیمتوں میں تبدیلی کے رجحانات کو مؤثر طریقے سے ٹریک کرنے کے قابل ہے۔ ٹرپل سپر ٹرینڈ کی حکمت عملی ، سگنل کو زیادہ قابل اعتماد بناتی ہے ، جس سے رجحانات کی صورتحال میں زیادہ سے زیادہ منافع ہوتا ہے۔
اسٹریٹجک فوائد
- ٹرپل فلٹرنگ میکانزم ، جعلی سگنل سے بچنے اور سگنل کے معیار کو بہتر بنانا
- ٹرانسمیشن اشارے خود ہی بہتر شور مٹانے کی خصوصیات رکھتے ہیں
- وسیع تر مارکیٹ کے ماحول کو اپنانے کے لئے ایک سے زیادہ سپر پیرامیٹرز کے مجموعے کو ترتیب دیں
- تاریخی ٹیسٹ میں اچھی کارکردگی، منافع کے مقابلے میں زیادہ خطرہ
اسٹریٹجک رسک
- ملٹی فلٹرنگ سگنل شاید کچھ مواقع سے محروم رہے
- زلزلے کے دوران کارکردگی اچھی نہیں رہی
- تین گروپوں کے مجموعے کو بہتر بنانے کی ضرورت ہے
- سینٹرائزڈ ٹریڈنگ کے اوقات میں غیر متوقع واقعات کا خطرہ ہوتا ہے
اس خطرے کو کم کرنے کے لیے مندرجہ ذیل نکات پر غور کیا جا سکتا ہے:
- فلٹرنگ کے حالات کو ایڈجسٹ کریں، ایک یا دو سپر رجحانات کو برقرار رکھیں
- زیادہ سے زیادہ سٹاپ نقصان کی حکمت عملی
- سپر پیرامیٹرز کو بہتر بنائیں اور جیت کی شرح میں اضافہ کریں
حکمت عملی کی اصلاح کی سمت
- بہترین سپر پیرامیٹرز تلاش کرنے کے لئے مزید پیرامیٹرز کے مجموعے کی جانچ کریں
- مشین لرننگ الگورتھم میں اضافہ ، پیرامیٹرز کو حقیقی وقت میں بہتر بنانا
- نقصانات کو روکنے کے لئے حکمت عملی میں اضافہ
- دیگر اشارے کے ساتھ مل کر، رجحانات اور جھٹکے کی شناخت
- تجارت کے وقت میں توسیع، ایک وقت کے نوڈ کے خطرے سے بچنے کے
خلاصہ کریں۔
اس حکمت عملی میں ٹریپل اوورلیپنگ سپر ٹرینڈ کے ذریعہ فیصلے کیے جاتے ہیں ، جس سے رجحان کی سمت کو مؤثر طریقے سے پہچان لیا جاسکتا ہے۔ اس میں سگنل کے اعلی معیار ، پیرامیٹرز کو بہتر بنانے جیسے فوائد ہیں۔ اس کے ساتھ ہی ، کچھ خطرات بھی موجود ہیں ، مختلف مارکیٹ کے حالات کے مطابق پیرامیٹرز اور باہر نکلنے کے وقت کو ایڈجسٹ کرنے کی ضرورت ہے۔ مجموعی طور پر ، اس حکمت عملی نے نمایاں کارکردگی کا مظاہرہ کیا ہے ، جو مزید تحقیق اور اطلاق کے قابل ہے۔
/*backtest
start: 2024-01-01 00:00:00
end: 2024-01-31 23:59:59
period: 1h
basePeriod: 15m
exchanges: [{"eid":"Futures_Binance","currency":"BTC_USDT"}]
*/

//@version=5
strategy('Combined Supertrend Strategy - Ajit Prasad', overlay=true)

// Function to calculate Supertrend
supertrendFunc(atrLength, factor) =>
    [supertrend, direction] = ta.supertrend(factor, atrLength)
    [supertrend, direction]

// Input parameters for the first Supertrend
atrPeriod1 = input(10, 'ATR Length 1')
factor1 = input(3, 'Factor 1')

// Calculate the first Supertrend
[supertrend1, direction1] = supertrendFunc(atrPeriod1, factor1)

// Input parameters for the second Supertrend
atrPeriod2 = input(14, 'ATR Length 2') // Change values as needed
factor2 = input(2, 'Factor 2') // Change values as needed

// Calculate the second Supertrend
[supertrend2, direction2] = supertrendFunc(atrPeriod2, factor2)

// Input parameters for the third Supertrend
atrPeriod3 = input(20, 'ATR Length 3') // Change values as needed
factor3 = input(2.5, 'Factor 3') // Change values as needed

// Calculate the third Supertrend
[supertrend3, direction3] = supertrendFunc(atrPeriod3, factor3)

// Define market opening and closing times
marketOpenHour = 9
marketOpenMinute = 15
marketCloseHour = 15
marketCloseMinute = 30
exitTimeHour = 15
exitTimeMinute = 10

// Fetch historical close values using security function
histClose = request.security(syminfo.tickerid, "D", close)

// Buy condition
buyCondition = close > supertrend1 and close > supertrend2 and close > supertrend3 and close[1] <= supertrend1[1]

// Sell condition
sellCondition = close < supertrend1 and close < supertrend2 and close < supertrend3 and close[1] >= supertrend1[1]

// Exit conditions
buyExitCondition = close < supertrend1[1] or close < supertrend2[1] or close < supertrend3[1]
sellExitCondition = close > supertrend1[1] or close > supertrend2[1] or close > supertrend3[1]

// Execute orders with market timing
if true
    // Buy condition without 'and not'
    strategy.entry('Buy', strategy.long, when = buyCondition)

    // Sell condition without 'and not'
    strategy.entry('Sell', strategy.short, when = sellCondition)

    // Close conditions
    strategy.close('Buy', when = buyExitCondition )
    strategy.close('Sell', when = sellExitCondition)

// Close all trades at 3:10 pm IST
if true
    strategy.close_all()

// Plot Supertrends
plot(supertrend1, 'Supertrend 1', color=color.new(color.green, 0), style=plot.style_linebr)
plot(supertrend2, 'Supertrend 2', color=color.new(color.red, 0), style=plot.style_linebr)
plot(supertrend3, 'Supertrend 3', color=color.new(color.blue, 0), style=plot.style_linebr)

// Plot labels
plotshape(buyCondition, style=shape.labelup, location=location.belowbar, color=color.new(color.green, 0), size=size.large, text='Buy Signal', textcolor=color.new(color.white, 0))
plotshape(sellCondition, style=shape.labeldown, location=location.abovebar, color=color.new(color.red, 0), size=size.large, text='Sell Signal', textcolor=color.new(color.white, 0))