مقداری حکمت عملی کے بعد دوہری رجحان


تخلیق کی تاریخ: 2024-02-27 15:54:24 آخر میں ترمیم کریں: 2024-02-27 15:54:24
کاپی: 0 کلکس کی تعداد: 579
1
پر توجہ دیں
1617
پیروکار

مقداری حکمت عملی کے بعد دوہری رجحان

جائزہ

اس حکمت عملی کا بنیادی خیال یہ ہے کہ اس حکمت عملی کی کامیابی کو بڑھانے کے لئے 123 ریورس حکمت عملی اور قوس قزح کے نوسکھئیے کے اشارے کے ساتھ مل کر دوہری رجحان کا سراغ لگانا ہے۔ یہ حکمت عملی قلیل اور درمیانی مدت کے قیمتوں کے رجحانات کا سراغ لگانے ، پوزیشنوں کو متحرک طور پر ایڈجسٹ کرنے اور بڑے بازار سے زیادہ اضافی آمدنی حاصل کرنے کی حکمت عملی ہے۔

حکمت عملی کا اصول

اس حکمت عملی کے دو حصے ہیں:

  1. 123 الٹ حکمت عملی: اگر پہلے دو دن کے اختتامی قیمت میں کمی ہوئی اور آج اختتامی قیمت میں اضافہ ہوا ، اور 9 ویں دن سست K لائن 50 سے کم ہے تو ، زیادہ کام کریں۔ اگر پہلے دو دن کے اختتامی قیمت میں اضافہ ہوا اور آج اختتامی قیمت میں کمی ہوئی ، اور 9 ویں روز فاسٹ K لائن 50 سے زیادہ ہے تو ، خالی کریں۔

  2. رینبو اوزلیٹر انڈیکیٹر: یہ اشارے قیمتوں کی حرکت پذیری اوسط سے انحراف کی عکاسی کرتا ہے۔ جب اشارے 80 سے زیادہ ہوتا ہے تو یہ ظاہر ہوتا ہے کہ مارکیٹ غیر مستحکم ہے۔ جب اشارے 20 سے کم ہوتا ہے تو یہ ظاہر ہوتا ہے کہ مارکیٹ الٹ جانے کی طرف مائل ہے۔

اس حکمت عملی میں دونوں کا امتزاج کیا گیا ہے اور ایک ہی وقت میں ایک سے زیادہ پوزیشنوں کو کھولنے کے لئے کہا گیا ہے جب ایک ڈراپ سگنل ظاہر ہوتا ہے اور دوسری صورت میں پوزیشنوں کو ختم کردیا جاتا ہے۔

طاقت کا تجزیہ

یہ حکمت عملی مندرجہ ذیل فوائد رکھتی ہے:

  1. ڈبل فلٹرنگ ، سگنل کے معیار کو بہتر بناتا ہے ، اور غلطی کی شرح کو کم کرتا ہے۔
  2. متحرک طور پر پوزیشنوں کو ایڈجسٹ کریں تاکہ ایک طرفہ تجارت میں ہونے والے نقصانات کو کم کیا جاسکے۔
  3. مختصر اور درمیانی مدت کے اشارے کو مربوط کرنا ، حکمت عملی کے استحکام کو بہتر بنانا

خطرے کا تجزیہ

اس حکمت عملی میں مندرجہ ذیل خطرات بھی ہیں:

  1. پیرامیٹرز کو غلط طریقے سے بہتر بنانا ممکنہ طور پر زیادہ مماثلت کا سبب بن سکتا ہے۔
  2. ڈبل پوزیشنوں سے ٹرانزیکشن کی لاگت میں اضافہ ہوتا ہے۔
  3. جب اشارے کی قیمت میں شدید اتار چڑھاؤ ہوتا ہے تو ، رکاوٹ کو آسانی سے شکست دی جاسکتی ہے۔

ان خطرات کو پیرامیٹرز کو ایڈجسٹ کرکے ، پوزیشن مینجمنٹ کو بہتر بنانے اور معقول طور پر اسٹاپ نقصان کی ترتیب دے کر کم کیا جاسکتا ہے۔

اصلاح کی سمت

یہ حکمت عملی مندرجہ ذیل پہلوؤں سے بہتر بنائی جا سکتی ہے۔

  1. پیرامیٹرز کو بہتر بنانے کے لئے ، بہترین پیرامیٹرز کا مجموعہ تلاش کریں۔
  2. پوزیشن مینجمنٹ ماڈیول شامل کریں تاکہ پوزیشنوں کو اتار چڑھاؤ اور واپسی کی رفتار کے مطابق ایڈجسٹ کیا جاسکے۔
  3. اسٹاپ نقصان کے ماڈیول کو شامل کریں اور موزوں اسٹاپ نقصان کو ترتیب دیں۔
  4. مشین سیکھنے کے الگورتھم کو شامل کریں جو رجحانات کو تبدیل کرنے میں مدد فراہم کرے۔

خلاصہ کریں۔

اس حکمت عملی میں 123 الٹ حکمت عملی اور قوس قزح oscillator کے اشارے کو مربوط کیا گیا ہے ، جس میں اعلی استحکام کو برقرار رکھتے ہوئے دوہری رجحان کا سراغ لگانا ہے ، جس میں اضافی آمدنی کی ایک خاص گنجائش ہے۔ اس حکمت عملی کو مستقل طور پر بہتر بنانے کے ذریعے ، اس حکمت عملی کی واپسی کی شرح کو مزید بڑھانے کی امید ہے۔
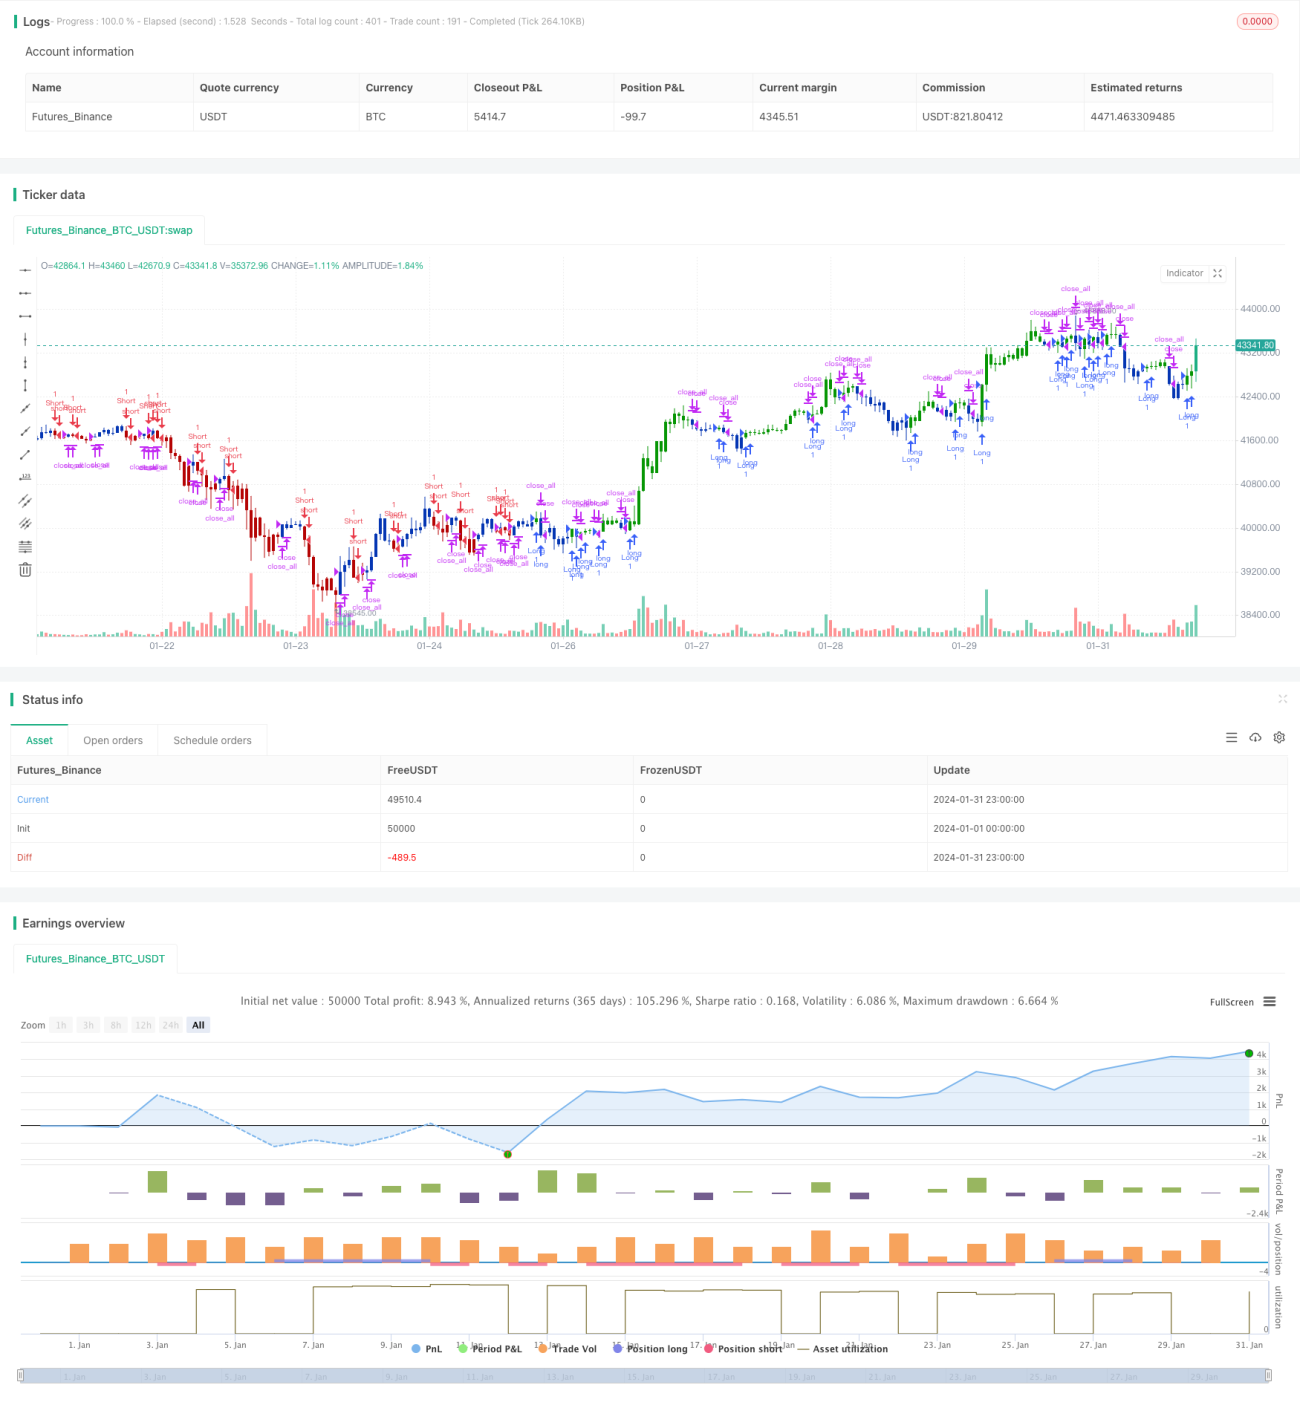
حکمت عملی کا ماخذ کوڈ
/*backtest
start: 2024-01-01 00:00:00
end: 2024-01-31 23:59:59
period: 1h
basePeriod: 15m
exchanges: [{"eid":"Futures_Binance","currency":"BTC_USDT"}]
*/

//@version=4
////////////////////////////////////////////////////////////
//  Copyright by HPotter v1.0 25/05/2021
// This is combo strategies for get a cumulative signal. 
//
// First strategy
// This System was created from the Book "How I Tripled My Money In The 
// Futures Market" by Ulf Jensen, Page 183. This is reverse type of strategies.
// The strategy buys at market, if close price is higher than the previous close 
// during 2 days and the meaning of 9-days Stochastic Slow Oscillator is lower than 50. 
// The strategy sells at market, if close price is lower than the previous close price 
// during 2 days and the meaning of 9-days Stochastic Fast Oscillator is higher than 50.
//
// Second strategy
// Ever since the people concluded that stock market price movements are not 
// random or chaotic, but follow specific trends that can be forecasted, they 
// tried to develop different tools or procedures that could help them identify 
// those trends. And one of those financial indicators is the Rainbow Oscillator 
// Indicator. The Rainbow Oscillator Indicator is relatively new, originally 
// introduced in 1997, and it is used to forecast the changes of trend direction.
// As market prices go up and down, the oscillator appears as a direction of the 
// trend, but also as the safety of the market and the depth of that trend. As 
// the rainbow grows in width, the current trend gives signs of continuity, and 
// if the value of the oscillator goes beyond 80, the market becomes more and more 
// unstable, being prone to a sudden reversal. When prices move towards the rainbow 
// and the oscillator becomes more and more flat, the market tends to remain more 
// stable and the bandwidth decreases. Still, if the oscillator value goes below 20, 
// the market is again, prone to sudden reversals. The safest bandwidth value where 
// the market is stable is between 20 and 80, in the Rainbow Oscillator indicator value. 
// The depth a certain price has on a chart and into the rainbow can be used to judge 
// the strength of the move.
//
// WARNING:
// - For purpose educate only
// - This script to change bars colors.
////////////////////////////////////////////////////////////
Reversal123(Length, KSmoothing, DLength, Level) =>
    vFast = sma(stoch(close, high, low, Length), KSmoothing) 
    vSlow = sma(vFast, DLength)
    pos = 0.0
    pos := iff(close[2] < close[1] and close > close[1] and vFast < vSlow and vFast > Level, 1,
	         iff(close[2] > close[1] and close < close[1] and vFast > vSlow and vFast < Level, -1, nz(pos[1], 0))) 
	pos


RO(Length, LengthHHLL) =>
    pos = 0.0
    xMA1 = sma(close, Length)
    xMA2 = sma(xMA1, Length)
    xMA3 = sma(xMA2, Length)
    xMA4 = sma(xMA3, Length)
    xMA5 = sma(xMA4, Length)
    xMA6 = sma(xMA5, Length)
    xMA7 = sma(xMA6, Length)
    xMA8 = sma(xMA7, Length)
    xMA9 = sma(xMA8, Length)
    xMA10 = sma(xMA9, Length)
    xHH = highest(close, LengthHHLL)
    xLL = lowest(close, LengthHHLL)
    xHHMAs = max(xMA1,max(xMA2,max(xMA3,max(xMA4,max(xMA5,max(xMA6,max(xMA7,max(xMA8,max(xMA9,xMA10)))))))))
    xLLMAs = min(xMA1,min(xMA2,min(xMA3,min(xMA4,min(xMA5,min(xMA6,min(xMA7,min(xMA8,min(xMA9,xMA10)))))))))
    xRBO = 100 * ((close - ((xMA1+xMA2+xMA3+xMA4+xMA5+xMA6+xMA7+xMA8+xMA9+xMA10) / 10)) / (xHH - xLL))
    xRB = 100 * ((xHHMAs - xLLMAs) / (xHH - xLL))
    pos:= iff(xRBO > 0, 1,
           iff(xRBO < 0, -1, nz(pos[1], 0))) 
    pos

strategy(title="Combo Backtest 123 Reversal & Rainbow Oscillator", shorttitle="Combo", overlay = true)
line1 = input(true, "---- 123 Reversal ----")
Length = input(14, minval=1)
KSmoothing = input(1, minval=1)
DLength = input(3, minval=1)
Level = input(50, minval=1)
//-------------------------
line2 = input(true, "---- Rainbow Oscillator ----")
LengthRO = input(2, minval=1)
LengthHHLL = input(10, minval=2, title="HHV/LLV Lookback")
reverse = input(false, title="Trade reverse")
posReversal123 = Reversal123(Length, KSmoothing, DLength, Level)
posRO = RO(LengthRO, LengthHHLL)
pos = iff(posReversal123 == 1 and posRO == 1 , 1,
	   iff(posReversal123 == -1 and posRO == -1, -1, 0)) 
possig = iff(reverse and pos == 1, -1,
          iff(reverse and pos == -1 , 1, pos))	   
if (possig == 1 ) 
    strategy.entry("Long", strategy.long)
if (possig == -1 )
    strategy.entry("Short", strategy.short)	 
if (possig == 0) 
    strategy.close_all()
barcolor(possig == -1 ? #b50404: possig == 1 ? #079605 : #0536b3 )