متحرک engulfing رجحان حکمت عملی پر مبنی
جائزہ
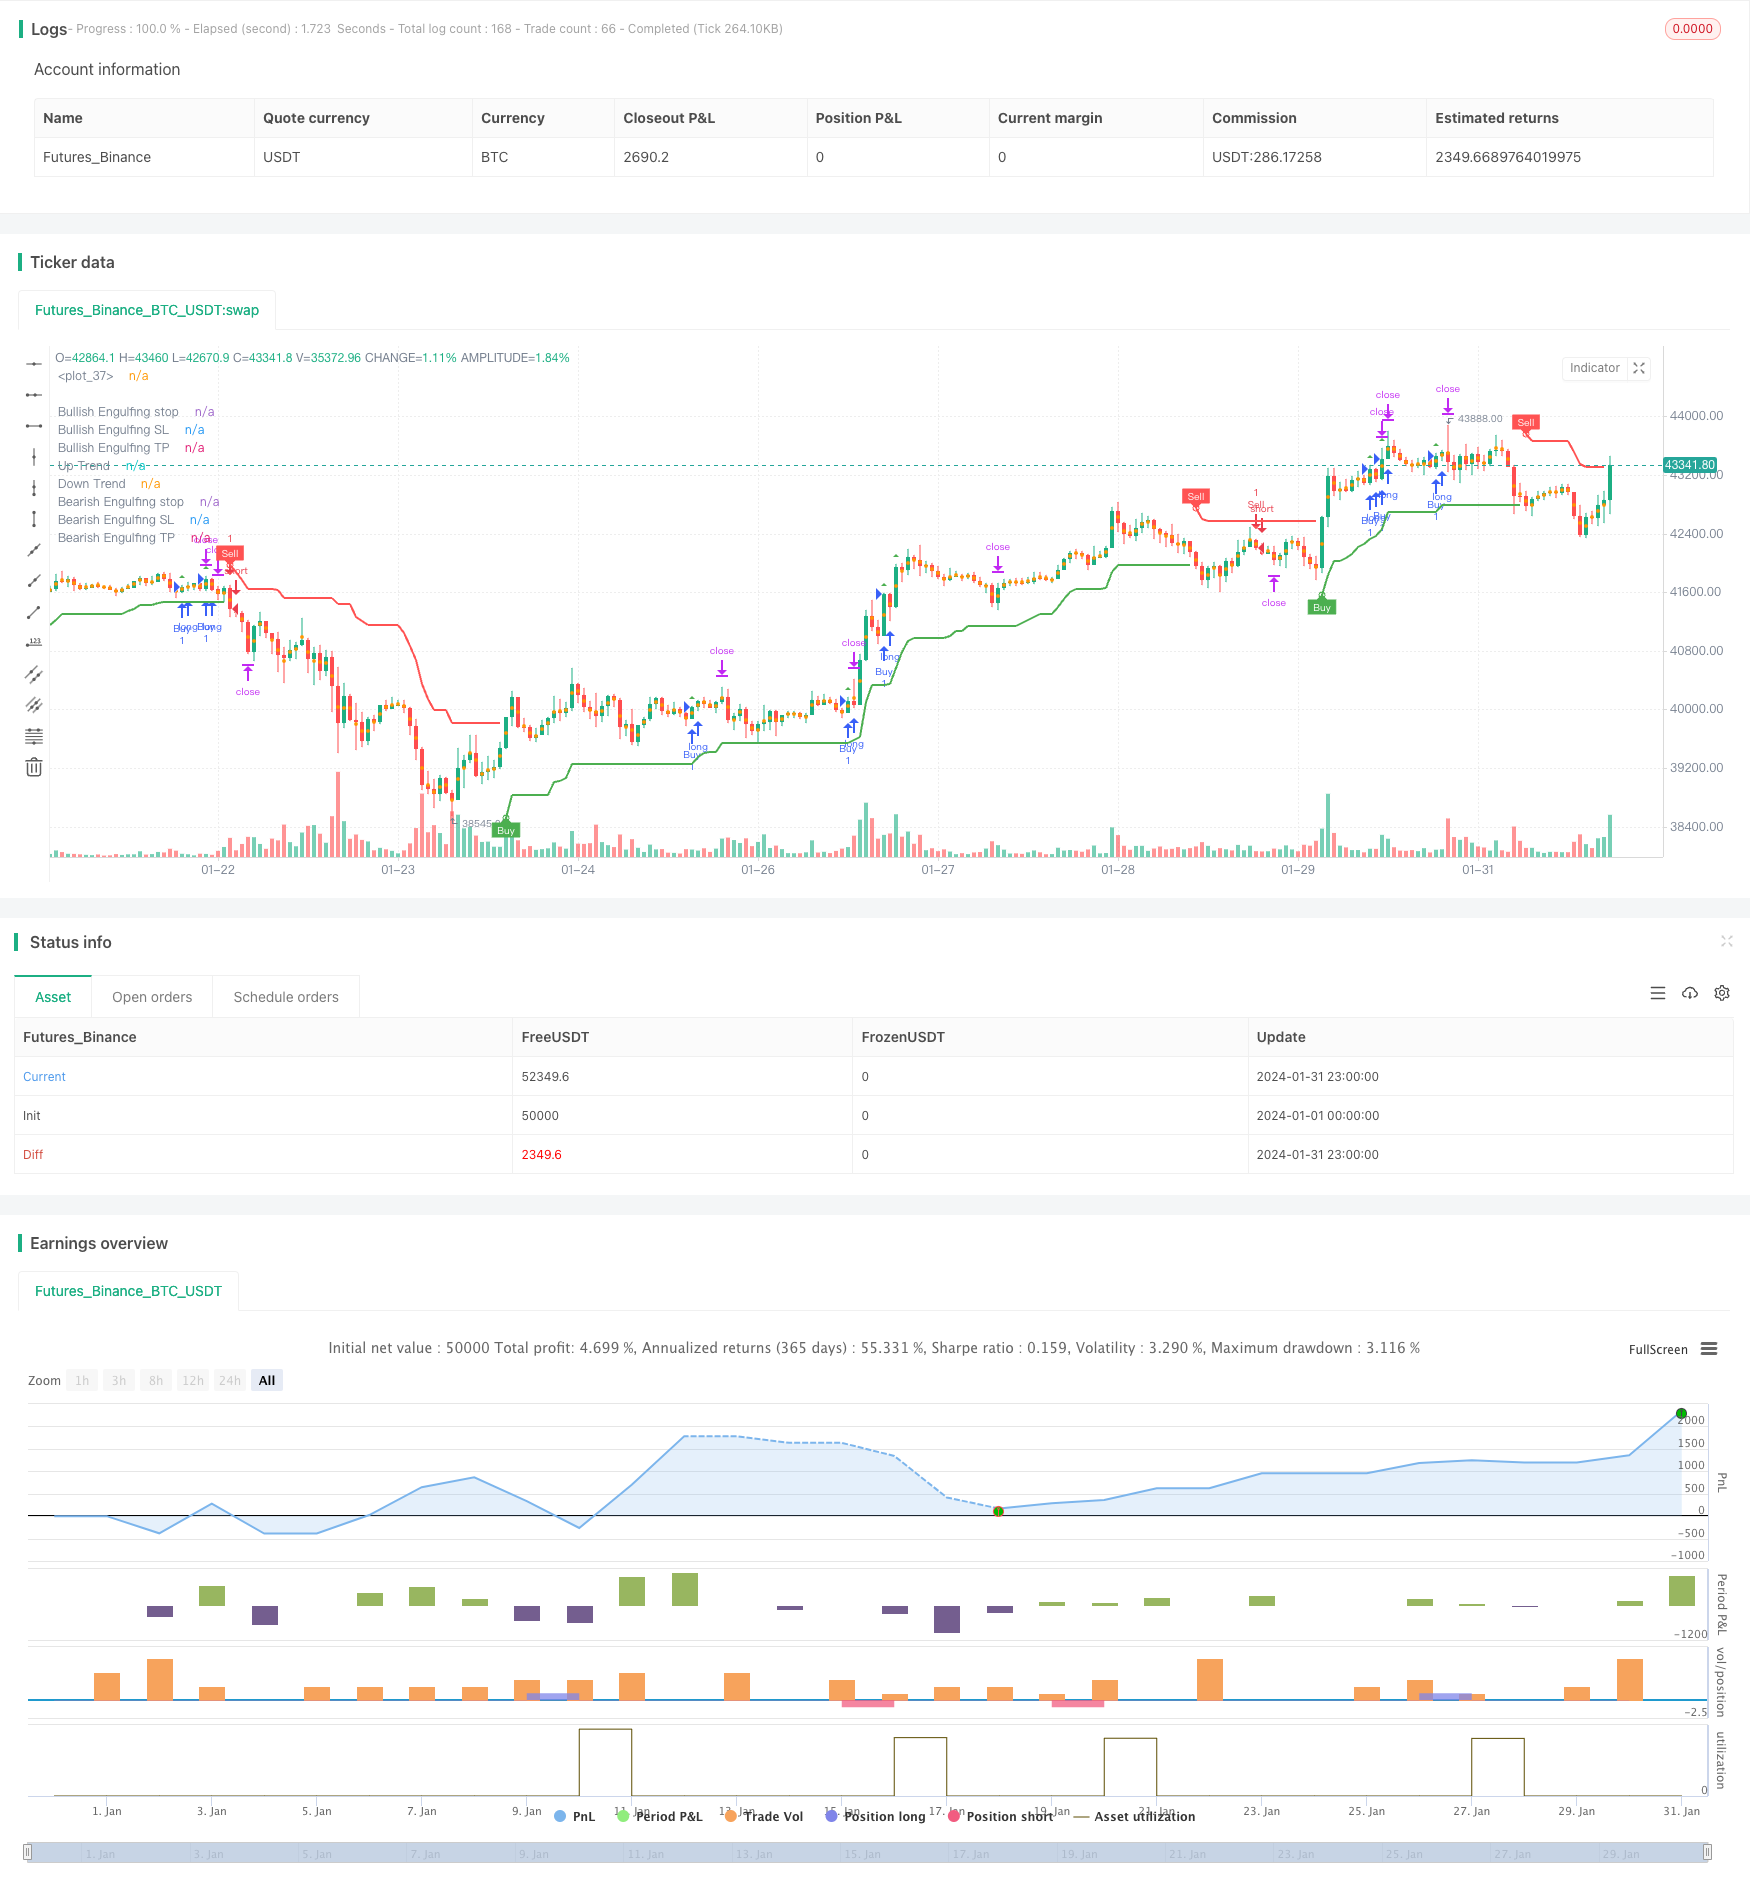
متحرک گھونٹ ٹرینڈ حکمت عملی ایک ایسی حکمت عملی ہے جس میں گھونٹ کی شکل پر مبنی رجحان کی سمت میں تجارت کی جاتی ہے۔ یہ حکمت عملی مارکیٹ میں اتار چڑھاؤ کی شناخت کے لئے اوسط حقیقی اتار چڑھاؤ کی حد ((اے ٹی آر) کا استعمال کرتی ہے ، سپر ٹرینڈ اشارے مارکیٹ کی سمت کا تعین کرتے ہیں ، جب گھونٹ کی شکل کے مطابق اور رجحان کی سمت کے مطابق ہوتا ہے تو زیادہ سے زیادہ کالعدم کارروائی کی جاتی ہے۔ اسٹاپ نقصان اور اسٹاپ پوزیشن بھی گھونٹ کی شکل کی حرکیات پر مبنی حساب کی جاتی ہیں۔
حکمت عملی کا اصول
- اے ٹی آر کا حساب لگانا ، جو مارکیٹ میں اتار چڑھاؤ کی پیمائش کرتا ہے۔
- سپر ٹرینڈ اشارے کا حساب لگانا ، مارکیٹ کے اہم رجحانات کا اندازہ لگانا۔
- کثیر سر مارکیٹ اور خالی سر مارکیٹ کی شرائط کی تعریف کریں۔
- رجحان کی سمت کے مطابق کثیر سر نگلنے ((بڑھتے ہوئے رجحان میں) اور خالی سر نگلنے ((گرائے ہوئے رجحان میں) کی شکلوں کی شناخت کریں۔
- سٹاپ نقصان اور سٹاپ پوزیشن کا حساب لگانے کے لئے استعمال کیا جاتا ہے۔
- زیادہ یا کم کرنے کے آپریشنز کو ٹرینڈ کی سمت کے مطابق انگوٹھے کی شکل کی نشاندہی کرتے وقت انجام دیا جاتا ہے۔
- جب قیمت اسٹاپ نقصان یا اسٹاپ پوزیشن کو چھوتی ہے تو ، اس کی جگہ لے لی جاتی ہے۔
- چارٹ پر نگلنے کی شکل کی نشاندہی کریں۔
حکمت عملی کا تجزیہ
یہ حکمت عملی مندرجہ ذیل فوائد رکھتی ہے:
- ٹریڈنگ سگنل کو بہتر بنانے کے لئے رجحانات اور رجحانات کو تسلیم کرنے کے ساتھ ساتھ سگنل کو بہتر بنانے کے لئے.
- ٹرینڈ ٹرانسمیشن پوائنٹس کو پہچاننے کے قابل، ہدف پر مبنی کارروائی
- زیادہ سے زیادہ خالی سگنل زیادہ واضح، آپریشن کے وقت کو کنٹرول کرنے کے لئے آسان ہے.
- نقصانات کو روکنے کی حکمت عملی کو روکنے کے لئے، رجحانات پر عمل کریں اور خطرے کو کنٹرول کریں.
- کوڈ فریم ورک صاف ہے اور بہتر بنانے اور بہتر بنانے میں آسان ہے۔
حکمت عملی کے خطرے کا تجزیہ
اس حکمت عملی کے کچھ خطرات بھی ہیں:
- نگلنے والی شکلیں جعلی توڑ ہوسکتی ہیں ، اور غلط شناخت سے نقصان ہوسکتا ہے۔
- اس کے علاوہ، یہ بھی ممکن ہے کہ آپ کو اس کے بارے میں مزید معلومات حاصل کرنے کی ضرورت ہو گی.
- رجحانات کا اندازہ لگانے کا طریقہ کار نامکمل ہے ، جس کی وجہ سے رجحانات کے مطابق کام نہیں کیا جاسکتا ہے۔
- اسٹاپ نقصان اور اسٹاپ بیس کی ترتیب تجربے پر منحصر ہے ، اور یہ بہت زیادہ موضوعی ہوسکتا ہے۔
- اثر پیرامیٹرز کی اصلاح پر منحصر ہے اور اس کی توثیق کرنے کے لئے بہت سارے تاریخی اعداد و شمار کی ضرورت ہے۔
مندرجہ بالا خطرات کو کنٹرول اور بہتر بنایا جاسکتا ہے:
- دیگر تکنیکی اشارے کے ساتھ مل کر جعلی توڑ سگنل فلٹرنگ
- زیادہ مستحکم پیرامیٹرز کا حساب لگانے کے طریقوں کا استعمال کریں ، جیسے خود سے ایڈجسٹ اے ٹی آر۔
- مشین لرننگ ماڈل متعارف کرانے جیسے رجحانات کے فیصلے کے طریقہ کار کی وشوسنییتا میں اضافہ۔
- جینیاتی الگورتھم جیسے ذرائع کا استعمال کرتے ہوئے بہترین پیرامیٹرز کا مجموعہ تلاش کریں.
- طویل وقت کے اندر اندر دوبارہ جانچ پڑتال، پیرامیٹرز کی استحکام کو یقینی بنانے کے لئے
حکمت عملی کی اصلاح کی سمت
اس حکمت عملی میں بہتری کی گنجائش ہے:
- مشین لرننگ ماڈل متعارف کرانے سے رجحانات کی درستگی میں اضافہ ہوسکتا ہے۔
- نئی شکل کی شناخت کے طریقہ کار کے ساتھ مل کر نگلنے کی شکل کی شناخت کو بہتر بنایا گیا ہے۔
- اسٹاپ اسٹاپ نقصان کی تازہ ترین حکمت عملی کا استعمال کرتے ہوئے اسٹاپ اسٹاپ نقصان کو متحرک طور پر بہتر بنائیں۔
- ہائی فریکوئینسی ڈیٹا پر مبنی گھونٹ توڑنے کی حکمت عملی تیار کی جاسکتی ہے جو شارٹ لائن آپریشن کے لئے زیادہ موزوں ہے۔
- مختلف پرجاتیوں کے لئے پیرامیٹرز ایڈجسٹمنٹ اور اصلاح کے لئے لاگو کیا جا سکتا ہے۔
خلاصہ کریں۔
مجموعی طور پر ، متحرک نگلنے والی رجحان کی حکمت عملی ، جس کے اثرات نمایاں نگلنے والی شکلوں اور درست رجحان کے فیصلے کے ساتھ مل جاتے ہیں ، ایک مناسب تجارتی حکمت عملی تشکیل دیتے ہیں۔ درخواست کے عمل میں ، اس حکمت عملی کی استحکام اور منافع کو مزید بڑھانے کے لئے پیرامیٹرز کی اصلاح ، خطرے پر قابو پانے اور نئی ٹیکنالوجیز متعارف کرانے کے ذریعے حکمت عملی کی استحکام اور منافع بخش صلاحیت کو مزید بڑھایا جاسکتا ہے۔ اس حکمت عملی کا فریم ورک واضح ہے ، اس میں بہت عمدہ عالمگیریت ہے ، جو گہری تحقیق اور اطلاق کے قابل ہے۔
/*backtest
start: 2024-01-01 00:00:00
end: 2024-01-31 23:59:59
period: 1h
basePeriod: 15m
exchanges: [{"eid":"Futures_Binance","currency":"BTC_USDT"}]
*/

// This source code is subject to the terms of the Mozilla Public License 2.0 at https://mozilla.org/MPL/2.0/
// © Malikdrajat


//@version=4
strategy("Engulfing with Trend", overlay=true)

Periods = input(title="ATR Period", type=input.integer, defval=10)
src = input(hl2, title="Source")
Multiplier = input(title="ATR Multiplier", type=input.float, step=0.1, defval=3.0)
changeATR= input(title="Change ATR Calculation Method ?", type=input.bool, defval=true)
showsignals = input(title="Show Buy/Sell Signals ?", type=input.bool, defval=true)
highlighting = input(title="Highlighter On/Off ?", type=input.bool, defval=true)

atr2 = sma(tr, Periods)
atr= changeATR ? atr(Periods) : atr2

up=src-(Multiplier*atr)
up1 = nz(up[1],up)
up := close[1] > up1 ? max(up,up1) : up
dn=src+(Multiplier*atr)
dn1 = nz(dn[1], dn)
dn := close[1] < dn1 ? min(dn, dn1) : dn

trend = 1
trend := nz(trend[1], trend)
trend := trend == -1 and close > dn1 ? 1 : trend == 1 and close < up1 ? -1 : trend

upPlot = plot(trend == 1 ? up : na, title="Up Trend", style=plot.style_linebr, linewidth=2, color=color.green)
buySignal = trend == 1 and trend[1] == -1
plotshape(buySignal ? up : na, title="UpTrend Begins", location=location.absolute, style=shape.circle, size=size.tiny, color=color.green, transp=0)
plotshape(buySignal and showsignals ? up : na, title="Buy", text="Buy", location=location.absolute, style=shape.labelup, size=size.tiny, color=color.green, textcolor=color.white, transp=0)
dnPlot = plot(trend == 1 ? na : dn, title="Down Trend", style=plot.style_linebr, linewidth=2, color=color.red)
sellSignal = trend == -1 and trend[1] == 1
plotshape(sellSignal ? dn : na, title="DownTrend Begins", location=location.absolute, style=shape.circle, size=size.tiny, color=color.red, transp=0)
plotshape(sellSignal and showsignals ? dn : na, title="Sell", text="Sell", location=location.absolute, style=shape.labeldown, size=size.tiny, color=color.red, textcolor=color.white, transp=0)
mPlot = plot(ohlc4, title="", style=plot.style_circles, linewidth=0)
longFillColor = highlighting ? (trend == 1 ? color.green : color.white) : color.white
shortFillColor = highlighting ? (trend == -1 ? color.red : color.white) : color.white
fill(mPlot, upPlot, title="UpTrend Highligter", color=longFillColor)
fill(mPlot, dnPlot, title="DownTrend Highligter", color=shortFillColor)
alertcondition(buySignal, title="SuperTrend Buy", message="SuperTrend Buy!")
alertcondition(sellSignal, title="SuperTrend Sell", message="SuperTrend Sell!")
changeCond = trend != trend[1]
alertcondition(changeCond, title="SuperTrend Direction Change", message="SuperTrend has changed direction!")

// Define Downtrend and Uptrend conditions
downtrend = trend == -1
uptrend = trend == 1


// Engulfing
boringThreshold = input(25, title="Boring Candle Threshold (%)", minval=1, maxval=100, step=1)
engulfingThreshold = input(50, title="Engulfing Candle Threshold (%)", minval=1, maxval=100, step=1)
stopLevel = input(200, title="Stop Level (Pips)", minval=1)


// Boring Candle (Inside Bar) and Engulfing Candlestick Conditions
isBoringCandle = abs(open[1] - close[1]) * 100 / abs(high[1] - low[1]) <= boringThreshold
isEngulfingCandle = abs(open - close) * 100 / abs(high - low) <= engulfingThreshold

// Bullish and Bearish Engulfing Conditions
bullEngulfing = uptrend and close[1] < open[1] and close > open[1] and not isBoringCandle and not isEngulfingCandle
bearEngulfing = downtrend and close[1] > open[1] and close < open[1] and not isBoringCandle and not isEngulfingCandle

// Stop Loss, Take Profit, and Entry Price Calculation
bullStop = close + (stopLevel * syminfo.mintick)
bearStop = close - (stopLevel * syminfo.mintick)
bullSL = low
bearSL = high
bullTP = bullStop + (bullStop - low)
bearTP = bearStop - (high - bearStop)

// Entry Conditions
enterLong = bullEngulfing and uptrend
enterShort = bearEngulfing and downtrend

// Exit Conditions
exitLong = crossover(close, bullTP) or crossover(close, bullSL)
exitShort = crossover(close, bearTP) or crossover(close, bearSL)

// Check if exit conditions are met by the next candle
exitLongNextCandle = exitLong and (crossover(close[1], bullTP[1]) or crossover(close[1], bullSL[1]))
exitShortNextCandle = exitShort and (crossover(close[1], bearTP[1]) or crossover(close[1], bearSL[1]))

// Strategy Execution
strategy.entry("Buy", strategy.long, when=enterLong )
strategy.entry("Sell", strategy.short, when=enterShort )

// Exit Conditions for Long (Buy) Positions
if (bullEngulfing and not na(bullTP) and not na(bullSL))
    strategy.exit("Exit Long", from_entry="Buy", stop=bullSL, limit=bullTP)

// Exit Conditions for Short (Sell) Positions
if (bearEngulfing and not na(bearTP) and not na(bearSL))
    strategy.exit("Exit Short", from_entry="Sell", stop=bearSL, limit=bearTP)

// Plot Shapes and Labels
plotshape(bullEngulfing, style=shape.triangleup, location=location.abovebar, color=color.green)
plotshape(bearEngulfing, style=shape.triangledown, location=location.abovebar, color=color.red)

// Determine OP, SL, and TP
plot(bullEngulfing ? bullStop : na, title="Bullish Engulfing stop", color=color.red, linewidth=3, style=plot.style_linebr)
plot(bearEngulfing ? bearStop : na, title="Bearish Engulfing stop", color=color.red, linewidth=3, style=plot.style_linebr)
plot(bullEngulfing ? bullSL : na, title="Bullish Engulfing SL", color=color.red, linewidth=3, style=plot.style_linebr)
plot(bearEngulfing ? bearSL : na, title="Bearish Engulfing SL", color=color.red, linewidth=3, style=plot.style_linebr)
plot(bullEngulfing ? bullTP : na, title="Bullish Engulfing TP", color=color.green, linewidth=3, style=plot.style_linebr)
plot(bearEngulfing ? bearTP : na, title="Bearish Engulfing TP", color=color.green, linewidth=3, style=plot.style_linebr)