ٹرپل بی بی بینڈز کی مشترکہ تجارتی حکمت عملی اختتامی پیش رفت اور RSI اشارے
جائزہ
اس حکمت عملی کے ذریعہ ٹریڈنگ سگنل تیار کیا جاتا ہے جس میں برن بینڈ اشارے اور نسبتا strong مضبوط اشاریہ آر ایس آئی اشارے کا استعمال کیا جاتا ہے۔ یہ نگرانی کرتا ہے کہ آیا تینوں K لائنوں کی بند قیمتیں بیک وقت ٹریک یا ٹریک سے ٹکرا رہی ہیں اور اس بات کی تصدیق کے لئے ٹریڈنگ سگنل کے لئے گیئر اشارے اور آر ایس آئی اشارے کے ساتھ مل کر استعمال کیا جاتا ہے۔
حکمت عملی کا اصول
یہ حکمت عملی بنیادی طور پر مندرجہ ذیل اصولوں پر مبنی ہے۔
- 20 کی لمبائی والی برن بینڈ کا استعمال کرتے ہوئے ، ٹریڈنگ سگنل بھیجنے پر غور کریں جب قیمت کا اختتام اوپر یا نیچے کی طرف جاتا ہے
- تینوں K لائنوں کے اختتامی قیمتوں کو ایک ساتھ توڑنے کی ضرورت ہے ، تاکہ جھوٹے توڑ سے بچا جاسکے
- گیئر اشارے کے ساتھ مل کر ، جب مضبوطی سے زیادہ خریدیں تو VIP> 1.25 ، جب مضبوطی سے زیادہ فروخت کریں تو VIM> 1.25 ، فلٹر سگنل
- آر ایس آئی کے ساتھ مل کر یہ معلوم کریں کہ کیا آپ اوور خرید رہے ہیں یا اوور فروخت ، آر ایس آئی کے اوپر 70 پر غور کریں ، اور آر ایس آئی کے نیچے 30 پر غور کریں
- جب مذکورہ بالا شرائط پوری ہوجائیں تو ، زیادہ یا کم کرنے کا اشارہ پیدا ہوتا ہے
طاقت کا تجزیہ
اس حکمت عملی کے اہم فوائد یہ ہیں:
- ٹرپل بی بی بینڈز جعلی توڑنے کو فلٹر کرتے ہیں ، اس بات کو یقینی بناتے ہیں کہ توڑنے کی وشوسنییتا
- مارکیٹ کی طاقت کا اندازہ لگانے کے لئے ٹرنر انڈیکس ، غیر منفعتی تجارت سے بچیں
- RSI اشارے نے اوور بیوڈ اوور سیل زون کا تعین کیا ، اور برن بینڈ اشارے کے ساتھ مل کر داخل ہوا
- متعدد اشارے کا مجموعہ ، مارکیٹ کی صورتحال کا جامع اندازہ ، سگنل کی اعلی وشوسنییتا
خطرے کا تجزیہ
اس حکمت عملی کے کچھ خطرات بھی ہیں:
- برن بینڈ اشارے پیرامیٹرز کے لئے حساس ہیں اور لمبائی اور StdDev ضرب کو بہتر بنانے کی ضرورت ہے
- گیئر اشارے بھی دورانیہ پیرامیٹرز کے لئے حساس ہیں، مختلف مارکیٹوں کو ایڈجسٹ کرنے کی ضرورت ہے
- RSI اشارے میں آسانی سے انحراف ہوسکتا ہے یا رجحان سے محروم ہوسکتا ہے
- اگر تینوں اشارے کے بارے میں اختلافات ہیں تو ، آپ کو داخلہ نہیں ملے گا اور کچھ مواقع سے محروم ہوجائیں گے۔
خطرے کو کنٹرول کرنے کے اقدامات میں شامل ہیں:
- اصلاح کے پیرامیٹرز، tested سب سے زیادہ جیتنے والے پیرامیٹرز
- دوسرے اشارے کے ساتھ مل کر ، جیسے حجم فلٹرنگ
- مناسب طریقے سے انڈیکیٹرز کے فیصلے کی منطق کو چھوڑ دیں تاکہ مواقع ضائع نہ ہوں۔
اصلاح کی سمت
اس حکمت عملی کو مندرجہ ذیل پہلوؤں سے بہتر بنایا جاسکتا ہے:
- بہترین پیرامیٹرز کو تلاش کرنے کے لئے برن بینڈ اشارے کی لمبائی اور StdDev ضرب کو بہتر بنائیں
- مختلف مارکیٹوں کے لئے موڑ کے اشارے کے دورانیے کو بہتر بنانا
- دیگر اشارے کے فیصلے میں اضافہ کریں ، جیسے تجارت کا حجم ، میک ڈی ، وغیرہ ، متنوع سگنل میں اضافہ کریں
- انڈیکیٹرز کے فیصلے کی منطق کو ایڈجسٹ کریں تاکہ انڈیکیٹرز کے اختلافات کو داخلے سے روک دیا جاسکے
- ایک ہی تجارت میں زیادہ سے زیادہ نقصانات کو کنٹرول کرنے کے لئے زیادہ سے زیادہ روکنے کی حکمت عملی
خلاصہ کریں۔
اس حکمت عملی میں متعدد اشارے استعمال کیے گئے ہیں تاکہ فیصلہ کیا جاسکے۔ سگنل کی وشوسنییتا کو یقینی بنانے کے ساتھ ، کچھ مسائل بھی موجود ہیں۔ پیرامیٹرز کی اصلاح ، سگنل کے ذرائع کو افزودہ کرنا ، فیصلے کے منطق کو ایڈجسٹ کرنا اور نقصان کو روکنا جیسے ذرائع سے حکمت عملی کی استحکام اور منافع کو مزید بڑھاوا دیا جاسکتا ہے۔ یہ ایک اچھی سوچ پیش کرتا ہے کہ تجارت کو مقدار میں بڑھایا جاسکے۔
/*backtest
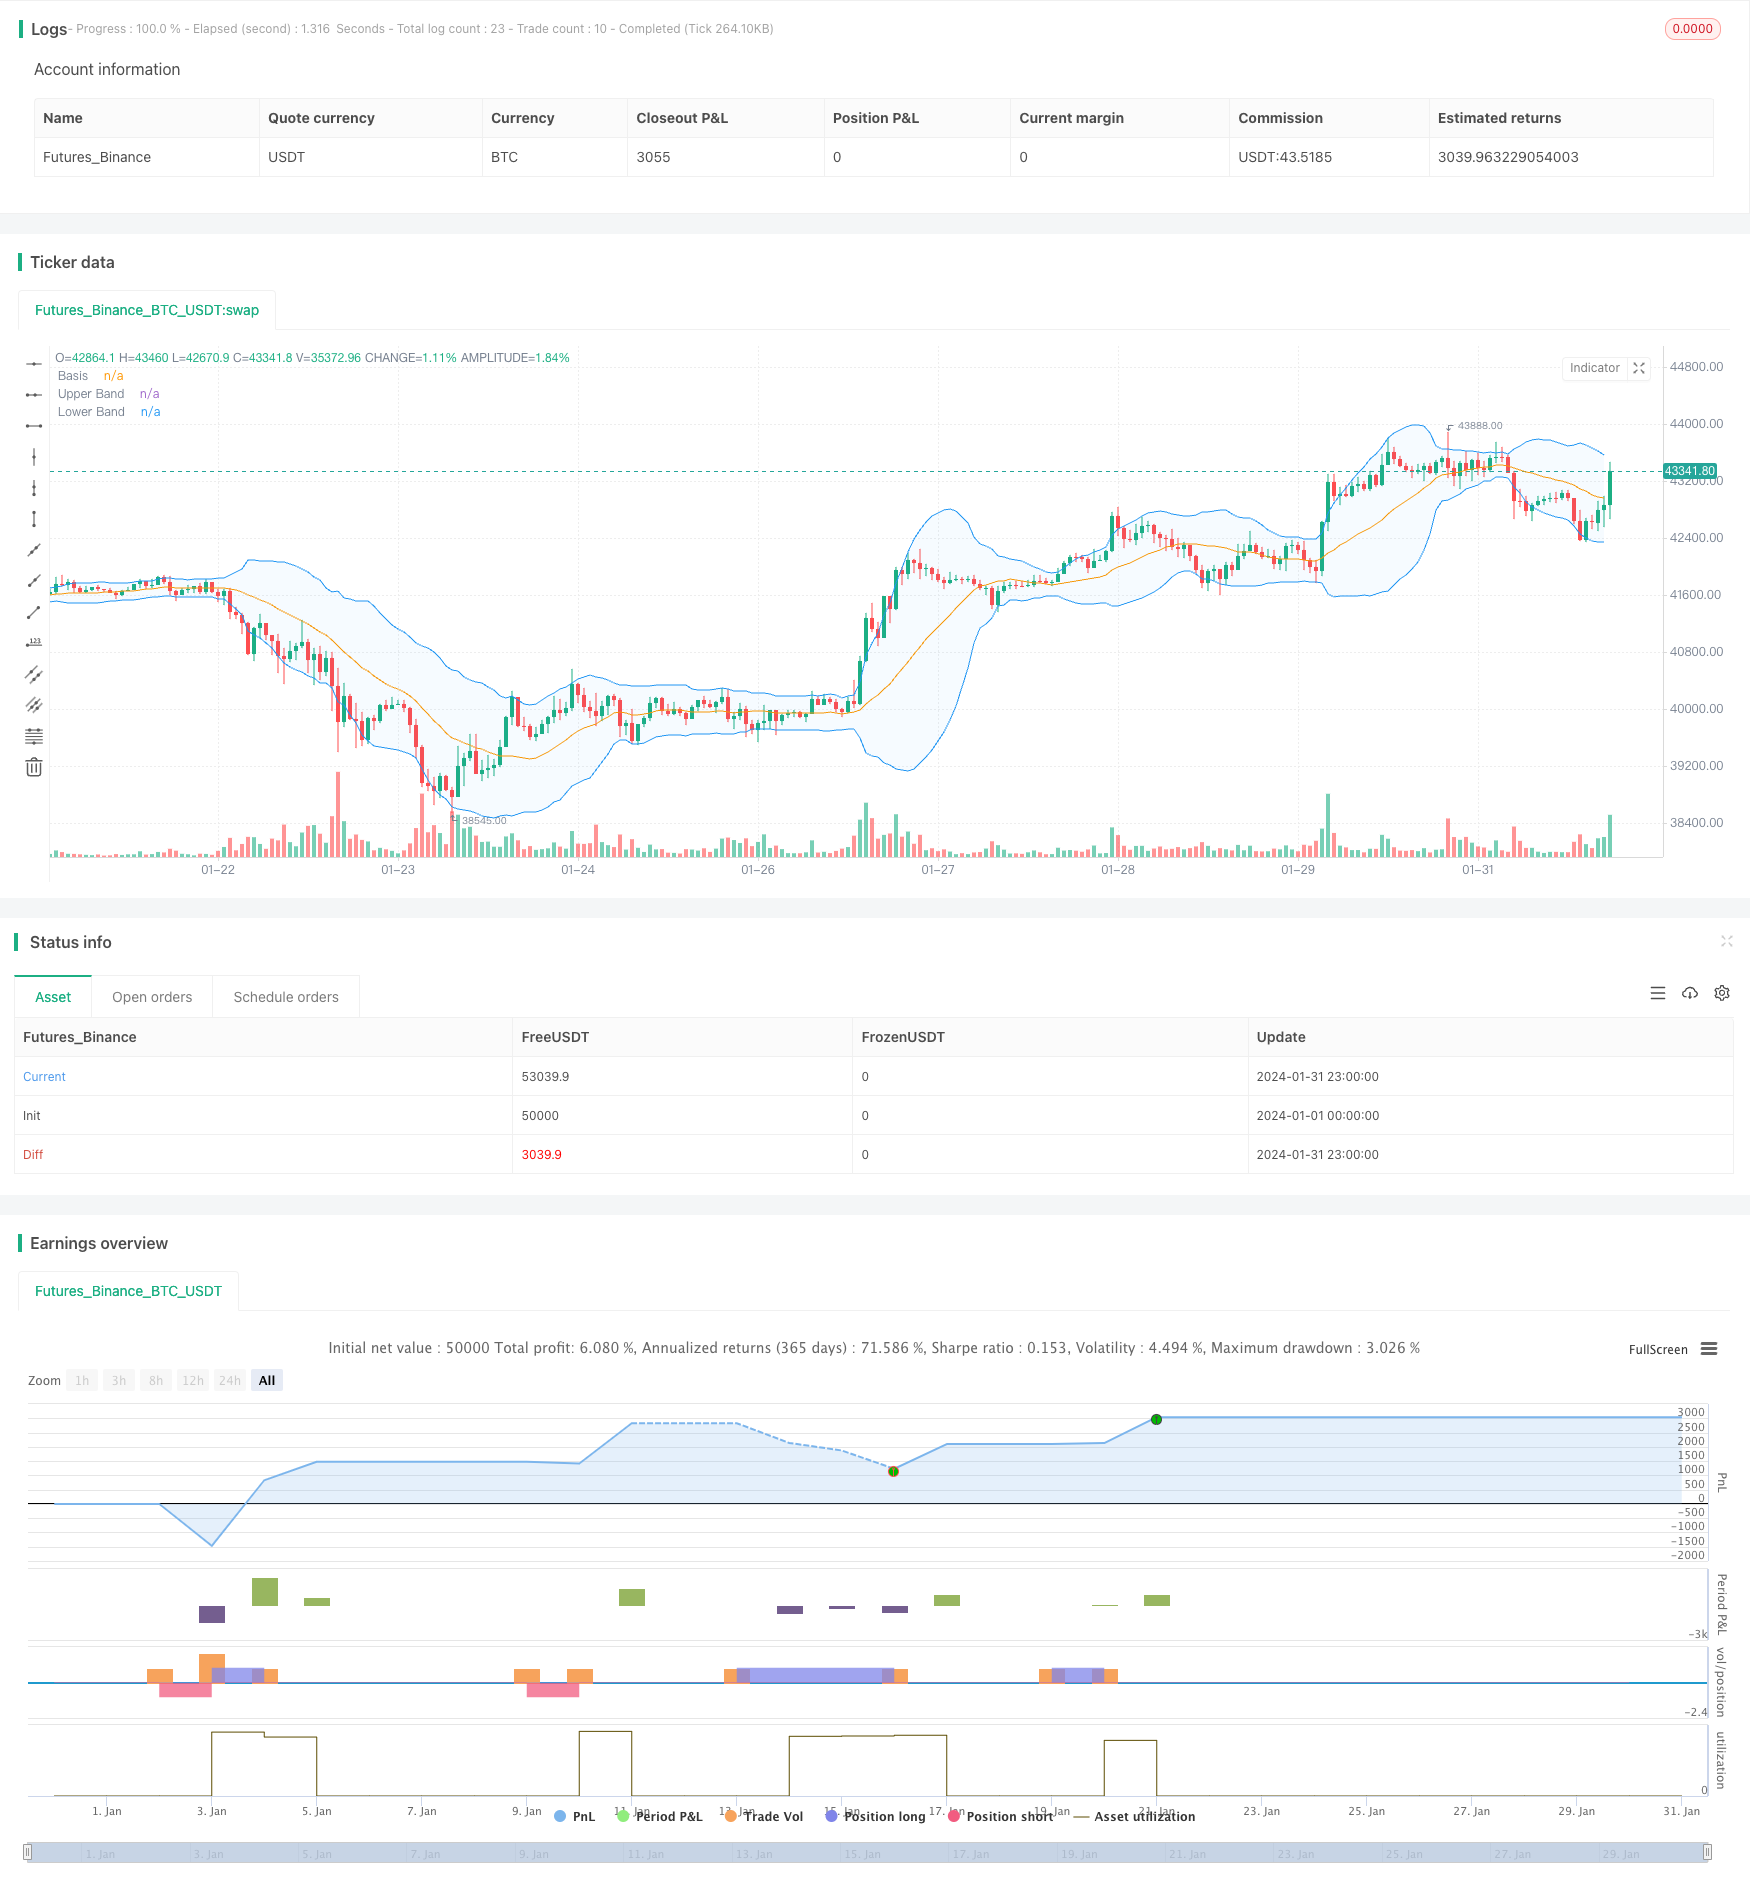
start: 2024-01-01 00:00:00
end: 2024-01-31 23:59:59
period: 1h
basePeriod: 15m
exchanges: [{"eid":"Futures_Binance","currency":"BTC_USDT"}]
*/
// This Pine Script™ code is subject to the terms of the Mozilla Public License 2.0 at https://mozilla.org/MPL/2.0/
// © Noway0utstorm
//@version=5
strategy(title='RSI + BB over 3 bar+--- vortex0.71.3 ', shorttitle='NoWaytruongphuthinh', format=format.price, precision=4,overlay = true)
length = input(20, title="Length")
mult = input(2.0, title="Multiplier")
source = close
basis = ta.sma(source, length)
dev = mult * ta.stdev(source, length)
upperBand = basis + dev
lowerBand = basis - dev
isClosedBar = ta.change(time("15"))
var bool closeAboveUpperBand = false
var bool closeBelowLowerBand = false
// Vortex Indicator Settings
period_ = input.int(14, title='Period', minval=2)
VMP = math.sum(math.abs(high - low[1]), period_)
VMM = math.sum(math.abs(low - high[1]), period_)
STR = math.sum(ta.atr(1), period_)
VIP = VMP / STR
VIM = VMM / STR
//
lengthrsi = input(14, title="RSI Length")
overboughtLevel = input(70, title="Overbought Level")
oversoldLevel = input(30, title="Oversold Level")
sourcersi = close
rsiValue = ta.rsi(sourcersi, lengthrsi)
shouldShort = rsiValue > overboughtLevel
shouldLong = rsiValue < oversoldLevel
if bool(isClosedBar[1]) and bool(isClosedBar[2]) and bool(isClosedBar[3])
if close[1] > upperBand[1] and close[2] > upperBand[2] and close[3] > upperBand[3] and VIP > 1.25 and VIM < 0.7 and rsiValue > overboughtLevel
strategy.entry("Short", strategy.short)
closeAboveUpperBand := false // Reset the condition when entering a new Short position
if close[1] < lowerBand[1] and close[2] < lowerBand[2] and close[3] < lowerBand[3] and VIP < 0.7 and VIM > 1.25 and rsiValue < oversoldLevel
strategy.entry("Long", strategy.long)
closeBelowLowerBand := false // Reset the condition when entering a new Long position
if strategy.position_size > 0 // Check if there is an open Long position
closeAboveUpperBand := close > upperBand // Update the condition based on close price
if closeAboveUpperBand
strategy.close("Long",disable_alert=true) // Close the Long position if close price is above upper band
if strategy.position_size < 0 // Check if there is an open Short position
closeBelowLowerBand := close < lowerBand // Update the condition based on close price
if closeBelowLowerBand
strategy.close("Short",disable_alert=true) // Close the Short position if close price is below lower band
// Plots
plot(basis, color=color.orange, title="Basis")
p1 = plot(upperBand, color=color.blue, title="Upper Band")
p2 = plot(lowerBand, color=color.blue, title="Lower Band")
fill(p1, p2, title = "Background", color=color.rgb(33, 150, 243, 95))