دو طرفہ ٹریلنگ اسٹاپ موونگ اوسط رجحان کی حکمت عملی
جائزہ
اس حکمت عملی میں سپر رجحانات ، ایس ایس ایل ہائبرڈ بیس لائن چینلز اور کیو کیو ای شکل کے اشارے کا استعمال کیا گیا ہے ، جس میں دو طرفہ ہولڈنگ ٹریکنگ اسٹاپ نقصانات کو درمیانی اور لمبی لکیری رجحانات کو پکڑنے کے لئے استعمال کیا گیا ہے۔
حکمت عملی کا اصول
اس حکمت عملی کی بنیاد مندرجہ ذیل نکات پر ہے:
- سپر ٹرینڈ اشارے کا استعمال کرتے ہوئے مجموعی طور پر رجحان کی سمت کا تعین کرنے کے لئے ، داخلے کے وقت کا تعین کرنے میں معاون ہے۔
- ایس ایس ایل ہائبرڈ بیس لائن چینل کی بنیاد پر مخصوص انٹری پوائنٹس کا تعین کریں۔
- QQE اشارے کے کثیر خلائی کراس کو بطور انٹری کے ضمنی تصدیق کے اشارے کے طور پر استعمال کریں۔
- اے ٹی آر اشارے معاون حساب سے اسٹاپ نقصان اور اسٹاپ بیٹس۔
- فی صد خطرے کے انتظام اور متحرک ایڈجسٹمنٹ کی روک تھام کی حکمت عملی کو اپنانے، انفرادی خطرے کو کنٹرول کریں.
انٹری منطق سپر ٹرینڈ ٹرنورٹ کے طور پر ہے اور قیمت بیس لائن چینل کو توڑ دیتی ہے ، جبکہ QQE اشارے اسی سمت میں کراس ہونے پر انٹری لیتا ہے۔
اس مجموعہ کے اشارے کے نظام کو مؤثر طریقے سے مارکیٹ میں داخل ہونے کے وقت کو کنٹرول کرنے کے لئے استعمال کیا جاتا ہے، اور اس طرح کے ہنگامہ خیز حالات میں تجارت کو روکنے کے لئے استعمال کیا جاتا ہے.
باہر نکلنے کا منطق آسان ہے ، سپر ٹرینڈ ٹرنورٹ کو قریب کی علامت کے طور پر استعمال کریں ، یا اسٹاپ نقصان ، اسٹاپ اسٹاپ سے باہر نکلیں۔
طاقت کا تجزیہ
اس حکمت عملی کا سب سے بڑا فائدہ یہ ہے کہ ملٹی میٹرکس کو ایک ساتھ استعمال کیا جاتا ہے ، جس سے جعلی توڑنے کو مؤثر طریقے سے فلٹر کیا جاسکتا ہے ، اور غیر موثر تجارت کے امکانات کو کم کیا جاسکتا ہے۔
اس حکمت عملی میں ایک اہم خصوصیت یہ بھی ہے کہ اس میں فیصد اسٹاپ نقصان کا استعمال کیا گیا ہے تاکہ ایک نقصان کا خطرہ کنٹرول کیا جاسکے۔
اے ٹی آر کے ذریعہ اسٹاپ نقصان کی سطح کا حساب لگانا ، اس کے ساتھ ساتھ اسٹاپ نقصان کے قابل ترتیب ضرب ، ہمیں ہر تجارت کے خطرے کے بارے میں واضح معلومات فراہم کرتا ہے۔ یہ خطرے کے انتظام کے لئے بہت اہم ہے۔
اس کے علاوہ، ہم اپنے نقصانات کو محدود کرنے کے لئے زیادہ سے زیادہ نقصانات کا فیصد بھی مقرر کر سکتے ہیں.
اس حکمت عملی میں منافع کو لاک کرنے کے لئے متحرک روکنے کا بھی استعمال کیا گیا ہے ، جو منافع میں اضافے کا ایک اہم ذریعہ ہے۔
خطرے کا تجزیہ
اس حکمت عملی کا سب سے بڑا خطرہ یہ ہے کہ مجموعی سگنل سے غلط سگنل نکلنے کا امکان ہے۔ اگرچہ ہم ملٹی میٹرکس مجموعی فلٹرنگ کا استعمال کرتے ہیں ، لیکن کوئی بھی میٹرکس غلطی سے مکمل طور پر بچ نہیں سکتا ہے۔
جب سپر ٹرینڈ میں جعلی بریک ہوتا ہے ، یا QQE غلط سگنل بناتا ہے ، تو یہ حکمت عملی آسانی سے پوزیشن میں داخل ہوجاتی ہے ، جس سے اسٹاپ نقصان کے متحرک ہونے کا خطرہ بڑھ جاتا ہے۔
اس کے علاوہ ، اس حکمت عملی میں زیادہ سے زیادہ اصلاح کا خطرہ بھی ہے۔ پیرامیٹرز کو احتیاط سے ترتیب دینے کی ضرورت ہے تاکہ تاریخی اعداد و شمار پر زیادہ انحصار نہ کیا جاسکے۔
ہمیں اہم پیرامیٹرز جیسے اے ٹی آر کی لمبائی ، اسٹاپ نقصان کی ضرب ، فیصد خطرہ وغیرہ کی ترتیبات پر توجہ دینے کی ضرورت ہے۔ ان پیرامیٹرز کو مختلف اقسام کے مطابق انفرادی طور پر ایڈجسٹ کرنے کی ضرورت ہے۔
اصلاح کی سمت
اس حکمت عملی کو بہتر بنانے کے لیے مزید گنجائش موجود ہے:
مزید اشارے کے مجموعے کی جانچ کی جاسکتی ہے ، مثال کے طور پر ، کے ڈی اشارے کو معاون فیصلے میں شامل کرنا۔
مختلف پیرامیٹرز کی ترتیبات کے تحت استحکام کی جانچ کی جا سکتی ہے۔
مشین سیکھنے کے طریقوں پر مبنی خود کار طریقے سے اصلاحی پیرامیٹرز کی کوشش کی جا سکتی ہے۔
مارکیٹ میں اتار چڑھاؤ کی حد کے مطابق اسٹاپ نقصان کی حد کو ایڈجسٹ کرنے کے لئے ایک موافقت پذیر اسٹاپ نقصان کا طریقہ کار متعارف کرایا جاسکتا ہے۔
دوبارہ داخلے کا منطق شامل کیا جاسکتا ہے ، یعنی نقصان کے بعد دوبارہ داخل ہونا ، تاکہ خریداری سے محروم ہونے کے امکانات کو کم کیا جاسکے۔
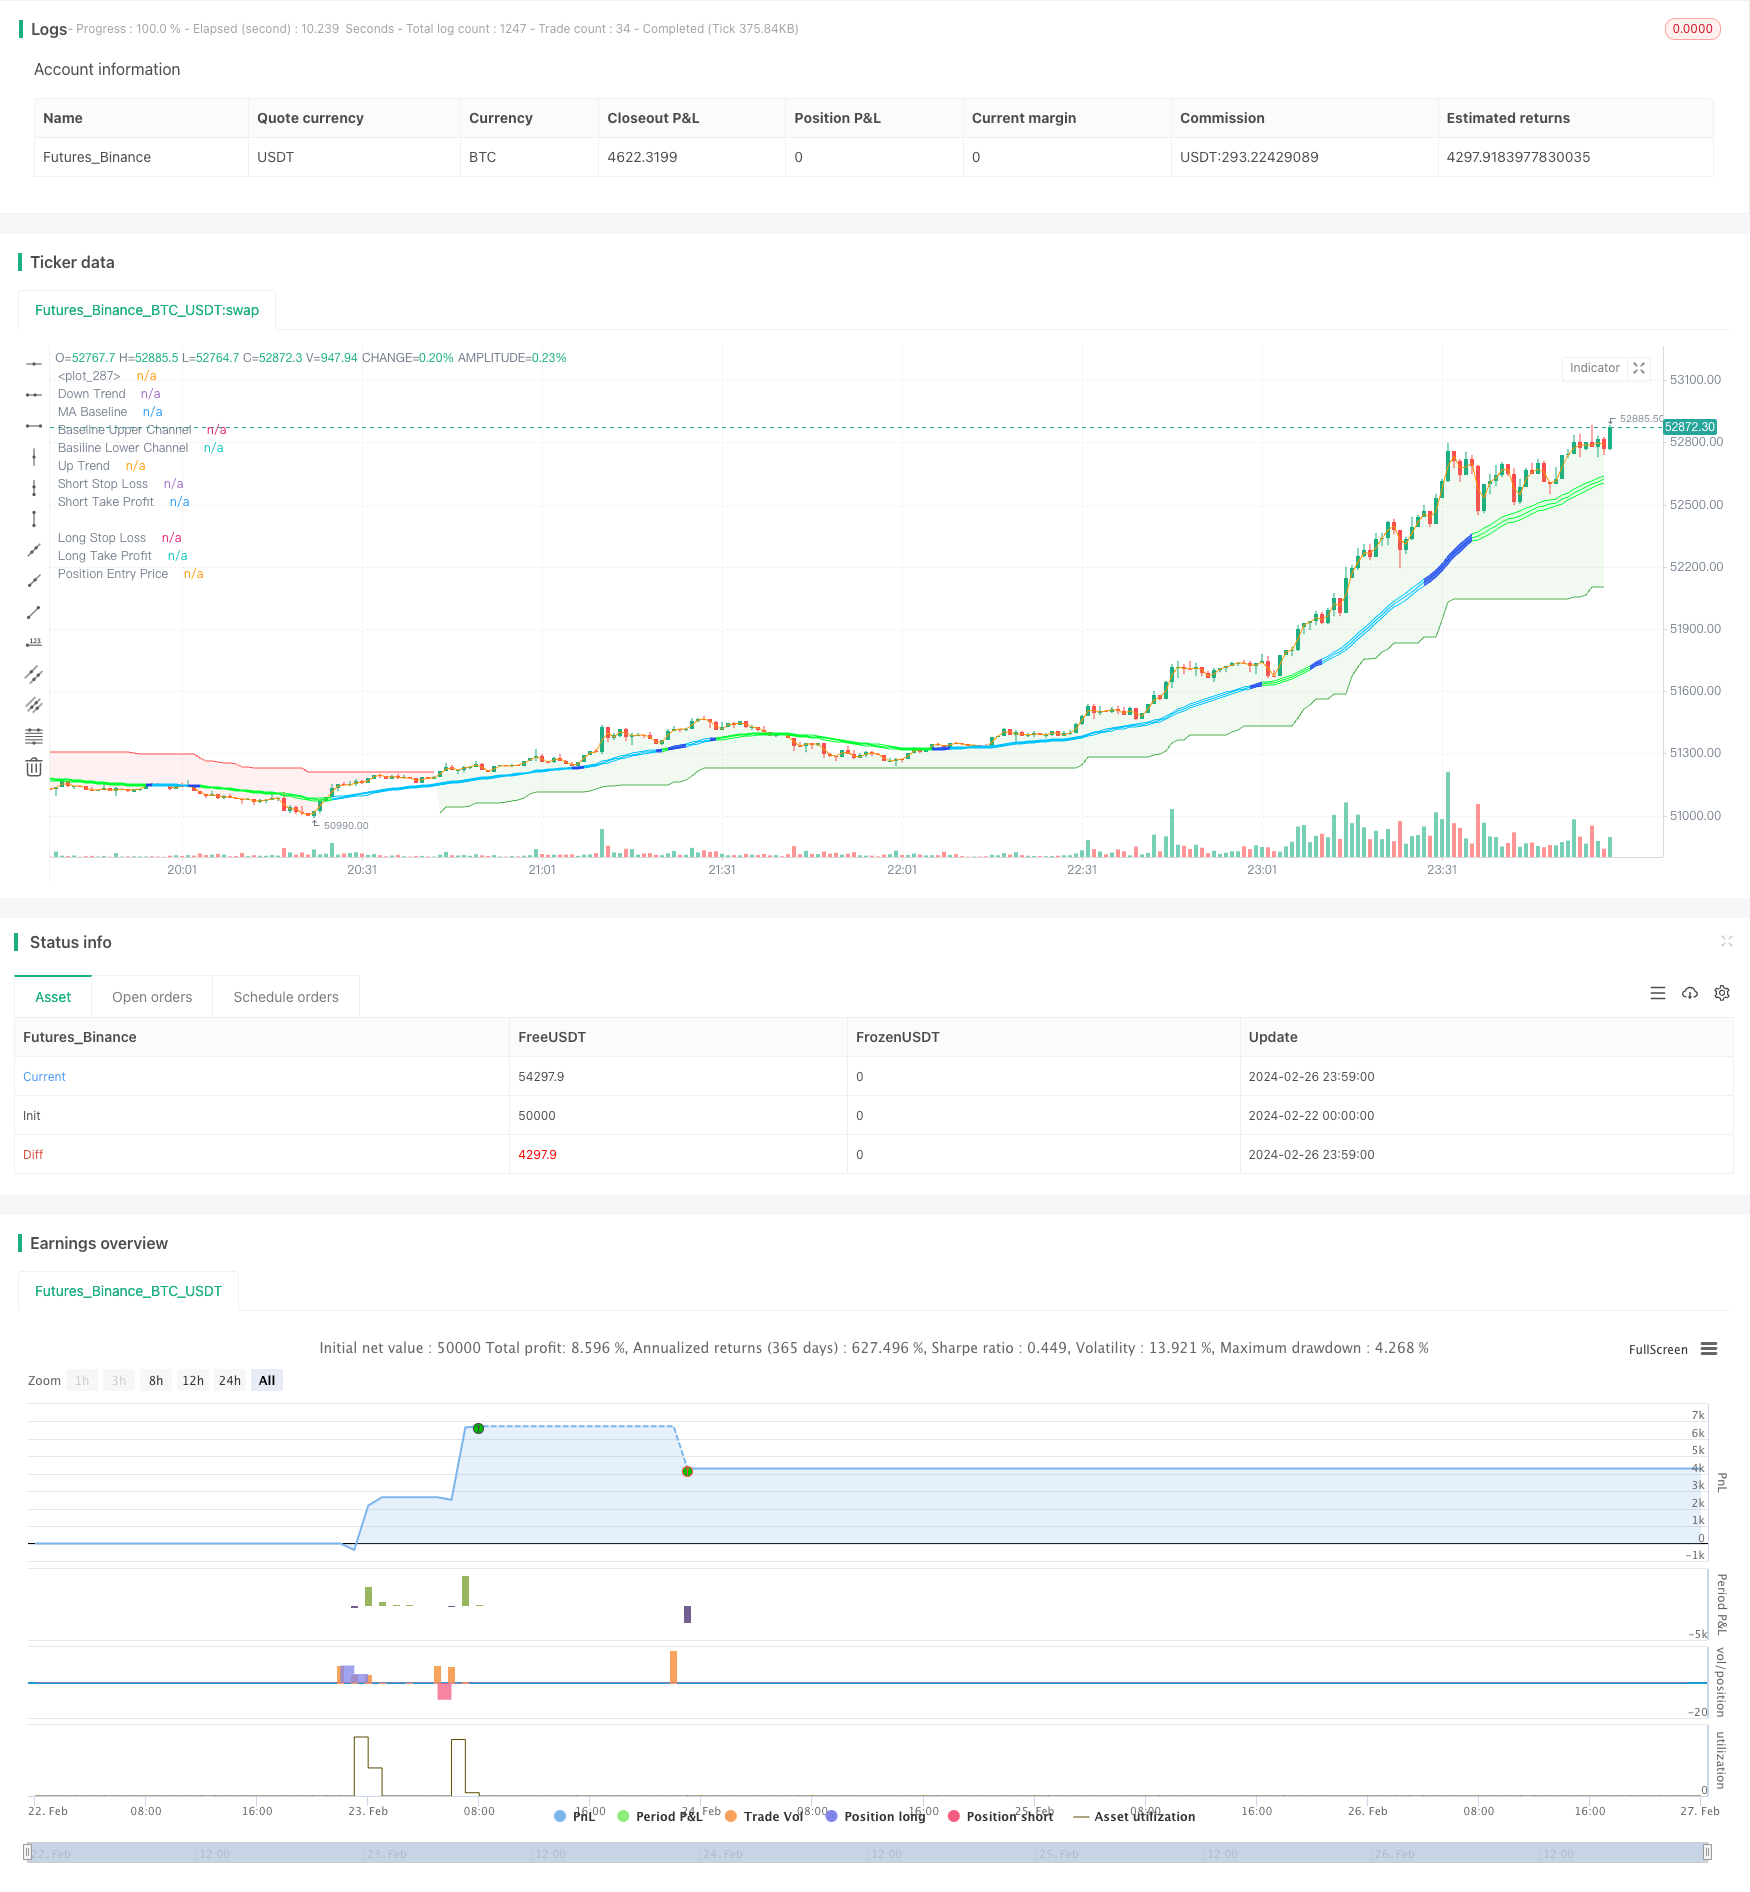
/*backtest
start: 2024-02-22 00:00:00
end: 2024-02-27 00:00:00
period: 1m
basePeriod: 1m
exchanges: [{"eid":"Futures_Binance","currency":"BTC_USDT"}]
*/

// This source code is subject to the terms of the Mozilla Public License 2.0 at https://mozilla.org/MPL/2.0/
// © fpemehd
// Thanks to W3MCT - @simonFUTURE2 w3mct.com -
// @version=5
strategy(title          = '[D] SLH W3MCT combo Indicator',
      shorttitle        = '[D] SLH[swing-low-high] W3MCT',
      overlay           = true,
      pyramiding        = 0,
      currency          = currency.USD,
      default_qty_type  = strategy.percent_of_equity,
      default_qty_value = 100,
      commission_value  = 0.1,
      initial_capital   = 10000,
      max_bars_back     = 500,
      max_lines_count   = 150,
      max_labels_count  = 300)

// ░░░░░░░░░░░░░░░░░░░░░░░░░░░░░░░░░░░░░░░░░░░░░░░░░░░░░░░░░░░░░░░░░░░░░░░░░░░░░░░░░░░░░░░░░░░░░░░░░░░░░░░░░░░░░░░░░░░░░░░░░░░░░░░░░░░░░░░░░░░░░░░░░░
//                      Time, Direction, Etc - Basic Settings Inputs
// ░░░░░░░░░░░░░░░░░░░░░░░░░░░░░░░░░░░░░░░░░░░░░░░░░░░░░░░░░░░░░░░░░░░░░░░░░░░░░░░░░░░░░░░░░░░░░░░░░░░░░░░░░░░░░░░░░░░░░░░░░░░░░░░░░░░░░░░░░░░░░░░░░░
// 1. Time: Based on UTC +09:00
i_start                 = input (defval = timestamp("20 Jan 2009 00:00 +0900"), title = "Start Date", tooltip = "Choose Backtest Start Date", inline = "Start Date", group = "Time" )
i_end                   = input (defval = timestamp("20 Dec 2030 00:00 +0900"), title = "End Date", tooltip = "Choose Backtest End Date", inline = "End Date", group = "Time" )
inTime                  = true

// 2. Inputs for direction: Long? Short? Both?
i_longEnabled           = input.bool (defval = true , title = "Long?", tooltip = "Enable Long Position Trade?", inline = "Long / Short", group = "Long / Short" )
i_shortEnabled          = input.bool (defval = true , title = "Short?", tooltip = "Enable Short Position Trade?", inline = "Long / Short", group = "Long / Short" )

// ░░░░░░░░░░░░░░░░░░░░░░░░░░░░░░░░░░░░░░░░░░░░░░░░░░░░░░░░░░░░░░░░░░░░░░░░░░░░░░░░░░░░░░░░░░░░░░░░░░░░░░░░░░░░░░░░░░░░░░░░░░░░░░░░░░░░░░░░░░░░░░░░░░
//                      Filter - Inputs, Indicaotrs
// ░░░░░░░░░░░░░░░░░░░░░░░░░░░░░░░░░░░░░░░░░░░░░░░░░░░░░░░░░░░░░░░░░░░░░░░░░░░░░░░░░░░░░░░░░░░░░░░░░░░░░░░░░░░░░░░░░░░░░░░░░░░░░░░░░░░░░░░░░░░░░░░░░░
// 3. Use Filters? What Filters?
//// 3-1. ATR Filter
i_ATRFilterOn           = input.bool (defval = false , title = "ATR Filter On?", tooltip = "ATR Filter On? Order will not be made unless filter condition is fulfilled", inline = "1", group =  "Filters")
i_ATRFilterLen          = input.int  (defval = 9,     title = "Length for ATR Filter", minval = 1 , maxval = 100 , step = 1 , tooltip = "", inline = "2", group = "Filters")
i_ATRSMALen             = input.int  (defval = 27,     title = "SMA Length for ATR SMA", minval = 1 , maxval = 100000 , step = 1 , tooltip = "ATR should be bigger than this", inline = "2", group = "Filters")
bool ATRFilter          = ta.atr(i_ATRFilterLen) >= ta.sma(ta.atr(length = i_ATRFilterLen), i_ATRSMALen) ? true : false

//// 3-2. EMA Filter
i_EMAFilterOn           = input.bool (defval = false , title = "EMA Filter On?", tooltip = "EMA Filter On? Order will not be made unless filter condition is fulfilled", inline = "3", group =  "Filters")
i_EMALen                = input.int  (defval = 122,    title = "EMA Length", minval = 1 , maxval = 100000 , step = 1 , tooltip = "EMA Length", inline = "4", group = "Filters")
bool longEMAFilter      = close >= ta.ema(source = close, length = i_EMALen) ? true : false
bool shortEMAFilter     = close <= ta.ema(source = close, length = i_EMALen) ? true : false
plot(i_EMAFilterOn ? ta.ema(source = close, length = i_EMALen) : na, title = "EMA Filter", color = color.new(color = color.orange , transp = 0), linewidth = 1)

//// 3-3. ADX Filter
////3-4. DMI Filter (Uses same ADX Length)
i_ADXFilterOn           = input.bool (defval = false , title = "ADX Filter On?", tooltip = "ADX Filter On? Order will not be made unless filter condition is fulfilled", inline = "5", group =  "Filters")
i_DMIFilterOn           = input.bool (defval = false , title = "DMI Filter On?", tooltip = "DMI (Directional Moving Index) Filter On? Order will not be made unless filter condition is fulfilled", inline = "6", group =  "Filters")
i_ADXLength             = input.int  (defval = 18,     title = "ADX Length", minval = 1 , maxval = 100000 , step = 1 , tooltip = "ADX Length", inline = "7", group = "Filters")
i_ADXThreshold          = input.int  (defval = 36,     title = "ADX Threshold", minval = 1 , maxval = 100000 , step = 1 , tooltip = "ADX should be bigger than threshold", inline = "8", group = "Filters")

//// 3-4. SuperTrend Filter
// i_superTrendFilterOn    = input.bool (defval = false , title = "Super Trend Filter On?", tooltip = "Super Trend Filter On? Order will not be made unless filter condition is fulfilled", inline = "9", group =  "Filters")
// i_superTrendATRLen      = input.int  (defval = 10,     title = "ATR Length", minval = 1 , maxval = 100000 , step = 1 , tooltip = "Super Trend ATR Length", inline = "10", group = "Filters")
// i_superTrendATRFactor   = input.float (defval = 3,     title = "Factor", minval = 1 , maxval = 100000 , step = 0.1 , tooltip = "Super Trend ATR Factor", inline = "11", group = "Filters")

// ADX and DI Thanks to @BeikabuOyaji
int len                 = i_ADXLength
float th                = i_ADXThreshold

TR                      = math.max(math.max(high - low, math.abs(high - nz(close[1]))), math.abs(low - nz(close[1])))
DMPlus                  = high - nz(high[1]) > nz(low[1]) - low ? math.max(high - nz(high[1]), 0) : 0
DMMinus                 = nz(low[1]) - low > high - nz(high[1]) ? math.max(nz(low[1]) - low, 0) : 0

SmoothedTR              = 0.0
SmoothedTR              := nz(SmoothedTR[1]) - nz(SmoothedTR[1]) / len + TR

SmoothedDMPlus          = 0.0
SmoothedDMPlus          := nz(SmoothedDMPlus[1]) - nz(SmoothedDMPlus[1]) / len + DMPlus

SmoothedDMMinus         = 0.0
SmoothedDMMinus         := nz(SmoothedDMMinus[1]) - nz(SmoothedDMMinus[1]) / len + DMMinus

DIPlus                  = SmoothedDMPlus / SmoothedTR * 100
DIMinus                 = SmoothedDMMinus / SmoothedTR * 100
DX                      = math.abs(DIPlus - DIMinus) / (DIPlus + DIMinus) * 100
ADX                     = ta.sma(source = DX, length = len)

// plot(DIPlus, color=color.new(color.green, 0), title='DI+')
// plot(DIMinus, color=color.new(color.red, 0), title='DI-')
// plot(ADX, color=color.new(color.navy, 0), title='ADX')
// hline(th, color=color.white)

bool ADXFilter          = ADX > th ? true : false
bool longDMIFilter      = DIPlus >= DIMinus ? true : false
bool shortDMIFilter     = DIPlus <= DIMinus ? true : false

// Calculate Super Trend for Filter
// i_superTrendFilterOn    = input.bool (defval = false , title = "Super Trend Filter On?", tooltip = "Super Trend Filter On? Order will not be made unless filter condition is fulfilled", inline = "9", group =  "Filters")
// i_superTrendATRLen      = input.int  (defval = 10,     title = "ATR Length", minval = 1 , maxval = 100000 , step = 1 , tooltip = "Super Trend ATR Length", inline = "10", group = "Filters")
// i_superTrendATRFactor   = input.float (defval = 3,     title = "Factor", minval = 1 , maxval = 100000 , step = 0.1 , tooltip = "Super Trend ATR Factor", inline = "11", group = "Filters")
// [supertrend, direction] = ta.supertrend(factor = i_superTrendATRFactor, atrPeriod = i_superTrendATRLen)
// bodyMiddle              = plot((open + close) / 2, display=display.none)
// upTrend                 = plot(i_superTrendFilterOn ? direction < 0 ? supertrend : na : na, "Up Trend", color = color.green, style=plot.style_linebr)
// downTrend               = plot(i_superTrendFilterOn ? direction < 0 ? na : supertrend : na, "Down Trend", color = color.red, style=plot.style_linebr)
// fill(bodyMiddle, upTrend, color.new(color.green, 90), fillgaps=false)
// fill(bodyMiddle, downTrend, color.new(color.red, 90), fillgaps=false)
// bool longSTFilter       = direction <= 0
// bool shortSTFilter      = direction >= 0

// Filter
bool longFilterFilled   = (not i_ATRFilterOn or ATRFilter) and (not i_EMAFilterOn or longEMAFilter) and (not i_ADXFilterOn or ADXFilter) and (not i_DMIFilterOn or longDMIFilter) // and (not i_superTrendFilterOn or longSTFilter)
bool shortFilterFilled  = (not i_ATRFilterOn or ATRFilter) and (not i_EMAFilterOn or shortEMAFilter) and (not i_ADXFilterOn or ADXFilter) and (not i_DMIFilterOn or shortDMIFilter) // and (not i_superTrendFilterOn or shortSTFilter)

// ░░░░░░░░░░░░░░░░░░░░░░░░░░░░░░░░░░░░░░░░░░░░░░░░░░░░░░░░░░░░░░░░░░░░░░░░░░░░░░░░░░░░░░░░░░░░░░░░░░░░░░░░░░░░░░░░░░░░░░░░░░░░░░░░░░░░░░░░░░░░░░░░░░
//                      Strategy Logic (Entry & Exit Condition) - Inputs, Indicators for Strategy
// ░░░░░░░░░░░░░░░░░░░░░░░░░░░░░░░░░░░░░░░░░░░░░░░░░░░░░░░░░░░░░░░░░░░░░░░░░░░░░░░░░░░░░░░░░░░░░░░░░░░░░░░░░░░░░░░░░░░░░░░░░░░░░░░░░░░░░░░░░░░░░░░░░░
//// Indicators
// Inputs for Strategy Indicators
//// 1. Super Trend
i_superTrendATRLen      = input.int  (defval = 21,     title = "ATR Length", minval = 1 , maxval = 100000 , step = 1 , tooltip = "Super Trend ATR Length", inline = "1", group = "1: SuperTrend")
i_superTrendATRFactor   = input.float (defval = 8,     title = "Factor", minval = 1 , maxval = 100000 , step = 0.1 , tooltip = "Super Trend ATR Factor", inline = "2", group = "1: SuperTrend")
[supertrend, direction] = ta.supertrend(factor = i_superTrendATRFactor, atrPeriod = i_superTrendATRLen)

//// 2. SSL Hybrid Baseline
i_useTrueRange          = input.bool   (defval = true, title = "use true range for Keltner Channel?", tooltip = "", inline = "1", group = "2: SSL Hybrid")
i_maType                = input.string (defval ='EMA', title='Baseline Type', options=['SMA', 'EMA', 'DEMA', 'TEMA', 'LSMA', 'WMA', 'VAMA', 'TMA', 'HMA', 'McGinley'], inline="2", group = "2: SSL Hybrid")
i_len                   = input.int    (defval =30,    title='Baseline Length', inline="2", group = "2: SSL Hybrid")
i_multy                 = input.float  (defval = 0.2,  title='Base Channel Multiplier', minval = 0, maxval = 100,  step=0.05, inline="3", group = "2: SSL Hybrid")
i_volatility_lookback   = input.int    (defval =42,    title='Volatility lookback length(for VAMA)', inline='4',group="2: SSL Hybrid")

tema(src, len) =>
    ema1 = ta.ema(src, len)
    ema2 = ta.ema(ema1, len)
    ema3 = ta.ema(ema2, len)
    3 * ema1 - 3 * ema2 + ema3

f_ma(type, src, len) =>
    float result = 0
    if type == 'TMA'
        result := ta.sma(ta.sma(src, math.ceil(len / 2)), math.floor(len / 2) + 1)
        result
    if type == 'LSMA'
        result := ta.linreg(src, len, 0)
        result
    if type == 'SMA'  // Simple
        result := ta.sma(src, len)
        result
    if type == 'EMA'  // Exponential
        result := ta.ema(src, len)
        result
    if type == 'DEMA'  // Double Exponential
        e = ta.ema(src, len)
        result := 2 * e - ta.ema(e, len)
        result
    if type == 'TEMA'  // Triple Exponential
        e = ta.ema(src, len)
        result := 3 * (e - ta.ema(e, len)) + ta.ema(ta.ema(e, len), len)
        result
    if type == 'WMA'  // Weighted
        result := ta.wma(src, len)
        result
    if type == 'VAMA'  // Volatility Adjusted
        /// Copyright © 2019 to present, Joris Duyck (JD)
        mid = ta.ema(src, len)
        dev = src - mid
        vol_up = ta.highest(dev, i_volatility_lookback)
        vol_down = ta.lowest(dev, i_volatility_lookback)
        result := mid + math.avg(vol_up, vol_down)
        result
    if type == 'HMA'  // Hull
        result := ta.wma(2 * ta.wma(src, len / 2) - ta.wma(src, len), math.round(math.sqrt(len)))
        result
    if type == 'McGinley'
        mg = 0.0
        mg := na(mg[1]) ? ta.ema(src, len) : mg[1] + (src - mg[1]) / (len * math.pow(src / mg[1], 4))
        result := mg
        result
    result

//// 2-1. SSL Hybrid Keltner Baseline Channel
BBMC                    = f_ma (i_maType, close, i_len) // BaseLone
Keltma                  = f_ma (i_maType, close, i_len)
range_1                 = i_useTrueRange ? ta.tr : high - low
rangema                 = ta.ema(range_1, i_len)
upperk                  = Keltma + rangema * i_multy
lowerk                  = Keltma - rangema * i_multy

//// 3. QQE MOD, thanks to Mihkel100
RSI_Period              = input.int   (defval = 11,     title = 'RSI Length',      inline = "1",       group = "3: QQE MOD")
SF                      = input.int   (defval = 9,     title = 'RSI Smoothing',   inline = "2",       group = "3: QQE MOD")
QQE                     = input.float (defval = 4,     title = 'Fast QQE Factor', inline = "3",       group = "3: QQE MOD")
ThreshHold              = input.int   (defval = 4,     title = 'Thresh-hold',     inline = "4",       group = "3: QQE MOD")
src                     = input       (defval = low, title='RSI Source')

Wilders_Period          = RSI_Period * 2 - 1


Rsi                     = ta.rsi(src, RSI_Period)
RsiMa                   = ta.ema(Rsi, SF)
AtrRsi                  = math.abs(RsiMa[1] - RsiMa)
MaAtrRsi                = ta.ema(AtrRsi, Wilders_Period)
dar                     = ta.ema(MaAtrRsi, Wilders_Period) * QQE

longband                = 0.0
shortband               = 0.0
trend                   = 0

DeltaFastAtrRsi         = dar
RSIndex                 = RsiMa
newshortband            = RSIndex + DeltaFastAtrRsi
newlongband             = RSIndex - DeltaFastAtrRsi
longband                := RSIndex[1] > longband[1] and RSIndex > longband[1] ? math.max(longband[1], newlongband) : newlongband
shortband               := RSIndex[1] < shortband[1] and RSIndex < shortband[1] ? math.min(shortband[1], newshortband) : newshortband
cross_1                 = ta.cross(longband[1], RSIndex)
trend                   := ta.cross(RSIndex, shortband[1]) ? 1 : cross_1 ? -1 : nz(trend[1], 1)
FastAtrRsiTL            = trend == 1 ? longband : shortband
////////////////////

length                  = input.int     (defval = 42,   minval = 1,                            title = 'Bollinger Length', group = "3: QQE MOD")
mult                    = input.float   (defval = 0.27, minval = 0.01, maxval = 5, step = 0.1, title = 'BB Multiplier', group = "3: QQE MOD")

basis                   = ta.sma(FastAtrRsiTL - 50, length)
dev                     = mult * ta.stdev(FastAtrRsiTL - 50, length)
upper                   = basis + dev
lower                   = basis - dev
color_bar               = RsiMa - 50 > upper ? #00c3ff : RsiMa - 50 < lower ? #00ff33 : color.rgb(19, 67, 239, 13)


//
// Zero cross
QQEzlong                = 0
QQEzlong                := nz(QQEzlong[1])
QQEzshort               = 0
QQEzshort               := nz(QQEzshort[1])
QQEzlong                := RSIndex >= 50 ? QQEzlong + 1 : 0
QQEzshort               := RSIndex < 50 ? QQEzshort + 1 : 0
//

// Zero                    = hline(0, color=color.white, linestyle=hline.style_dotted, linewidth=1)

////////////////////////////////////////////////////////////////
RSI_Period2             = input.int   (defval = 6,     title = 'RSI 2  Length', group = "3: QQE MOD")
SF2                     = input.int   (defval = 5,     title = 'RSI Smoothing', group = "3: QQE MOD")
QQE2                    = input.float (defval = 1.61,  title = 'Fast QQE2 Factor', group = "3: QQE MOD")
ThreshHold2             = input.int   (defval = 3,     title = 'Thresh-hold', group = "3: QQE MOD")
src2                    = input       (defval = close, title = 'RSI Source', group = "3: QQE MOD")
//

//
Wilders_Period2 = RSI_Period2 * 2 - 1


Rsi2                    = ta.rsi(src2, RSI_Period2)
RsiMa2                  = ta.ema(Rsi2, SF2)
AtrRsi2                 = math.abs(RsiMa2[1] - RsiMa2)
MaAtrRsi2               = ta.ema(AtrRsi2, Wilders_Period2)
dar2                    = ta.ema(MaAtrRsi2, Wilders_Period2) * QQE2
longband2               = 0.0
shortband2              = 0.0
trend2                  = 0

DeltaFastAtrRsi2        = dar2
RSIndex2                = RsiMa2
newshortband2           = RSIndex2 + DeltaFastAtrRsi2
newlongband2            = RSIndex2 - DeltaFastAtrRsi2
longband2               := RSIndex2[1] > longband2[1] and RSIndex2 > longband2[1] ? math.max(longband2[1], newlongband2) : newlongband2
shortband2              := RSIndex2[1] < shortband2[1] and RSIndex2 < shortband2[1] ? math.min(shortband2[1], newshortband2) : newshortband2
cross_2                 = ta.cross(longband2[1], RSIndex2)
trend2                  := ta.cross(RSIndex2, shortband2[1]) ? 1 : cross_2 ? -1 : nz(trend2[1], 1)
FastAtrRsi2TL           = trend2 == 1 ? longband2 : shortband2


//
// Zero cross
QQE2zlong               = 0
QQE2zlong               := nz(QQE2zlong[1])
QQE2zshort              = 0
QQE2zshort              := nz(QQE2zshort[1])
QQE2zlong               := RSIndex2 >= 50 ? QQE2zlong + 1 : 0
QQE2zshort              := RSIndex2 < 50 ? QQE2zshort + 1 : 0
//

hcolor2                 = RsiMa2 - 50 > ThreshHold2 ? color.silver : RsiMa2 - 50 < 0 - ThreshHold2 ? color.silver : na

Greenbar1               = RsiMa2 - 50 > ThreshHold2
Greenbar2               = RsiMa - 50 > upper

Redbar1                 = RsiMa2 - 50 < 0 - ThreshHold2
Redbar2                 = RsiMa - 50 < lower


// Plot: Indicators
//// 1. Super Trend
bodyMiddle              = plot((open + close) / 2, display=display.none)
upTrend                 = plot(direction < 0 ? supertrend : na, "Up Trend", color = color.green, style=plot.style_linebr)
downTrend               = plot(direction < 0 ? na : supertrend, "Down Trend", color = color.red, style=plot.style_linebr)
fill(bodyMiddle, upTrend, color.new(color.green, 90), fillgaps=false)
fill(bodyMiddle, downTrend, color.new(color.red, 90), fillgaps=false)

//// 2. SSL Hybrid
var bullSSLColor        = #00c3ff
var bearSSLColor        = #ff0062
// color_bar               = color.new(color = close > upperk ? bullSSLColor : close < lowerk ? bearSSLColor : color.gray, transp = 0)
// i_show_color_bar        = input.bool(defval = true , title = "Color Bars")
// barcolor(i_show_color_bar ? color_bar : na)
plot(series = BBMC, title = 'MA Baseline', color = color_bar, linewidth = 1, style = plot.style_line)
up_channel              = plot(upperk, color=color_bar, title='Baseline Upper Channel')
low_channel             = plot(lowerk, color=color_bar, title='Basiline Lower Channel')
fill(up_channel, low_channel, color.new(color=color_bar, transp=90))

//// 3. QQE MOD: No Plotting because of overlay option
// plot(FastAtrRsi2TL - 50, title='QQE Line', color=color.new(color.white, 0), linewidth=2)
// plot(RsiMa2 - 50, color=hcolor2, title='Histo2', style=plot.style_columns, transp=50)
// plot(Greenbar1 and Greenbar2 == 1 ? RsiMa2 - 50 : na, title='QQE Up', style=plot.style_columns, color=color.new(#00c3ff, 0))
// plot(Redbar1 and Redbar2 == 1 ? RsiMa2 - 50 : na, title='QQE Down', style=plot.style_columns, color=color.new(#ff0062, 0))


////// Entry, Exit
// Long, Short Logic with Indicator
bool longSTCond         = direction[1] >= 0 and direction <= 0
bool shortSTCond        = direction[1] <= 0 and direction >= 0

bool longSSLCond        = close > upperk
bool shortSSLCond       = close < lowerk

bool longQQECond        = Greenbar1 and Greenbar2 == 1
bool shortQQECond       = Redbar1 and Redbar2 == 1

// Basic Cond + Long, Short Entry Condition
bool longCond           = (i_longEnabled and inTime) and (longSTCond and longSSLCond and longQQECond)
bool shortCond          = (i_shortEnabled and inTime) and (shortSTCond and shortSSLCond and shortQQECond)

// Basic Cond + Long, Short Exit Condition
bool closeLong          = (i_longEnabled) and (shortSTCond)
bool closeShort         = (i_shortEnabled) and (longSTCond)

// ░░░░░░░░░░░░░░░░░░░░░░░░░░░░░░░░░░░░░░░░░░░░░░░░░░░░░░░░░░░░░░░░░░░░░░░░░░░░░░░░░░░░░░░░░░░░░░░░░░░░░░░░░░░░░░░░░░░░░░░░░░░░░░░░░░░░░░░░░░░░░░░░░░
//                      Position Control
// ░░░░░░░░░░░░░░░░░░░░░░░░░░░░░░░░░░░░░░░░░░░░░░░░░░░░░░░░░░░░░░░░░░░░░░░░░░░░░░░░░░░░░░░░░░░░░░░░░░░░░░░░░░░░░░░░░░░░░░░░░░░░░░░░░░░░░░░░░░░░░░░░░░
// Long, Short Entry Condition + Not entered Position Yet
bool openLong           = longCond and not (strategy.opentrades.size(strategy.opentrades - 1) > 0) and longFilterFilled
bool openShort          = shortCond and not (strategy.opentrades.size(strategy.opentrades - 1) < 0) and shortFilterFilled
bool enteringTrade      = openLong or openShort
float entryBarIndex     = bar_index

// Long, Short Entry Fulfilled or Already Entered
bool inLong             = openLong or strategy.opentrades.size(strategy.opentrades - 1) > 0 and not closeLong
bool inShort            = openShort or strategy.opentrades.size(strategy.opentrades - 1) < 0 and not closeShort

// ░░░░░░░░░░░░░░░░░░░░░░░░░░░░░░░░░░░░░░░░░░░░░░░░░░░░░░░░░░░░░░░░░░░░░░░░░░░░░░░░░░░░░░░░░░░░░░░░░░░░░░░░░░░░░░░░░░░░░░░░░░░░░░░░░░░░░░░░░░░░░░░░░░
//                      Stop Loss - Inputs, Indicaotrs
// ░░░░░░░░░░░░░░░░░░░░░░░░░░░░░░░░░░░░░░░░░░░░░░░░░░░░░░░░░░░░░░░░░░░░░░░░░░░░░░░░░░░░░░░░░░░░░░░░░░░░░░░░░░░░░░░░░░░░░░░░░░░░░░░░░░░░░░░░░░░░░░░░░░
//// Use SL? TSL?
i_useSLTP               = input.bool   (defval =  true, title = "Enable SL & TP?", tooltip = "", inline = "1", group = "Stop Loss")
i_tslEnabled            = input.bool   (defval = false , title = "Enable Trailing SL?", tooltip = "Enable Stop Loss & Take Profit? \n\Enable Trailing SL?", inline = "1", group = "Stop Loss")
// i_breakEvenAfterTP   = input.bool   (defval = false, title = 'Enable Break Even After TP?', tooltip = 'When Take Profit price target is hit, move the Stop Loss to the entry price (or to a more strict price defined by the Stop Loss %/ATR Multiplier).', inline = '2', group = 'Stop Loss / Take Profit')
//// Sl Options
i_slType                = input.string (defval = "ATR", title = "Stop Loss Type", options = ["Percent", "ATR", "Previous LL / HH"], tooltip = "Stop Loss based on %? ATR?", inline = "3", group = "Stop Loss")
i_slATRLen              = input.int    (defval = 14, title = "ATR Length", minval = 1 , maxval = 200 , step = 1, inline = "4", group = "Stop Loss")
i_slATRMult             = input.float  (defval = 3, title = "ATR Multiplier", minval = 1 , maxval = 200 , step = 0.1, tooltip = "", inline = "4", group = "Stop Loss")
i_slPercent             = input.float  (defval = 3, title = "Percent", tooltip = "", inline = "5", group = "Stop Loss")
i_slLookBack            = input.int    (defval = 30, title = "Lowest Price Before Entry", group = "Stop Loss",  inline = "6", minval = 30, step = 1, tooltip = "Lookback to find the Lowest Price. \nStopLoss is determined by the Lowest price of the look back period. Take Profit is derived from this also by multiplying the StopLoss value by the Risk:Reward multiplier.")

// Functions for Stop Loss
float openAtr           = ta.valuewhen(condition = enteringTrade, source = ta.atr(i_slATRLen), occurrence = 0)
float openLowest        = ta.valuewhen(condition = openLong, source = ta.lowest(low, i_slLookBack), occurrence = 0)
float openHighest       = ta.valuewhen(condition = openShort, source = ta.highest(high, i_slLookBack), occurrence = 0)

f_getLongSLPrice(source) =>
    switch i_slType
        "Percent"           => source * (1 - (i_slPercent/100))
        "ATR"               => source - (i_slATRMult * openAtr)
        "Previous LL / HH"  => openLowest
        => na

f_getShortSLPrice(source) =>
    switch i_slType
        "Percent"           => source * (1 + (i_slPercent/100))
        "ATR"               => source + (i_slATRMult * openAtr)
        "Previous LL / HH"  => openHighest
        => na

// Calculate Stop Loss
var float longSLPrice   = na
var float shortSLPrice  = na
bool longTPExecuted     = false
bool shortTPExecuted    = false

longSLPrice := if (inLong and i_useSLTP)
    if (openLong)
        f_getLongSLPrice (close)
    else
        // 1. Trailing Stop Loss
        if i_tslEnabled
            stopLossPrice = f_getLongSLPrice (high)
            math.max(stopLossPrice, nz(longSLPrice[1]))
        // 2. Normal StopLoss
        else
            nz(source = longSLPrice[1], replacement = 0)
else
    na

shortSLPrice := if (inShort and i_useSLTP)
    if (openShort)
        f_getShortSLPrice (close)
    else
        // 1. Trailing Stop Loss
        if i_tslEnabled
            stopLossPrice = f_getShortSLPrice (low)
            math.min(stopLossPrice, nz(shortSLPrice[1]))
        // 2. Normal StopLoss
        else
            nz(source = shortSLPrice[1], replacement = 999999.9)
else
    na

// Plot: Stop Loss of Long, Short Entry
var longSLPriceColor    = color.new(color.maroon, 0)
plot(series = longSLPrice, title = 'Long Stop Loss', color = longSLPriceColor, linewidth = 1, style = plot.style_linebr, offset = 1)
var shortSLPriceColor   = color.new(color.maroon, 0)
plot(series = shortSLPrice, title = 'Short Stop Loss', color = shortSLPriceColor, linewidth = 1, style = plot.style_linebr, offset = 1)

// ░░░░░░░░░░░░░░░░░░░░░░░░░░░░░░░░░░░░░░░░░░░░░░░░░░░░░░░░░░░░░░░░░░░░░░░░░░░░░░░░░░░░░░░░░░░░░░░░░░░░░░░░░░░░░░░░░░░░░░░░░░░░░░░░░░░░░░░░░░░░░░░░░░
//                      Take Profit - Inputs, Indicaotrs
// ░░░░░░░░░░░░░░░░░░░░░░░░░░░░░░░░░░░░░░░░░░░░░░░░░░░░░░░░░░░░░░░░░░░░░░░░░░░░░░░░░░░░░░░░░░░░░░░░░░░░░░░░░░░░░░░░░░░░░░░░░░░░░░░░░░░░░░░░░░░░░░░░░░
i_useTPExit             = input.bool   (defval = true, title = "Use Take Profit?", tooltip = "", inline = "1", group = "Take Profit")
i_RRratio               = input.float  (defval = 1.8, title = "R:R Ratio", minval = 0.1 , maxval = 200 , step = 0.1, tooltip = "R:R Ratio > Risk Reward Ratio? It will automatically set Take Profit % based on Stop Loss", inline = "2", group = "Take Profit")
i_tpQuantityPerc        = input.float  (defval = 50, title = 'Take Profit Quantity %', minval = 0.0, maxval = 100, step = 1.0, tooltip = '% of position closed when tp target is met.', inline="34", group = 'Take Profit')

var float longTPPrice   = na
var float shortTPPrice  = na

f_getLongTPPrice() =>
    close + i_RRratio * math.abs (close - f_getLongSLPrice (close))

f_getShortTPPrice() =>
    close - i_RRratio * math.abs(close - f_getShortSLPrice (close))

longTPPrice := if (inLong and i_useSLTP)
    if (openLong)
        f_getLongTPPrice ()
    else
        nz(source = longTPPrice[1], replacement = f_getLongTPPrice ())
else
    na

shortTPPrice := if (inShort and i_useSLTP)
    if (openShort)
        f_getShortTPPrice ()
    else
        nz(source = shortTPPrice[1], replacement = f_getShortTPPrice ())
else
    na

// Plot: Take Profit of Long, Short Entry
var longTPPriceColor    = color.new(color.teal, 0)
plot(series = longTPPrice, title = 'Long Take Profit', color = longTPPriceColor, linewidth = 1, style = plot.style_linebr, offset = 1)
var shortTPPriceColor   = color.new(color.teal, 0)
plot(series = shortTPPrice, title = 'Short Take Profit', color = shortTPPriceColor, linewidth = 1, style = plot.style_linebr, offset = 1)

// Plot: Entry Price
var posColor            = color.new(color.white, 0)
plot(series = strategy.opentrades.entry_price(strategy.opentrades - 1), title = 'Position Entry Price', color = posColor, linewidth = 1, style = plot.style_linebr)

// ░░░░░░░░░░░░░░░░░░░░░░░░░░░░░░░░░░░░░░░░░░░░░░░░░░░░░░░░░░░░░░░░░░░░░░░░░░░░░░░░░░░░░░░░░░░░░░░░░░░░░░░░░░░░░░░░░░░░░░░░░░░░░░░░░░░░░░░░░░░░░░░░░░
//                      Quantity - Inputs
// ░░░░░░░░░░░░░░░░░░░░░░░░░░░░░░░░░░░░░░░░░░░░░░░░░░░░░░░░░░░░░░░░░░░░░░░░░░░░░░░░░░░░░░░░░░░░░░░░░░░░░░░░░░░░░░░░░░░░░░░░░░░░░░░░░░░░░░░░░░░░░░░░░░
i_useRiskManangement    = input.bool  (defval = true, title = "Use Risk Manangement?", tooltip = "", inline = "1", group = "Quantity")
i_riskPerTrade          = input.float (defval = 3, title = "Risk Per Trade (%)", minval = 0, maxval = 100, step = 0.1, tooltip = "Use Risk Manangement by Quantity Control?", inline = "2", group = "Quantity")
// i_leverage              = input.float (defval = 2, title = "Leverage", minval = 0, maxval = 100, step = 0.1, tooltip = "Leverage", inline = "3", group = "Quantity")

float qtyPercent        = na
float entryQuantity     = na

f_calQtyPerc() =>
    if (i_useRiskManangement)
        riskPerTrade        = (i_riskPerTrade) / 100 // 1번 거래시 3% 손실
        stopLossPrice       = openLong ? f_getLongSLPrice (close) : openShort ? f_getShortSLPrice (close) : na
        riskExpected        = math.abs((close-stopLossPrice)/close) // 손절가랑 6% 차이
        riskPerTrade / riskExpected  // 0 ~ 1
    else
        1

f_calQty(qtyPerc) =>
    math.min (math.max (0.000001, strategy.equity / close * qtyPerc), 1000000000)

// TP Execution
longTPExecuted          := strategy.opentrades.size(strategy.opentrades - 1) > 0 and (longTPExecuted[1] or strategy.opentrades.size(strategy.opentrades - 1) < strategy.opentrades.size(strategy.opentrades - 1)[1] or strategy.opentrades.size(strategy.opentrades - 1)[1] == 0 and high >= longTPPrice)
shortTPExecuted         := strategy.opentrades.size(strategy.opentrades - 1) < 0 and (shortTPExecuted[1] or strategy.opentrades.size(strategy.opentrades - 1) > strategy.opentrades.size(strategy.opentrades - 1)[1] or strategy.opentrades.size(strategy.opentrades - 1)[1] == 0 and low <= shortTPPrice)

// ░░░░░░░░░░░░░░░░░░░░░░░░░░░░░░░░░░░░░░░░░░░░░░░░░░░░░░░░░░░░░░░░░░░░░░░░░░░░░░░░░░░░░░░░░░░░░░░░░░░░░░░░░░░░░░░░░░░░░░░░░░░░░░░░░░░░░░░░░░░░░░░░░░
//                      Plot Label, Boxes, Results, Etc
// ░░░░░░░░░░░░░░░░░░░░░░░░░░░░░░░░░░░░░░░░░░░░░░░░░░░░░░░░░░░░░░░░░░░░░░░░░░░░░░░░░░░░░░░░░░░░░░░░░░░░░░░░░░░░░░░░░░░░░░░░░░░░░░░░░░░░░░░░░░░░░░░░░░
i_showSimpleLabel       = input.bool(false, "Show Simple Label for Entry?",     group = "Strategy: Drawings",           inline = "1",  tooltip ="")
i_showLabels            = input.bool(false, "Show Trade Exit Labels",            group = "Strategy: Drawings",           inline = "1",  tooltip = "Useful labels to identify Profit/Loss and cumulative portfolio capital after each trade closes.\n\nAlso note that TradingView limits the max number of 'boxes' that can be displayed on a chart (max 500). This means when you lookback far enough on the chart you will not see the TP/SL boxes. However you can check this option to identify where trades exited.")
i_showDashboard         = input.bool(false, "Show Dashboard",                    group = "Strategy: Drawings",           inline = "2",  tooltip = "Show Backtest Results. Backtest Dates, Win/Lose Rates, Etc.")

// Plot: Label for Long, Short Entry
var openLongColor       = color.new(#2962FF, 0)
var openShortColor      = color.new(#FF1744, 0)
var entryTextColor      = color.new(color.white, 0)

if (openLong and i_showSimpleLabel)
    label.new (x = bar_index, y = na, text = 'Open', yloc = yloc.belowbar, color = openLongColor, style = label.style_label_up, textcolor = entryTextColor)
    entryBarIndex := bar_index
if (openShort and i_showSimpleLabel)
    label.new (x = bar_index, y = na, text = 'Close', yloc = yloc.abovebar, color = openShortColor, style = label.style_label_down, textcolor = entryTextColor)
    entryBarIndex := bar_index

float prevEntryPrice    = strategy.closedtrades.entry_price (strategy.closedtrades - 1)
float pnl               = strategy.closedtrades.profit      (strategy.closedtrades - 1)
float prevExitPrice     = strategy.closedtrades.exit_price  (strategy.closedtrades - 1)

f_enteringTradeLabel(x, y, qty, entryPrice, slPrice, tpPrice, rrRatio, direction) =>
    if i_showLabels
        labelStr = ("Trade Start"
              + "\nDirection: " + direction
              + "\nRisk Per Trade: " + str.tostring (i_useRiskManangement ? i_riskPerTrade : 100, "#.##") + "%"
              + "\nExpected Risk: " + str.tostring (math.abs((close-slPrice)/close) * 100, "#.##") + "%"
              + "\nEntry Position Qty: " + str.tostring(math.abs(qty * 100), "#.##") + "%"
              + "\nEntry Price: " + str.tostring(entryPrice, "#.##"))
              + "\nStop Loss Price: " + str.tostring(slPrice, "#.##")
              + "\nTake Profit Price: " + str.tostring(tpPrice, "#.##")
              + "\nRisk - Reward Ratio: " + str.tostring(rrRatio, "#.##")
        label.new(x = x, y = y, text = labelStr, color = color.new(color.blue, 60) , textcolor = color.white, style = label.style_label_up)


f_exitingTradeLabel(x, y, entryPrice, exitPrice, direction) =>
    if i_showLabels
        labelStr = ("Trade Result"
              + "\nDirection: " + direction
              + "\nEntry Price: " + str.tostring(entryPrice, "#.##")
              + "\nExit Price: " + str.tostring(exitPrice,"#.##")
              + "\nGain %: " + str.tostring(direction == 'Long' ? -(entryPrice-exitPrice) / entryPrice * 100 : (entryPrice-exitPrice) / entryPrice * 100 ,"#.##") + "%")
        label.new(x = x, y = y, text = labelStr, color = pnl > 0 ? color.new(color.green, 60) : color.new(color.red, 60), textcolor = color.white, style = label.style_label_down)

f_fillCell(_table, _column, _row, _title, _value, _bgcolor, _txtcolor) =>
    _cellText = _title + " " + _value
    table.cell(_table, _column, _row, _cellText, bgcolor=_bgcolor, text_color=_txtcolor, text_size=size.auto)

// ░░░░░░░░░░░░░░░░░░░░░░░░░░░░░░░░░░░░░░░░░░░░░░░░░░░░░░░░░░░░░░░░░░░░░░░░░░░░░░░░░░░░░░░░░░░░░░░░░░░░░░░░░░░░░░░░░░░░░░░░░░░░░░░░░░░░░░░░░░░░░░░░░░
//                      Orders
// ░░░░░░░░░░░░░░░░░░░░░░░░░░░░░░░░░░░░░░░░░░░░░░░░░░░░░░░░░░░░░░░░░░░░░░░░░░░░░░░░░░░░░░░░░░░░░░░░░░░░░░░░░░░░░░░░░░░░░░░░░░░░░░░░░░░░░░░░░░░░░░░░░░

if (inTime)
    if (openLong)
        qtyPercent        := f_calQtyPerc()
        entryQuantity     := f_calQty(qtyPercent)
        strategy.entry(id = "Long", direction = strategy.long, qty = entryQuantity, comment = 'Long(' + syminfo.ticker + '): Started', alert_message = 'Long(' + syminfo.ticker + '): Started')
        f_enteringTradeLabel(x = bar_index + 1, y = close-3*ta.tr, entryPrice = close, qty = qtyPercent, slPrice = longSLPrice, tpPrice = longTPPrice, rrRatio = i_RRratio, direction = "Long")

    if (openShort)
        qtyPercent        := f_calQtyPerc()
        entryQuantity     := f_calQty(qtyPercent)
        strategy.entry(id = "Short", direction = strategy.short, qty = entryQuantity, comment = 'Short(' + syminfo.ticker + '): Started', alert_message = 'Short(' + syminfo.ticker + '): Started')
        f_enteringTradeLabel(x = bar_index + 1, y = close-3*ta.tr, entryPrice = close, qty = qtyPercent, slPrice = shortSLPrice, tpPrice = shortTPPrice, rrRatio = i_RRratio, direction = "Short")

    if (closeLong)
        strategy.close(id = 'Long', comment = 'Close Long', alert_message = 'Long: Closed at market price')
        strategy.position_size > 0 ? f_exitingTradeLabel(x = bar_index, y = close+3*ta.tr, entryPrice = prevEntryPrice, exitPrice = prevExitPrice, direction = 'Long') : na

    if (closeShort)
        strategy.close(id = 'Short', comment = 'Close Short', alert_message = 'Short: Closed at market price')
        strategy.position_size < 0 ? f_exitingTradeLabel(x = bar_index, y = close+3*ta.tr, entryPrice = prevEntryPrice, exitPrice = prevExitPrice, direction = 'Short') : na

    if (inLong)
        strategy.exit(id = 'Long TP / SL', from_entry = 'Long', qty_percent = i_tpQuantityPerc, limit = longTPPrice, stop = longSLPrice, alert_message = 'Long(' + syminfo.ticker + '): Take Profit or Stop Loss executed')
        strategy.exit(id = 'Long SL', from_entry = 'Long', stop = longSLPrice, alert_message = 'Long(' + syminfo.ticker + '): Stop Loss executed')

    if (inShort)
        strategy.exit(id = 'Short TP / SL', from_entry = 'Short', qty_percent = i_tpQuantityPerc, limit = shortTPPrice, stop = shortSLPrice, alert_message = 'Short(' + syminfo.ticker + '): Take Profit or Stop Loss executed')
        strategy.exit(id = 'Short SL', from_entry = 'Short', stop = shortSLPrice, alert_message = 'Short(' + syminfo.ticker + '): Stop Loss executed')

    if strategy.position_size[1] > 0 and strategy.position_size == 0
        f_exitingTradeLabel(x = bar_index, y = close+3*ta.tr, entryPrice = prevEntryPrice, exitPrice = prevExitPrice, direction = 'Long')

    if strategy.position_size[1] < 0 and strategy.position_size == 0
        f_exitingTradeLabel(x = bar_index, y = close+3*ta.tr, entryPrice = prevEntryPrice, exitPrice = prevExitPrice, direction = 'Short')

// ░░░░░░░░░░░░░░░░░░░░░░░░░░░░░░░░░░░░░░░░░░░░░░░░░░░░░░░░░░░░░░░░░░░░░░░░░░░░░░░░░░░░░░░░░░░░░░░░░░░░░░░░░░░░░░░░░░░░░░░░░░░░░░░░░░░░░░░░░░░░░░░░░░
//                      Backtest Result Dashboard
// ░░░░░░░░░░░░░░░░░░░░░░░░░░░░░░░░░░░░░░░░░░░░░░░░░░░░░░░░░░░░░░░░░░░░░░░░░░░░░░░░░░░░░░░░░░░░░░░░░░░░░░░░░░░░░░░░░░░░░░░░░░░░░░░░░░░░░░░░░░░░░░░░░░

if i_showDashboard
    var bgcolor = color.new(color = color.black, transp = 100)
    var greenColor = color.new(color = #02732A, transp = 0)
    var redColor = color.new(color = #D92332, transp = 0)
    var yellowColor = color.new(color = #F2E313, transp = 0)
    // Keep track of Wins/Losses streaks
    newWin  = (strategy.wintrades  > strategy.wintrades[1]) and (strategy.losstrades == strategy.losstrades[1]) and (strategy.eventrades == strategy.eventrades[1])
    newLoss = (strategy.wintrades == strategy.wintrades[1]) and (strategy.losstrades  > strategy.losstrades[1]) and (strategy.eventrades == strategy.eventrades[1])

    varip int winRow     = 0
    varip int lossRow    = 0
    varip int maxWinRow  = 0
    varip int maxLossRow = 0

    if newWin
        lossRow := 0
        winRow := winRow + 1
    if winRow > maxWinRow
        maxWinRow := winRow

    if newLoss
        winRow := 0
        lossRow := lossRow + 1
    if lossRow > maxLossRow
        maxLossRow := lossRow


    // Prepare stats table
    var table dashTable = table.new(position.top_right, 1, 15, border_width=1)


    if barstate.islastconfirmedhistory
        dollarReturn = strategy.netprofit
        f_fillCell(dashTable, 0, 0, "Start:", str.format("{0,date,long}", strategy.closedtrades.entry_time(0)) , bgcolor, color.white) // + str.format(" {0,time,HH:mm}", strategy.closedtrades.entry_time(0))
        f_fillCell(dashTable, 0, 1, "End:", str.format("{0,date,long}", strategy.opentrades.entry_time(0)) , bgcolor, color.white) // + str.format(" {0,time,HH:mm}", strategy.opentrades.entry_time(0))
        _profit = (strategy.netprofit / strategy.initial_capital) * 100
        f_fillCell(dashTable, 0, 2, "Net Profit:", str.tostring(_profit, '##.##') + "%", _profit > 0 ? greenColor : redColor, color.white)
        _numOfDaysInStrategy = (strategy.opentrades.entry_time(0) - strategy.closedtrades.entry_time(0)) / (1000 * 3600 * 24)
        f_fillCell(dashTable, 0, 3, "Percent Per Day", str.tostring(_profit / _numOfDaysInStrategy, '#########################.#####')+"%", _profit > 0 ? greenColor : redColor, color.white)
        _winRate = ( strategy.wintrades / strategy.closedtrades ) * 100
        f_fillCell(dashTable, 0, 4, "Percent Profitable:", str.tostring(_winRate, '##.##') + "%", _winRate < 50 ? redColor : _winRate < 75 ? greenColor : yellowColor, color.white)
        f_fillCell(dashTable, 0, 5, "Profit Factor:", str.tostring(strategy.grossprofit / strategy.grossloss,  '##.###'), strategy.grossprofit > strategy.grossloss ? greenColor : redColor, color.white)
        f_fillCell(dashTable, 0, 6, "Total Trades:", str.tostring(strategy.closedtrades), bgcolor, color.white)
        f_fillCell(dashTable, 0, 8, "Max Wins In A Row:", str.tostring(maxWinRow, '######') , bgcolor, color.white)
        f_fillCell(dashTable, 0, 9, "Max Losses In A Row:", str.tostring(maxLossRow, '######') , bgcolor, color.white)

    // You made it to the end of my script. At W3MCT, we take our expertise and combine it with the TradingView community. We must give acknowledgement to the TradingView community for helping me get version 1.0 completed. Enjoy!!!