BabyShark تجارتی حکمت عملی VWAP اور OBV RSI اشارے پر مبنی ہے۔
حکمت عملی کا جائزہ
بیبی شارک وی ڈبلیو اے پی ٹریڈنگ حکمت عملی ایک مقداری ٹریڈنگ حکمت عملی ہے جو حجم کے وزن میں اوسط قیمت ((وی ڈبلیو اے پی) اور توانائی کے بہاؤ کے اشارے کے نسبتا weak کمزور انڈیکس ((او بی وی آر ایس آئی)) پر مبنی ہے۔ اس حکمت عملی کا مقصد ممکنہ خرید و فروخت کے اشارے کی نشاندہی کرنا ہے جس کی بنیاد پر قیمتوں میں وی ڈبلیو اے پی کی انحراف کی حد اور او بی وی آر ایس آئی نے مخصوص حد کو توڑ دیا۔
حکمت عملی کا اصول
اس حکمت عملی کا بنیادی اصول یہ ہے کہ مارکیٹ میں رجحانات اور متحرک تبدیلیوں کو پکڑنے کے لئے دو اشارے VWAP اور OBV RSI کا استعمال کریں۔ VWAP ایک متحرک اوسط ہے جو قیمت اور حجم پر مبنی ہے ، جو مارکیٹ کے اہم تجارتی علاقوں کی عکاسی کرسکتا ہے۔ جب قیمت VWAP سے نمایاں طور پر انحراف کرتی ہے تو ، اس کا مطلب یہ ہوتا ہے کہ مارکیٹ میں زیادہ خرید یا زیادہ فروخت ہوتی ہے۔ OBV RSI نے روایتی RSI اشارے کی بنیاد پر حجم کا عنصر متعارف کرایا ہے ، جو حجم میں تبدیلی کی شدت کی پیمائش کرکے مارکیٹ کے رجحانات کی صحت کو طے کرتا ہے۔
خاص طور پر ، اس حکمت عملی میں 60 K لائنوں کو VWAP کے حساب کتاب کے طور پر استعمال کیا جاتا ہے ، اور اختتامی قیمتوں کو ان پٹ کے اعداد و شمار کے طور پر استعمال کیا جاتا ہے۔ اس کے بعد قیمتوں میں VWAP سے منفی منفی 3 معیاری فرق کے فاصلے پر مبنی اوورلوڈ اور اوورلوڈ زون کی تعمیر کی جاتی ہے۔ OBV RSI کے لئے ، 5 K لائنوں کو حساب کتاب کے طور پر استعمال کیا جاتا ہے ، اور 70 اور 30 کی دو چوٹیوں کو اوورلوڈ اور اوورلوڈ کے فیصلے کے معیار کے طور پر مقرر کیا جاتا ہے۔
ٹریڈنگ کی منطق کے لحاظ سے ، حکمت عملی ایک پلس سگنل جاری کرتی ہے جب قیمت VWAP کے نچلے حصے میں اوور سیل زون میں ہوتی ہے اور OBV RSI 30 سے کم ہوتی ہے۔ اور جب قیمت VWAP کے اوپری حصے میں اوور خرید زون میں ہوتی ہے اور OBV RSI 70 سے زیادہ ہوتی ہے تو ، اس کا ایک ڈراپ سگنل ہوتا ہے۔ اس کے علاوہ ، حکمت عملی میں 0.6 فیصد اسٹاپ اسٹاپ نقصان کا تناسب بھی رکھا گیا ہے اور اس میں 10 روٹ لائنوں کا ایک ٹھنڈا دور متعارف کرایا گیا ہے تاکہ اس خطرے کو کنٹرول کیا جاسکے۔
اسٹریٹجک فوائد
- مارکیٹ کے رجحانات اور حرکیات کو مکمل طور پر پکڑنے کے لئے قیمت اور حجم جیسے متعدد مارکیٹ کے عوامل کو یکجا کریں۔
- متحرک وی ڈبلیو اے پی اور او بی وی آر ایس آئی اشارے کا استعمال کرتے ہوئے ، مختلف مارکیٹ کے دورانیوں میں تبدیلیوں کو اپنانے کے قابل۔
- معقول اسٹاپ نقصان کا تناسب اور ٹھنڈا وقت طے کریں ، اور مواقع سے فائدہ اٹھاتے ہوئے خطرے کو مؤثر طریقے سے کنٹرول کریں۔
- منطق واضح ہے ، سمجھنے اور عمل میں لانے میں آسان ہے ، اور اس کی وضاحت کی جاسکتی ہے۔
- پیرامیٹرز کو ایڈجسٹ کیا جاسکتا ہے تاکہ مختلف طرز کے تاجروں کو بہتر بنایا جاسکے۔
اسٹریٹجک رسک
- مارکیٹ میں ہلچل یا بار بار چلنے والی مارکیٹ کے لئے ، بار بار ٹریڈنگ سگنل سے زیادہ تجارت اور پوائنٹس کی قیمتوں میں اضافے کا سبب بن سکتا ہے۔
- رجحان سازی کے حالات میں ، صرف VWAP پر انحصار کرنے سے روکنے سے حکمت عملی کو جلد ہی باہر نکلنے کا سبب بن سکتا ہے ، اور اس کے نتیجے میں رجحان سازی کے منافع سے محروم ہوجاتا ہے۔
- مقررہ پیرامیٹرز کی ترتیبات مارکیٹ کے ماحول میں تبدیلیوں کے مطابق نہیں ہوسکتی ہیں اور مختلف اقسام اور ادوار کے لئے بہتر بنانے کی ضرورت ہے۔
- او بی وی اشارے ٹرانزیکشن حجم پر بہت زیادہ انحصار کرتے ہیں ، اور ٹرانزیکشن حجم کے اعداد و شمار غیر حقیقی یا جوڑ توڑ ہونے پر ، اشارے کی غلط فہمی فیصلے کو گمراہ کرسکتی ہے۔
- اس حکمت عملی میں میکرو اکنامکس، خبروں اور دیگر بیرونی عوامل کو مدنظر نہیں رکھا گیا ہے اور یہ انتہائی حالات میں ناکارہ ثابت ہوسکتی ہے۔
اصلاح کی سمت
- رجحانات کی تصدیق کے اشارے ، اتار چڑھاؤ کے اشارے ، وغیرہ جیسے فلٹرنگ شرائط کو لاگو کرنے کے لئے ، بار بار تجارت کو کم کریں۔
- آؤٹ پٹ کے حالات کو بہتر بنانا ، جیسے کہ موبائل اسٹاپ یا دوسرے رجحان سے باخبر رہنے والے اشارے کے ساتھ مل کر ، رجحانات کی صورتحال کو بہتر طور پر سمجھنا۔
- VWAP اور OBV RSI کے پیرامیٹرز کے لئے انکولی اصلاحات ، حساب کتاب کے دورانیے کو متحرک طور پر ایڈجسٹ کریں اور کم سے کم قیمت کی ترتیب۔
- او بی وی آر ایس آئی اشارے کی وشوسنییتا کو بڑھانے کے لئے ٹرانسمیشن کی صداقت کی جانچ پڑتال کا طریقہ کار متعارف کرایا گیا۔
- میکرو اقتصادی اعداد و شمار کے تجزیہ ، جذبات کے اشارے وغیرہ کو شامل کرنے پر غور کریں ، تاکہ حکمت عملی کی لچک اور استحکام کو بہتر بنایا جاسکے۔
خلاصہ کریں۔
بیبی شارک وی ڈبلیو اے پی ٹریڈنگ حکمت عملی ایک مقداری تجارتی حکمت عملی ہے جس میں ٹرانزیکشن ویٹڈ اوسط قیمت اور توانائی کے بہاؤ کے اشارے کے نسبتا weak کمزور اشارے کو ملا دیا گیا ہے۔ اس حکمت عملی کی منطق واضح ہے ، جس میں قیمت اور ٹرانزیکشن جیسے متعدد مارکیٹ عناصر شامل ہیں ، تاکہ مارکیٹ کی نبض کو مکمل طور پر سمجھا جاسکے۔ اس کے ساتھ ہی ، معقول اسٹاپ نقصان کی ترتیب اور خطرے کے کنٹرول کا میکانزم ، حکمت عملی کو منافع کے حصول کے ساتھ ساتھ خطرے کے انتظام کو بھی مدنظر رکھتا ہے۔ یقینا ، حکمت عملی میں اتار چڑھاؤ کی مارکیٹ اور رجحانات کے حالات کے لئے عدم موافقت ، اور پیرامیٹرز کی فکسنگ جیسے ممکنہ مسائل ہیں۔ مستقبل میں ، اسٹریٹجک استحکام اور منافع کو بہتر بنانے کے لئے ، اسٹریٹجک استحکام اور استحکام کو بہتر بنانے کے لئے ، اسٹریٹجک ٹرانزیکشن کے لئے بیبی شارک وی ڈبلیو اے پی حکمت عملی کا مجموعی طور پر استعمال کیا جاسکتا ہے۔
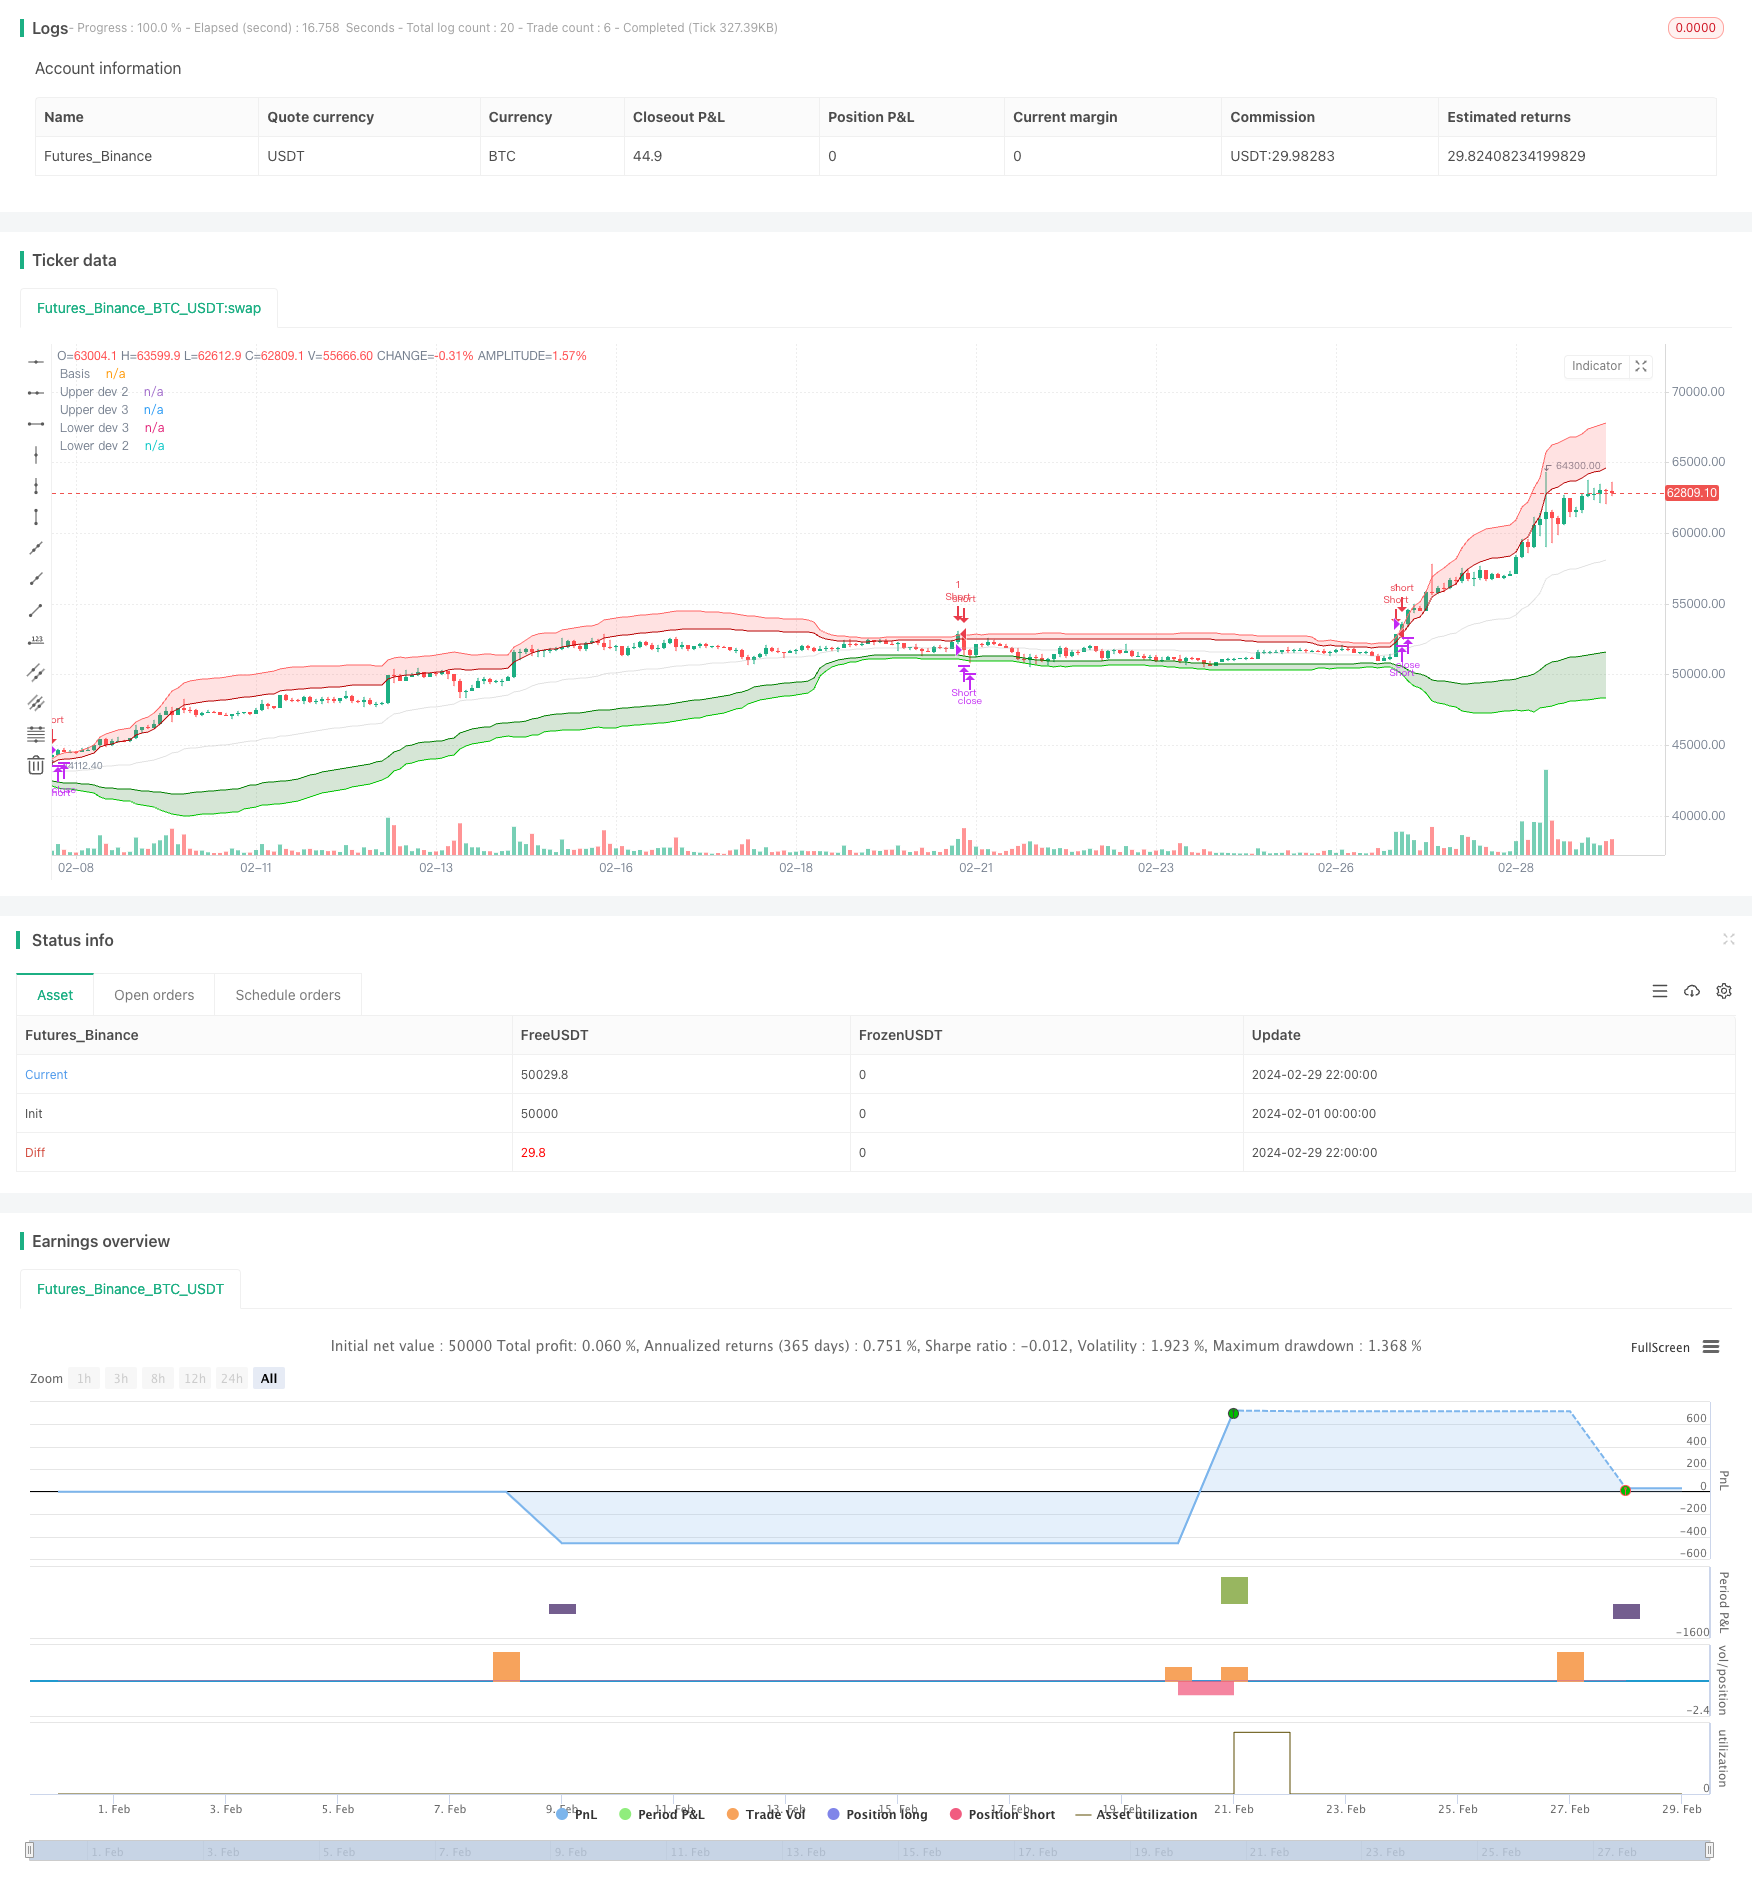
/*backtest
start: 2024-02-01 00:00:00
end: 2024-02-29 23:59:59
period: 2h
basePeriod: 15m
exchanges: [{"eid":"Futures_Binance","currency":"BTC_USDT"}]
*/

// This Pine Script™ code is subject to the terms of the Mozilla Public License 2.0 at https://mozilla.org/MPL/2.0/
// © GreatestUsername

//@version=5
strategy("BabyShark VWAP Strategy", overlay=true, margin_long=100, margin_short=100, calc_on_every_tick = true)


// VWAP
ls = input(false, title='Log-space', group = "Optional")
type = 'Average Deviation'
length = input(60, group="Strategy Modification")
source = input(close, group="Strategy Modification")
_low = ls == true ? math.log(low) : low
_high = ls == true ? math.log(high) : high
src = ls == true ? math.log(source) : source

//weighted mean
pine_vwmean(x, y) =>
    cw = 0.0
    cd = 0.0
    w_sum = 0.0
    d_sum = 0.0
    for i = 0 to y - 1 by 1
        cd := x[i]
        cw := volume[i]
        d_sum += cw * cd
        w_sum += cw
        w_sum
    d_sum / w_sum

//weighted standard deviation
pine_vwstdev(x, y, b) =>
    d_sum = 0.0
    w_sum = 0.0
    cd = 0.0
    for i = 0 to y - 1 by 1
        cd := x[i]
        cw = volume[i]
        d_sum += cw * math.pow(cd - b, 2)
        w_sum += cw
        w_sum
    math.sqrt(d_sum / w_sum)

//weighted average deviation
pine_vwavdev(x, y, b) =>
    d_sum = 0.0
    w_sum = 0.0
    cd = 0.0
    for i = 0 to y - 1 by 1
        cd := x[i]
        cw = volume[i]
        d_sum += cw * math.abs(cd - b)
        w_sum += cw
        w_sum
    d_sum / w_sum

vwmean = pine_vwmean(src, length)

//consider using Average Deviation instead of Standard Deviatio if there are values outside of 3rd upper & lower bands within a rolling window
dev = if type == 'Standard Deviation'
    dev = pine_vwstdev(src, length, vwmean)
    dev
else if type == 'Average Deviation'
    dev = pine_vwavdev(src, length, vwmean)
    dev

basis = ls == true ? math.exp(vwmean) : vwmean
plot(basis, color=color.new(#b7b7b7, 60), title='Basis')

upper_dev_2 = vwmean + dev * 2
upper_dev_3 = vwmean + dev * 3

lower_dev_2 = vwmean - dev * 2
lower_dev_3 = vwmean - dev * 3

fill(
     plot1=plot(ls == true ? math.exp(upper_dev_2) : upper_dev_2, color=color.new(#B20000, 0), title='Upper dev 2'),
     plot2=plot(ls == true ? math.exp(upper_dev_3) : upper_dev_3, color=color.new(#FF6666, 0), title='Upper dev 3', display=display.none),
     color=color.new(#FF4D4D, 80), title='Upper band'
     )
fill(
     plot1=plot(ls == true ? math.exp(lower_dev_3) : lower_dev_3, color=color.new(#00CC00, 0), title='Lower dev 3', display=display.none),
     plot2=plot(ls == true ? math.exp(lower_dev_2) : lower_dev_2, color=color.new(#008000, 0), title='Lower dev 2'),
     color=color.new(#006600, 80), title='Lower band'
     )


// Input to enable or disable the table visibility
table_visible = input(false, title="Show Table", group="Deviation Cross Monitor")
// Input for the number of candles to look back
table_length = input(300, title="Table Lookback Length", group="Deviation Cross Monitor")

// Custom count function
count_occurrences(cond, length) =>
    count = 0
    for i = 0 to length - 1
        if cond[i]
            count := count + 1
    count

// Count occurrences of prices above Upper dev 2 and below Lower dev 2

above_upper_dev_2 = count_occurrences(close > upper_dev_2, table_length)
below_lower_dev_2 = count_occurrences(close < lower_dev_2, table_length)

// Create table in the bottom right corner
var table tbl = table.new(position=position.bottom_right, rows=2, columns=2)

if table_visible
    if barstate.islast
        // Update the table headers
        table.cell(tbl, 0, 0, "Above Upper Dev 2", bgcolor=color.gray, text_color=color.white)
        table.cell(tbl, 0, 1, "Below Lower Dev 2", bgcolor=color.gray, text_color=color.white)

        // Update the table values
        table.cell(tbl, 1, 0, str.tostring(above_upper_dev_2), bgcolor=color.new(color.green, 90), text_color=color.green)
        table.cell(tbl, 1, 1, str.tostring(below_lower_dev_2), bgcolor=color.new(color.red, 90), text_color=color.red)
else
    table.delete(tbl)

// RSI
obvsrc = close
change_1 = ta.change(obvsrc)
obv = ta.cum(ta.change(obvsrc) > 0 ? volume : change_1 < 0 ? -volume : 0 * volume)

src2 = obv
len = input.int(5, minval=1, title="RSI Length", group="Strategy Modification")
up = ta.rma(math.max(ta.change(src2), 0), len)
down = ta.rma(-math.min(ta.change(src2), 0), len)
rsi = down == 0 ? 100 : up == 0 ? 0 : 100 - 100 / (1 + up / down)
higherlvl = input(70, title="Higher Level", group="Strategy Modification")
lowerlvl = input(30, title="Lower Level", group="Strategy Modification")


plot_color = rsi >= higherlvl ? color.red : rsi <= lowerlvl ? color.green : color.new(#b7b7b7, 60)
// plot(rsi, color=plot_color)

//plot(rsi, color=color.white)


// Count occurrences of RSI crossing higher level and lower level
cross_above_higher = ta.crossover(rsi, higherlvl)
cross_below_lower = ta.crossunder(rsi, lowerlvl)
above_higher_count = count_occurrences(cross_above_higher, table_length)
below_lower_count = count_occurrences(cross_below_lower, table_length)

// Create table in the bottom right corner
if (table_visible)
    var table tbl2 = table.new(position=position.bottom_right, rows=2, columns=2)
    if (barstate.islast)
        // Update the table headers
        table.cell(tbl2, 0, 0, "Higher Level Cross", bgcolor=color.gray, text_color=color.white)
        table.cell(tbl2, 0, 1, "Lower Level Cross", bgcolor=color.gray, text_color=color.white)

        // Update the table values
        table.cell(tbl2, 1, 0, str.tostring(above_higher_count), bgcolor=color.new(color.red, 90), text_color=color.red)
        table.cell(tbl2, 1, 1, str.tostring(below_lower_count), bgcolor=color.new(color.green, 90), text_color=color.green)


// Entries

// Long Entry:
// Price is in the shaded GREEN area of [Hoss] VWAP Deviation
// and the [Hoss] OBV RSI is GREEN.
longCondition1 = close <= lower_dev_3
longConditions = plot_color == color.green and longCondition1 and strategy.position_size == 0

// Short Entry:
// Price is in the shaded RED area of [Hoss] VWAP Deviation
// and the [Hoss] OBV RSI is RED.
shortCondition1 = close >= upper_dev_3
shortConditions = plot_color == color.red and shortCondition1 and strategy.position_size == 0

var int lastEntryBar = 0


shortEMA = ta.ema(close, 12)
longEMA = ta.ema(close, 21)
uptrend = shortEMA > longEMA

if longConditions and lastEntryBar < bar_index - 10 //and uptrend
    strategy.entry("Long", strategy.long, stop=close * 0.994)
    lastEntryBar := bar_index

if shortConditions and lastEntryBar < bar_index - 10 //and not uptrend
    strategy.entry("Short", strategy.short, stop=close * 1.006)
    lastEntryBar := bar_index


if strategy.position_size > 0 and (ta.crossover(close, basis) or strategy.opentrades.entry_price(strategy.opentrades - 1) * 0.994 > close)
    strategy.close("Long", immediately = true)
if strategy.position_size < 0 and (ta.crossunder(close, basis) or strategy.opentrades.entry_price(strategy.opentrades - 1) * 1.006 < close)
    strategy.close("Short", immediately = true)

// Stop Loss:
// 0.6%
// After 1 Loss => NO more Trades for 10 Candles (10 minutes) (usually a breakout will happen, and it takes average 10min till it ranges again. So basically wait for range to form again)

// Take Profit:
// Grey line on [Hoss] VWAP Deviation or 0.6%