TrendHunter w/MF ملٹی ٹائم فریم ٹرینڈ حکمت عملی

جائزہ
TrendHunter w/MF کثیر وقتی فریم ٹرینڈ حکمت عملی ایک ٹرینڈ فالو کرنے والی حکمت عملی ہے جو متعدد تکنیکی اشارے اور کثیر وقتی فریم تجزیہ پر مبنی ہے۔ یہ حکمت عملی مارکیٹ کلاؤڈ چارٹ، موونگ ایوریج، سپر ٹرینڈ، ویو ٹرینڈ، اور منی فلو جیسے عوامل کو مدنظر رکھتے ہوئے، داخلے کے مقامات کا تعین کرنے کے لیے سخت شرائط کا استعمال کرتی ہے تاکہ مارکیٹ کے اہم رجحان کو پکڑا جا سکے۔
حکمت عملی کا اصول
اس حکمت عملی کا بنیادی اصول متعدد تکنیکی اشارے کے متعدد وقتی فریموں پر جامع تجزیہ پر مبنی ہے۔ خاص طور پر:
-
مارکیٹ کلاؤڈ (Ichimoku): قیمت اور کلاؤڈ کی نسبتہ پوزیشن کے ساتھ ساتھ موونگ ایوریج اور کلاؤڈ کی نسبتہ پوزیشن کا تجزیہ کرکے موجودہ مارکیٹ کے رجحان کا تعین۔ جب قیمت کلاؤڈ کے اوپر اور موونگ ایوریج بھی کلاؤڈ کے اوپر ہو تو اسے اوپر کا رجحان سمجھا جاتا ہے؛ اس کے برعکس نیچے کا رجحان سمجھا جاتا ہے۔
-
سپر ٹرینڈ (SuperTrend): قیمت اور سپر ٹرینڈ کی نسبتہ پوزیشن کا تجزیہ کرکے موجودہ مارکیٹ کے رجحان کی تصدیق۔ جب قیمت سپر ٹرینڈ کے اوپر ہو تو اسے اوپر کا رجحان سمجھا جاتا ہے؛ اس کے برعکس نیچے کا رجحان سمجھا جاتا ہے۔
-
ویو ٹرینڈ (WaveTrend): ویو ٹرینڈ اشارے کی سمت اور پوزیشن کا تجزیہ کرکے موجودہ مارکیٹ کے رجحان کا تعین۔ جب ویو ٹرینڈ اوپر کی طرف ہو اور انتہائی خریداری کے زون تک نہ پہنچا ہو تو اسے اوپر کا رجحان سمجھا جاتا ہے؛ جب ویو ٹرینڈ نیچے کی طرف ہو اور انتہائی فروخت کے زون تک نہ پہنچا ہو تو اسے نیچے کا رجحان سمجھا جاتا ہے۔
-
منی فلو (MoneyFlow): منی فلو اشارے کی حالت کا تجزیہ کرکے موجودہ مارکیٹ کے رجحان کی تصدیق۔ جب منی فلو مثبت ہو تو اسے اوپر کا رجحان سمجھا جاتا ہے؛ اس کے برعکس نیچے کا رجحان سمجھا جاتا ہے۔
طویل خریداری کی صورت میں، حکمت عملی کا تقاضا ہے کہ قیمت کلاؤڈ کے اوپر ہو، موونگ ایوریج کلاؤڈ کے اوپر ہو، سپر ٹرینڈ اوپر کی طرف ہو، ویو ٹرینڈ اوپر کی طرف ہو اور انتہائی خریداری کے زون تک نہ پہنچا ہو، اور منی فلو مثبت ہو۔ مختصر فروخت اس کے برعکس ہے۔ متعدد اشارے اور کثیر وقتی فریموں کی یہ سخت فلٹرنگ اتار چڑھاؤ والی مارکیٹ میں بار بار لین دین سے بچنے میں مؤثر ثابت ہو سکتی ہے، اس طرح حکمت عملی کے استحکام اور بھروسہ مندی میں اضافہ ہوتا ہے۔
فوائد کا تجزیہ
-
متعدد اشارے کا مشترکہ فیصلہ، اعلیٰ بھروسہ مندی: یہ حکمت عملی متعدد تکنیکی اشارے پر غور کرتی ہے، یہ اشارے مختلف مارکیٹ حالات میں ایک دوسرے کی تکمیل کرتے ہیں اور مارکیٹ کے رجحان کو جامع طور پر ظاہر کر سکتے ہیں، جس سے ایک اشارے کے ممکنہ غلطی سے بچا جا سکتا ہے۔
-
داخلے کی سخت شرائط، بار بار لین دین سے بچاؤ: حکمت عملی داخلے کے لیے سخت شرائط مقرر کرتی ہے، جس کے لیے متعدد اشارے کو بیک وقت پورا کرنا ضروری ہے، یہ اتار چڑھاؤ والی مارکیٹ میں بار بار لین دین سے مؤثر طریقے سے بچتا ہے اور حکمت عملی کے نقصان کو کم کرتا ہے۔
-
کثیر وقتی فریم تجزیہ، بڑے رجحان کو سمجھنا: حکمت عملی متعدد وقتی فریموں پر تجزیہ کرتی ہے، اس سے حکمت عملی کو بڑے تناظر سے مارکیٹ کے اہم رجحان کو سمجھنے میں مدد ملتی ہے اور قلیل مدتی شور سے متاثر ہونے سے بچتی ہے۔
-
اسٹاپ لوس کی واضح حکمت عملی، قابل کنٹرول خطرہ: حکمت عملی اسٹاپ لوس کی شرط کے طور پر سپر ٹرینڈ استعمال کرتی ہے، جیسے ہی مارکیٹ کا رجحان بدلتا ہے، حکمت عملی بروقت نقصان کو روک سکتی ہے اور نقصان کو قابل قبول حد کے اندر رکھ سکتی ہے۔
خطرے کا تجزیہ
-
متحرک ایڈجسٹمنٹ کی کمی، مارکیٹ کی تبدیلیوں سے نمٹنے کی محدود صلاحیت: اس حکمت عملی کے پیرامیٹرز طے شدہ ہیں اور مارکیٹ کی حالت کے مطابق متحرک طور پر ایڈجسٹ کرنے کی صلاحیت نہیں ہے۔ مارکیٹ کی حالت میں بڑی تبدیلیاں آنے پر حکمت عملی ناکام ہو سکتی ہے۔
-
داخلے کی شرائط بہت سخت، مواقع ضائع ہو سکتے ہیں: حکمت عملی کے داخلے کی شرائط بہت سخت ہیں، اگرچہ اس سے بار بار لین دین سے بچا جا سکتا ہے، لیکن اس کی وجہ سے حکمت عملی کچھ اچھے داخلے کے مواقع بھی کھو سکتی ہے۔
-
انتہائی حالات کے لیے موافقت نامعلوم: حکمت عملی عام مارکیٹ حالات میں اچھی کارکردگی دکھاتی ہے، لیکن کچھ انتہائی حالات جیسے تیزی سے بڑی تبدیلیوں کے لیے حکمت عملی کی موافقت کا ابھی امتحان باقی ہے۔
-
اسٹاپ لوس حکمت عملی نسبتاً سادہ، بہتری کی گنجائش موجود: فی الحال حکمت عملی صرف سپر ٹرینڈ کو اسٹاپ لوس کی شرط کے طور پر استعمال کرتی ہے، یہ اگرچہ سادہ اور واضح ہے، لیکن اسٹاپ لوس حکمت عملی میں مزید بہتری کی گنجائش موجود ہے تاکہ خطرے کو بہتر طریقے سے کنٹرول کیا جا سکے۔
بہتری کی سمت
-
مارکیٹ کی حالت کا تعین متعارف کروانا، پیرامیٹرز کو متحرک طور پر ایڈجسٹ کرنا: مارکیٹ کی حالت کا تعین کرنے والے اشارے جیسے وولٹیلیٹی اشارے کو متعارف کرایا جا سکتا ہے، اور مارکیٹ کی حالت میں تبدیلی کے مطابق حکمت عملی کے پیرامیٹرز کو متحرک طور پر ایڈجسٹ کیا جا سکتا ہے تاکہ مختلف مارکیٹ ماحول کے مطابق ڈھالا جا سکے۔
-
داخلے کی شرائط کو بہتر بنانا، حساسیت بڑھانا: داخلے کی شرائط میں کچھ بہتری لائی جا سکتی ہے، جیسے مزید تصدیقی اشارے شامل کرنا، تاکہ بھروسہ مندی برقرار رکھتے ہوئے حکمت عملی کی حساسیت بڑھائی جا سکے اور زیادہ لین دین کے مواقع کو پکڑا جا سکے۔
-
انتہائی حالات کے لیے اقدامات شامل کرنا: کچھ انتہائی حالات جیسے تیزی سے بڑی تبدیلیوں کے لیے، کچھ خصوصی اقدامات متعارف کرائے جا سکتے ہیں، جیسے اسٹاپ لوس کی حد بڑھانا یا لین دین کو روکنا، تاکہ انتہائی حالات میں حکمت عملی کے خطرے کو کم کیا جا سکے۔
-
اسٹاپ لوس حکمت عملی کو بہتر بنانا، خطرے پر قابو پانے کی صلاحیت بڑھانا: مزید اسٹاپ لوس شرائط متعارف کرائی جا سکتی ہیں، جیسے وقت کی بنیاد پر اسٹاپ لوس، بینڈ کی بنیاد پر اسٹاپ لوس، اور کچھ متحرک اسٹاپ لوس حکمت عملی جیسے ٹریلنگ اسٹاپ لوس بھی شامل کیا جا سکتا ہے تاکہ خطرے کو بہتر طریقے سے کنٹرول کیا جا سکے۔
خلاصہ
TrendHunter w/MF کثیر وقتی فریم ٹرینڈ حکمت عملی ایک کثیر اشارے، کثیر وقتی فریم تجزیہ پر مبنی ٹرینڈ فالو کرنے والی حکمت عملی ہے۔ یہ حکمت عملی مارکیٹ کلاؤڈ چارٹ، موونگ ایوریج، سپر ٹرینڈ، ویو ٹرینڈ، اور منی فلو جیسے عوامل، داخلے کی سخت شرائط، اور کثیر وقتی فریم تجزیہ کے ذریعے مارکیٹ کے اہم رجحان کو نسبتاً قابل اعتماد طریقے سے پکڑ سکتی ہے، اتار چڑھاؤ والی مارکیٹ میں بار بار لین دین سے بچ سکتی ہے، اور اس میں اچھا استحکام اور بھروسہ مندی ہے۔
ساتھ ہی، اس حکمت عملی میں کچھ حدود اور خطرات بھی ہیں، جیسے متحرک ایڈجسٹمنٹ کی صلاحیت کی کمی، داخلے کی شرائط کا بہت سخت ہونا، انتہائی حالات کے لیے موافقت کا نامعلوم ہونا، اور اسٹاپ لوس حکمت عملی کا نسبتاً سادہ ہونا۔ یہ وہ سمت ہیں جہاں مستقبل میں اس حکمت عملی کو بہتر بنایا جا سکتا ہے۔
مجموعی طور پر، TrendHunter w/MF کثیر وقتی فریم ٹرینڈ حکمت عملی ایک اچھی صلاحیت والی ٹرینڈ فالو کرنے والی حکمت عملی ہے۔ اس حکمت عملی کو استعمال کرتے وقت، تاجروں کو اس کے اصولوں، فوائد اور خطرات کو اچھی طرح سمجھنا چاہیے، اور اپنی خطرے کی برداشت اور تجارتی انداز کے مطابق ضروری ایڈجسٹمنٹ اور بہتری کرنی چاہیے۔ نیز، مارکیٹ کی حالت میں ہونے والی تبدیلیوں پر گہری نظر رکھنی چاہیے اور مارکیٹ کی تبدیلیوں کے مطابق حکمت عملی کو بروقت ایڈجسٹ کرنا چاہیے۔ صرف گہری تفہیم اور محتاط استعمال کی بنیاد پر ہی یہ حکمت عملی اپنی ممکنہ صلاحیتوں کو بروئے کار لا سکتی ہے اور تاجروں کو مستحکم منافع فراہم کر سکتی ہے۔
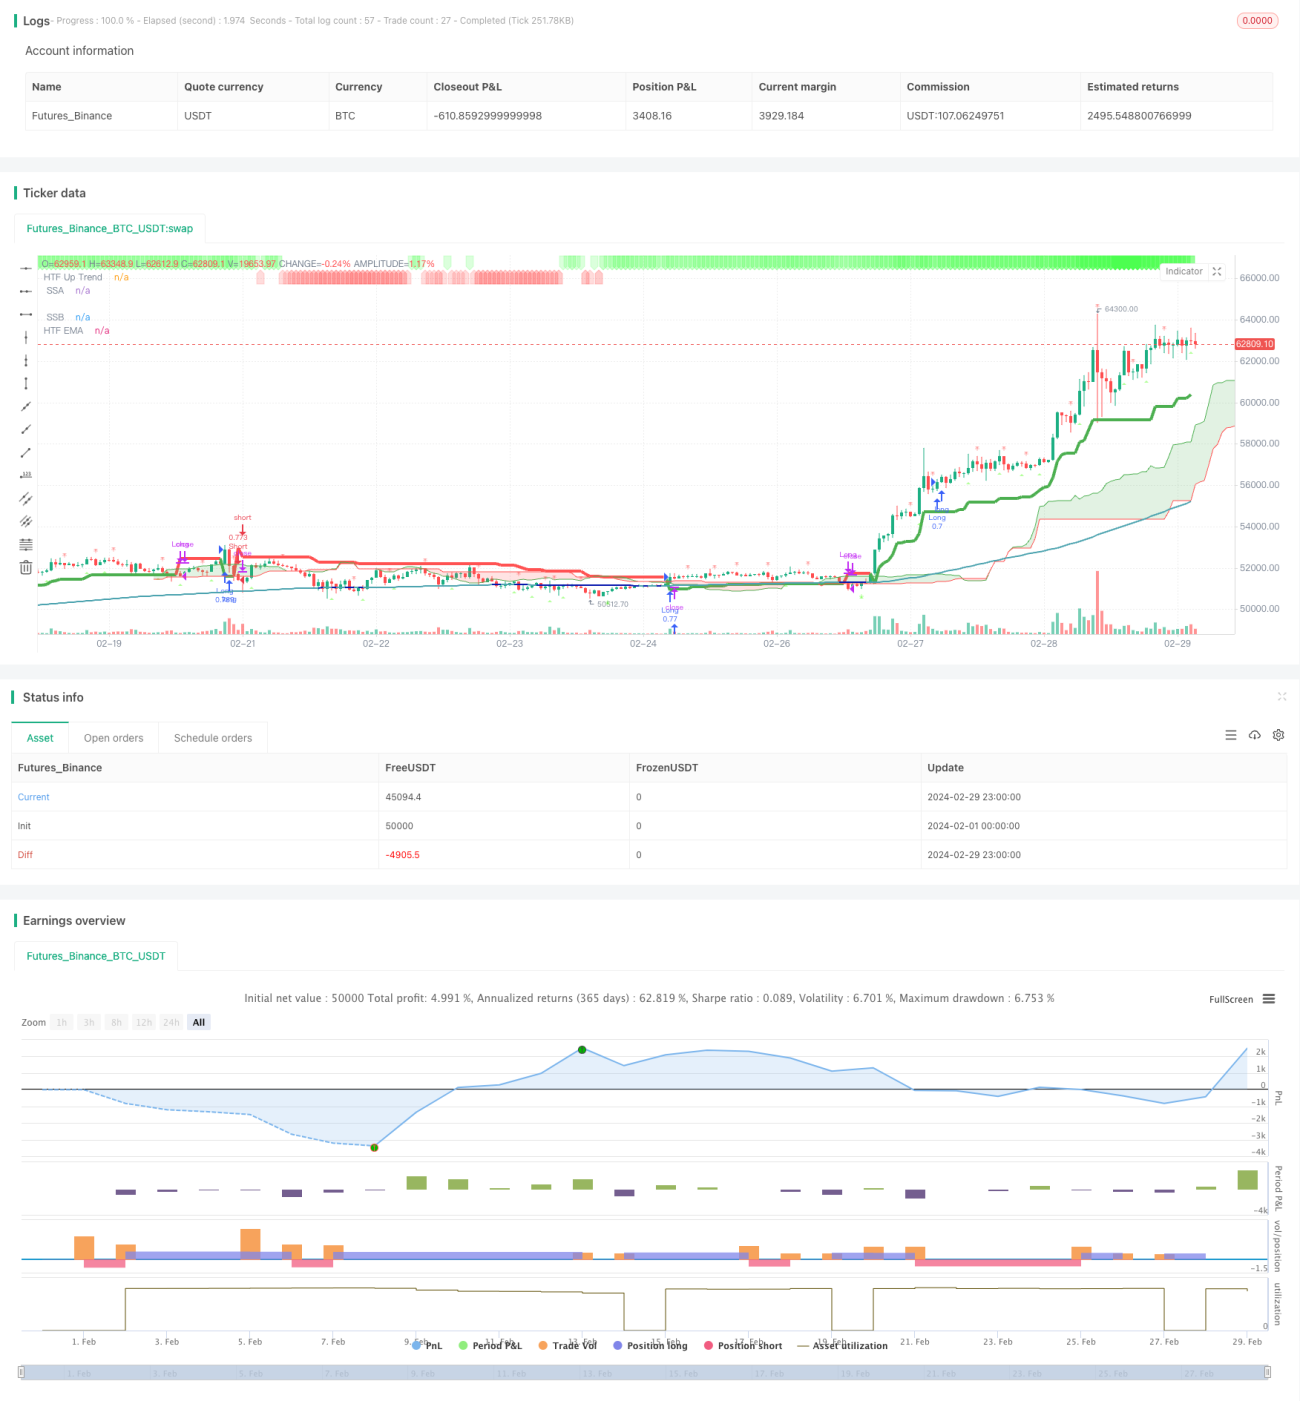
/*backtest
start: 2024-02-01 00:00:00
end: 2024-02-29 23:59:59
period: 1h
basePeriod: 15m
exchanges: [{"eid":"Futures_Binance","currency":"BTC_USDT"}]
*/

// This Pine Script™ code is subject to the terms of the Mozilla Public License 2.0 at https://mozilla.org/MPL/2.0/
// © godzcopilot / blockybears

// Thanks to anthonyf50 for his MTF Ichimoku https://www.tradingview.com/script/Pw9cBFma/- 1