CVD ڈائیورجنس مقداری تجارتی حکمت عملی
حکمت عملی کا خلاصہ: اس CVD انحراف کی پیمائش کرنے والی تجارتی حکمت عملی کا استعمال CVD اشارے اور قیمت کی تشکیل کے انحراف سے ہوتا ہے تاکہ ممکنہ رجحان کی تبدیلی کا اشارہ پکڑ سکے۔ حکمت عملی CVD اشارے کا حساب لگاتی ہے اور قیمت کے ساتھ موازنہ کرکے فیصلہ کرتی ہے کہ آیا یہ ایک پومین یا پومینڈ انحراف ہے۔ جب انحراف کا اشارہ ہوتا ہے تو ، حکمت عملی زیادہ یا خالی پوزیشن پر کھڑی ہوجاتی ہے۔ اس کے ساتھ ہی ، خطرے کو کنٹرول کرنے اور منافع کو مقفل کرنے کے لئے متحرک اسٹاپ لاس اور فکسڈ فی صد اسٹاپ کا استعمال کیا جاتا ہے۔ یہ حکمت عملی ایک ہی وقت میں ایک سے زیادہ پوزیشنوں کے لئے پائریجڈ پوزیشننگ کی حمایت کرتی ہے۔
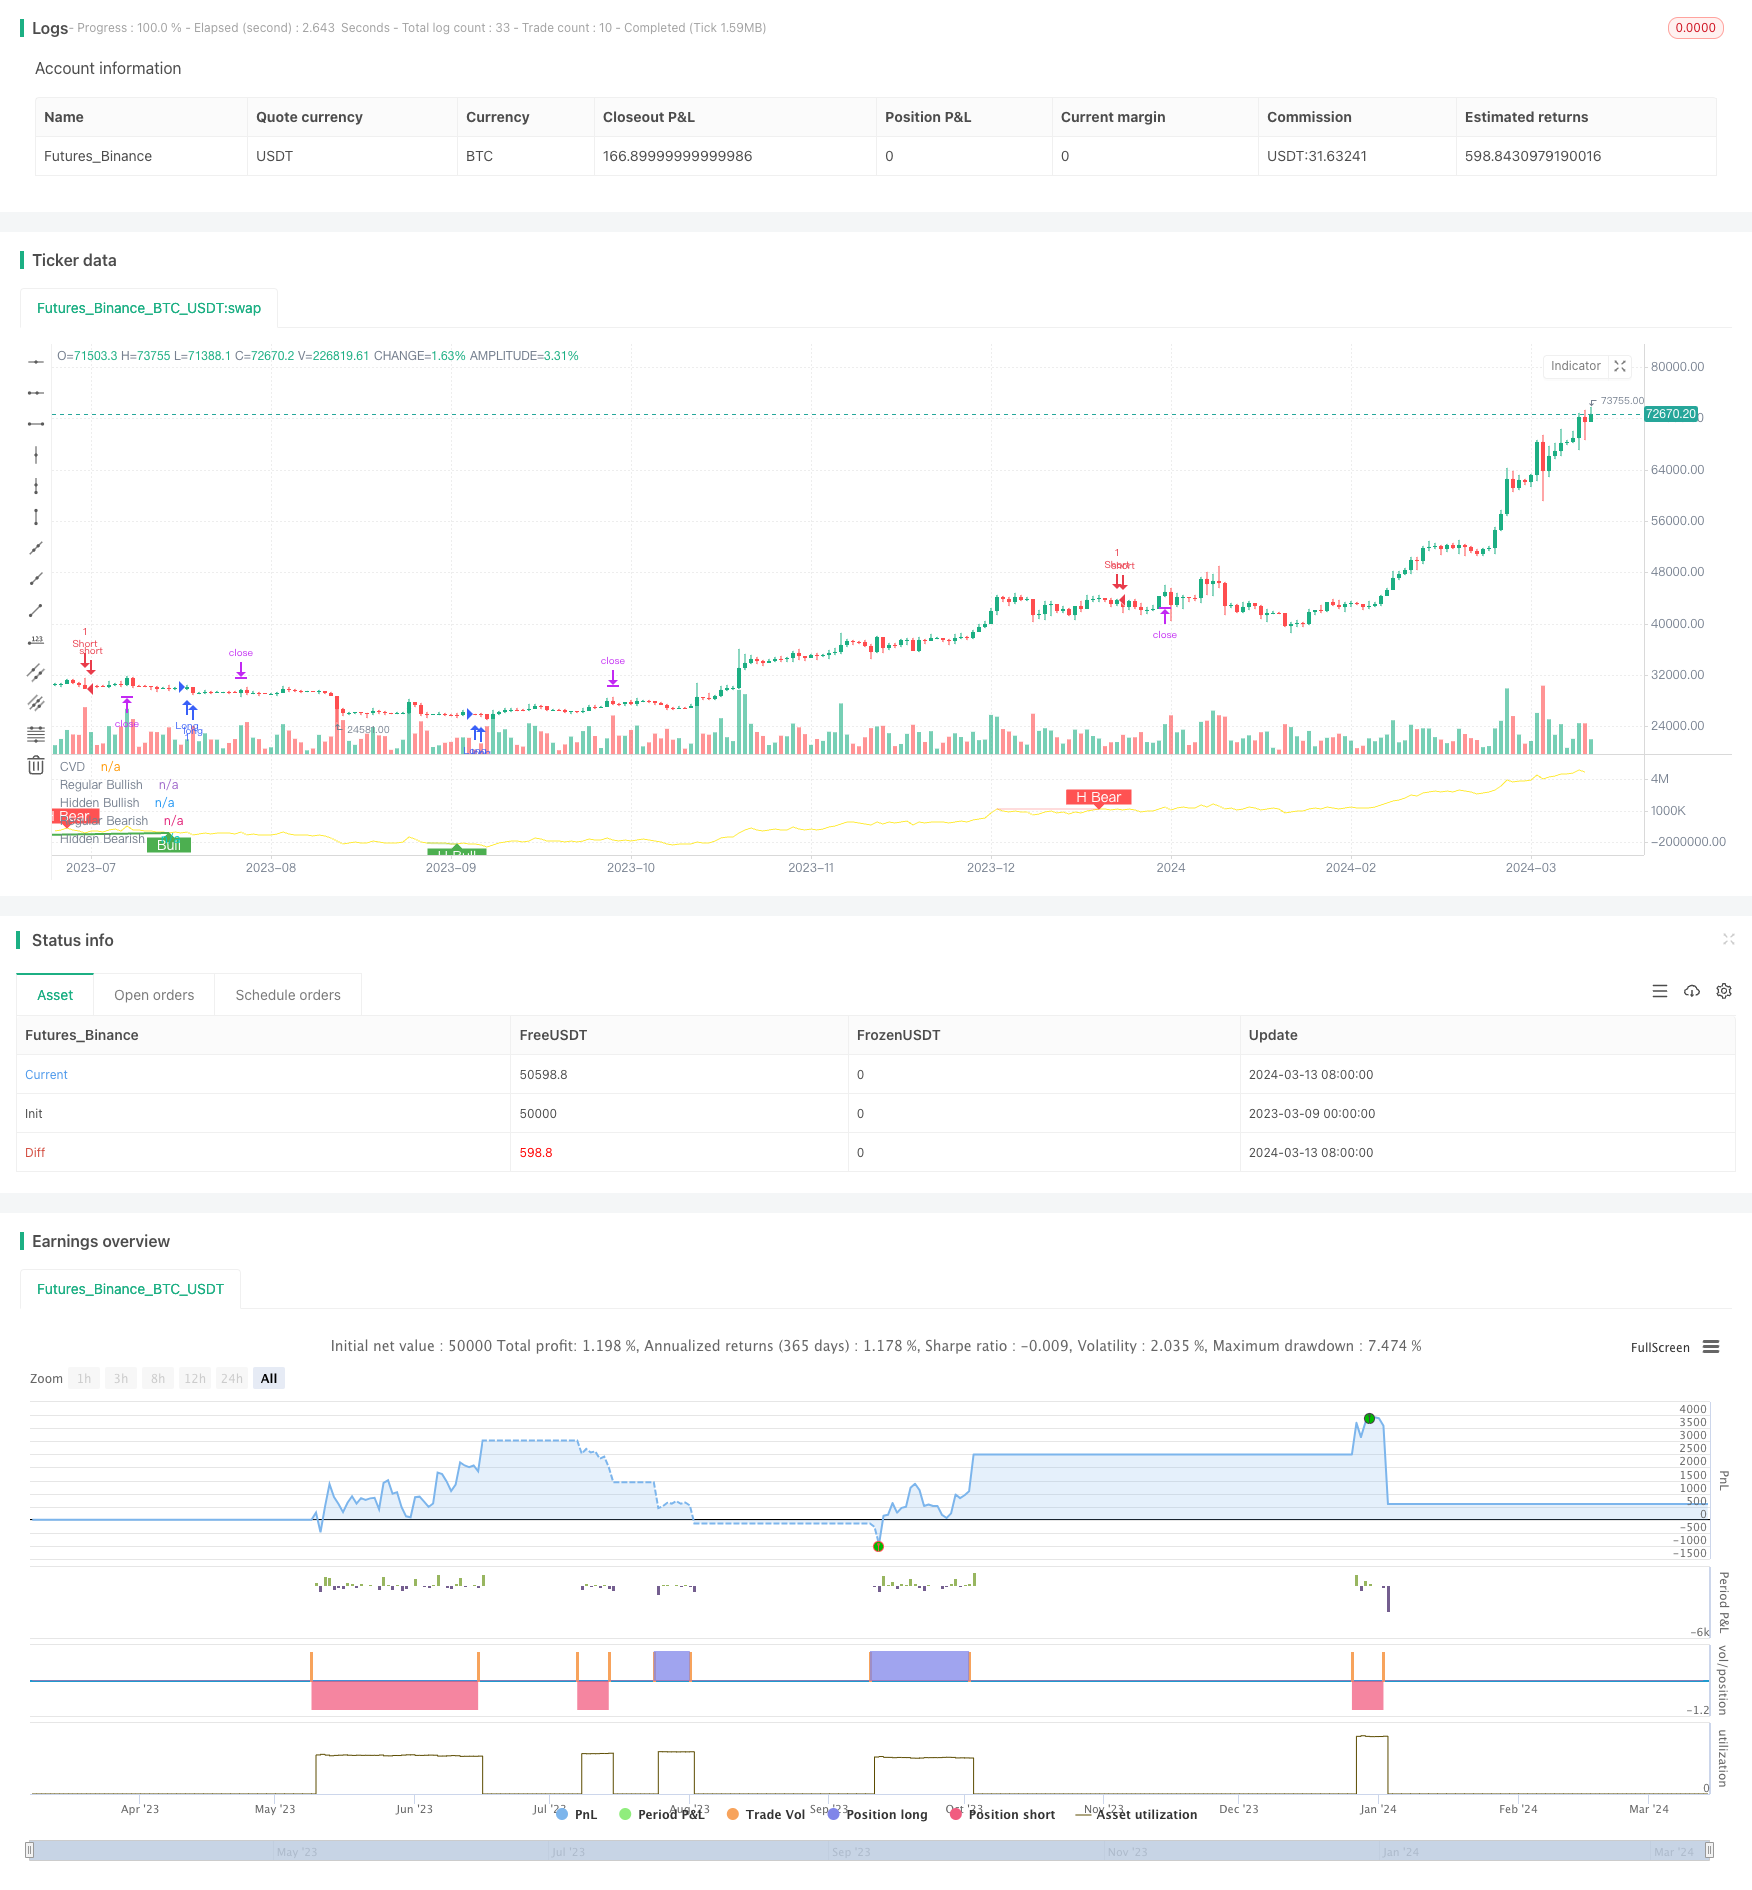
حکمت عملی:
- سی وی ڈی اشارے کا حساب لگائیں: سی وی ڈی اشارے اور اس کی چلتی اوسط کو کثیر سر ٹرانزیکشن اور خالی سر ٹرانزیکشن کی بنیاد پر حساب لگائیں۔
- انحراف کی شناخت: سی وی ڈی اشارے کے اعلی اور کم اور قیمت کے اعلی اور کم کے درمیان موازنہ کرکے ، یہ فیصلہ کریں کہ آیا انحراف پیدا ہوا ہے۔
- روایتی پیشن گوئی سے ہٹ کر: قیمتوں میں جدت طرازی کم ہے ، لیکن سی وی ڈی انڈیکس میں زیادہ اونچائی اور کم ہے
- خفیہ پوائنٹس: قیمتوں میں جدت طرازی زیادہ ہے ، لیکن سی وی ڈی انڈیکس میں زیادہ کم اور کم درجے کی تشکیل
- معمول سے ہٹ کر: قیمتوں میں نئی اونچائی ، لیکن سی وی ڈی اشارے میں کم اونچائییں ہیں
- پوشیدہ بیعانہ کی واپسی: قیمت کی جدت کم ہے ، لیکن سی وی ڈی اشارے اعلی اونچائیوں کی تشکیل کرتے ہیں
- پوزیشن کھولنا: جب انحراف کے اشارے کی نشاندہی کی جاتی ہے تو ، انحراف کی قسم کے مطابق پوزیشن کھولیں یا خالی کریں۔
- اسٹاپ نقصان: موبائل اسٹاپ اور فکسڈ فیصد اسٹاپ کا استعمال کریں۔ اسٹاپ نقصان کی قیمت اسٹاپ نقصان کی فیصد کے حساب سے کھولی گئی قیمت کے حساب سے ہے ، اور اسٹاپ نقصان کی قیمت کھولی گئی قیمت کے حساب سے کھولی گئی ہے۔
- پیراڈائزنگ: حکمت عملی میں زیادہ سے زیادہ 3 پوزیشنوں کی اجازت دی گئی ہے۔
حکمت عملی کے فوائد:
- رجحان الٹ سگنل: سی وی ڈی انحراف ایک موثر رجحان الٹ سگنل ہے جو رجحان الٹ مواقع کو پکڑنے میں مدد کرتا ہے۔
- رجحان جاری سگنل: پوشیدہ انحراف رجحان جاری سگنل کے طور پر کام کرسکتا ہے ، جس سے حکمت عملی کو رجحان میں صحیح سمت میں رہنے میں مدد ملتی ہے۔
- خطرے پر قابو پانا: متحرک اسٹاپ نقصان اور فکسڈ فیصد اسٹاپ کا استعمال کرتے ہوئے ، خطرے پر موثر کنٹرول حاصل کیا گیا ہے۔
- پیراڈائزڈ پوزیشننگ: بہت سے پوزیشنوں کو پوزیشننگ کی اجازت دیتا ہے تاکہ رجحانات سے بہتر فائدہ اٹھایا جاسکے۔
حکمت عملی کا خطرہ:
- سگنل کی افادیت: سگنل سے ہٹنا مکمل طور پر قابل اعتماد نہیں ہے، کبھی کبھی جھوٹا سگنل ظاہر ہوتا ہے۔
- پیرامیٹرز کی ترتیب: حکمت عملی کے نتائج پیرامیٹرز کی ترتیب سے زیادہ حساس ہیں ، مختلف پیرامیٹرز مختلف نتائج کا باعث بن سکتے ہیں۔
- اسٹاپ نقصان کا پوائنٹ: شدید حالات میں ، اسٹاپ نقصان کا آرڈر پہلے سے طے شدہ قیمت پر تجارت کرنے سے قاصر ہوسکتا ہے ، جس سے اضافی خطرہ لاحق ہوتا ہے۔
- ٹریڈنگ فیس: اکثر کھلی پوزیشنوں سے اعلی ٹریڈنگ فیس ہوسکتی ہے ، جو حکمت عملی کی آمدنی کو متاثر کرتی ہے۔
بہتر بنانے کی سمت:
- متحرک پیرامیٹرز کی اصلاح: مختلف مارکیٹ کے حالات کے لئے موافقت پذیر پیرامیٹرز کو اپنانا ، سگنل کی تاثیر کو بہتر بنانا۔
- دوسرے اشارے کے ساتھ مل کر: دیگر تکنیکی اشارے جیسے RSI، MACD وغیرہ کے ساتھ مل کر ، سگنل کی وشوسنییتا کو بہتر بنائیں۔
- اسٹاپ نقصان کو بہتر بنائیں: اعلی درجے کی اسٹاپ نقصان کی حکمت عملی جیسے ٹریکنگ اسٹاپ ، اتار چڑھاؤ کی شرح اسٹاپ وغیرہ۔
- پوزیشن سائز مینجمنٹ: مارکیٹ میں اتار چڑھاو ، اکاؤنٹ فنڈز وغیرہ کی نقل و حرکت کے مطابق پوزیشن کا سائز ایڈجسٹ کریں۔
خلاصہ: سی وی ڈی کوانٹومیشن ٹریڈنگ حکمت عملی سی وی ڈی اشارے اور قیمت کے مابین انحراف کو پکڑنے اور ممکنہ رجحان کی واپسی کے مواقع کی نشاندہی کرتی ہے۔ اس کے ساتھ ساتھ موبائل اسٹاپ نقصان اور فکسڈ فیصد اسٹاپ کو کنٹرول کرنے کا خطرہ ہے۔ اس حکمت عملی کا بنیادی فائدہ یہ ہے کہ یہ رجحان کی واپسی اور جاری سگنل کو مؤثر طریقے سے پکڑ سکتا ہے ، اور پائریٹائزنگ کے ذریعہ رجحان کی صورتحال کو بہتر طور پر پکڑ سکتا ہے۔ لیکن اس حکمت عملی میں سگنل کی تاثیر ، پیرامیٹرز کی ترتیب ، اسٹاپ نقصانات کی سلائڈ پوائنٹس اور تجارتی اخراجات جیسے خطرات بھی موجود ہیں۔ مستقبل میں ، متحرک پیرامیٹرز کی اصلاح ، دیگر اشارے کے ساتھ مل کر ، اسٹاپ نقصانات کی روک تھام اور پوزیشن کے سائز کے انتظام جیسے طریقوں سے حکمت عملی کی کارکردگی کو مزید تقویت بخش بنایا جاسکتا ہے۔ مجموعی طور پر ، سی وی ڈی کوانٹومیشن ٹریڈنگ حکمت عملی ایک موثر اور قابل عمل رجحان ٹریڈنگ حکمت عملی ہے ، جو رجحان کی گرفت میں آنے والے مواقع کو کنٹرول کرنے کے لئے موزوں کو کنٹرول کرنے کے لئے موزوں
/*backtest
start: 2023-03-09 00:00:00
end: 2024-03-14 00:00:00
period: 1d
basePeriod: 1h
exchanges: [{"eid":"Futures_Binance","currency":"BTC_USDT"}]
*/

// This source code is subject to the terms of the Mozilla Public License 2.0 at https://mozilla.org/MPL/2.0/

//@version=5
//@ mmattman

//Thank you to @ contrerae and Tradingview each for parts of the code to make
//this indicator and matching strategy and also theCrypster for the clean concise TP/SL code.

// indicator(title="CVD Divergence Indicator 1", shorttitle='CVD Div1', format=format.price, timeframe="", timeframe_gaps=true)

strategy("CVD Divergence Strategy.1.mm", shorttitle = 'CVD Div Str 1', overlay=false)


//..................................................................................................................
// Inputs
periodMa = input.int(title='MA Length', minval=1, defval=20)
plotMa = input(title='Plot MA?', defval=false)

// Calculations (Bull & Bear Balance Indicator by Vadim Gimelfarb)
iff_1 = close[1] < open ? math.max(high - close[1], close - low) : math.max(high - open, close - low)
iff_2 = close[1] > open ? high - low : math.max(open - close[1], high - low)
iff_3 = close[1] < open ? math.max(high - close[1], close - low) : high - open
iff_4 = close[1] > open ? high - low : math.max(open - close[1], high - low)
iff_5 = close[1] < open ? math.max(open - close[1], high - low) : high - low
iff_6 = close[1] > open ? math.max(high - open, close - low) : iff_5
iff_7 = high - close < close - low ? iff_4 : iff_6
iff_8 = high - close > close - low ? iff_3 : iff_7
iff_9 = close > open ? iff_2 : iff_8
bullPower = close < open ? iff_1 : iff_9
iff_10 = close[1] > open ? math.max(close[1] - open, high - low) : high - low
iff_11 = close[1] > open ? math.max(close[1] - low, high - close) : math.max(open - low, high - close)
iff_12 = close[1] > open ? math.max(close[1] - open, high - low) : high - low
iff_13 = close[1] > open ? math.max(close[1] - low, high - close) : open - low
iff_14 = close[1] < open ? math.max(open - low, high - close) : high - low
iff_15 = close[1] > open ? math.max(close[1] - open, high - low) : iff_14
iff_16 = high - close < close - low ? iff_13 : iff_15
iff_17 = high - close > close - low ? iff_12 : iff_16
iff_18 = close > open ? iff_11 : iff_17
bearPower = close < open ? iff_10 : iff_18

// Calculations (Bull & Bear Pressure Volume)
bullVolume = bullPower / (bullPower + bearPower) * volume
bearVolume = bearPower / (bullPower + bearPower) * volume

// Calculations Delta
delta = bullVolume - bearVolume
cvd = ta.cum(delta)
cvdMa = ta.sma(cvd, periodMa)

// Plotting
customColor = cvd > cvdMa ? color.new(color.teal, 50) : color.new(color.red, 50)
plotRef1 = plot(cvd, style=plot.style_line, linewidth=1, color=color.new(color.yellow, 0), title='CVD')
plotRef2 = plot(plotMa ? cvdMa : na, style=plot.style_line, linewidth=1, color=color.new(color.white, 0), title='CVD MA')
fill(plotRef1, plotRef2, color=customColor)
//..................................................................................................................


// len = input.int(title="RSI Period", minval=1, defval=14)
// src = input(title="RSI Source", defval=close)
lbR = input(title="Pivot Lookback Right", defval=3)
lbL = input(title="Pivot Lookback Left", defval=7)
rangeUpper = input(title="Max of Lookback Range", defval=60)
rangeLower = input(title="Min of Lookback Range", defval=5)
plotBull = input(title="Plot Bullish", defval=true)
plotHiddenBull = input(title="Plot Hidden Bullish", defval=true)
plotBear = input(title="Plot Bearish", defval=true)
plotHiddenBear = input(title="Plot Hidden Bearish", defval=true)
bearColor = color.red
bullColor = color.green
hiddenBullColor = color.new(color.green, 80)
hiddenBearColor = color.new(color.red, 80)
textColor = color.white
noneColor = color.new(color.white, 100)
osc = cvd

// plot(osc, title="CVD", linewidth=2, color=#2962FF)
// hline(50, title="Middle Line", color=#787B86, linestyle=hline.style_dotted)
// obLevel = hline(70, title="Overbought", color=#787B86, linestyle=hline.style_dotted)
// osLevel = hline(30, title="Oversold", color=#787B86, linestyle=hline.style_dotted)
// fill(obLevel, osLevel, title="Background", color=color.rgb(33, 150, 243, 90))

plFound = na(ta.pivotlow(osc, lbL, lbR)) ? false : true
phFound = na(ta.pivothigh(osc, lbL, lbR)) ? false : true
_inRange(cond) =>
	bars = ta.barssince(cond == true)
	rangeLower <= bars and bars <= rangeUpper

//------------------------------------------------------------------------------
// Regular Bullish
// Osc: Higher Low

oscHL = osc[lbR] > ta.valuewhen(plFound, osc[lbR], 1) and _inRange(plFound[1])

// Price: Lower Low

priceLL = low[lbR] < ta.valuewhen(plFound, low[lbR], 1)
bullCondAlert = priceLL and oscHL and plFound
bullCond = plotBull and bullCondAlert

plot(
     plFound ? osc[lbR] : na,
     offset=-lbR,
     title="Regular Bullish",
     linewidth=2,
     color=(bullCond ? bullColor : noneColor)
     )

plotshape(
	 bullCond ? osc[lbR] : na,
	 offset=-lbR,
	 title="Regular Bullish Label",
	 text=" Bull ",
	 style=shape.labelup,
	 location=location.absolute,
	 color=bullColor,
	 textcolor=textColor
	 )

//------------------------------------------------------------------------------
// Hidden Bullish
// Osc: Lower Low

oscLL = osc[lbR] < ta.valuewhen(plFound, osc[lbR], 1) and _inRange(plFound[1])

// Price: Higher Low

priceHL = low[lbR] > ta.valuewhen(plFound, low[lbR], 1)
hiddenBullCondAlert = priceHL and oscLL and plFound
hiddenBullCond = plotHiddenBull and hiddenBullCondAlert

plot(
	 plFound ? osc[lbR] : na,
	 offset=-lbR,
	 title="Hidden Bullish",
	 linewidth=2,
	 color=(hiddenBullCond ? hiddenBullColor : noneColor)
	 )

plotshape(
	 hiddenBullCond ? osc[lbR] : na,
	 offset=-lbR,
	 title="Hidden Bullish Label",
	 text=" H Bull ",
	 style=shape.labelup,
	 location=location.absolute,
	 color=bullColor,
	 textcolor=textColor
	 )

//------------------------------------------------------------------------------
// Regular Bearish
// Osc: Lower High

oscLH = osc[lbR] < ta.valuewhen(phFound, osc[lbR], 1) and _inRange(phFound[1])

// Price: Higher High

priceHH = high[lbR] > ta.valuewhen(phFound, high[lbR], 1)

bearCondAlert = priceHH and oscLH and phFound
bearCond = plotBear and bearCondAlert

plot(
	 phFound ? osc[lbR] : na,
	 offset=-lbR,
	 title="Regular Bearish",
	 linewidth=2,
	 color=(bearCond ? bearColor : noneColor)
	 )

plotshape(
	 bearCond ? osc[lbR] : na,
	 offset=-lbR,
	 title="Regular Bearish Label",
	 text=" Bear ",
	 style=shape.labeldown,
	 location=location.absolute,
	 color=bearColor,
	 textcolor=textColor
	 )

//------------------------------------------------------------------------------
// Hidden Bearish
// Osc: Higher High

oscHH = osc[lbR] > ta.valuewhen(phFound, osc[lbR], 1) and _inRange(phFound[1])

// Price: Lower High

priceLH = high[lbR] < ta.valuewhen(phFound, high[lbR], 1)

hiddenBearCondAlert = priceLH and oscHH and phFound
hiddenBearCond = plotHiddenBear and hiddenBearCondAlert

plot(
	 phFound ? osc[lbR] : na,
	 offset=-lbR,
	 title="Hidden Bearish",
	 linewidth=2,
	 color=(hiddenBearCond ? hiddenBearColor : noneColor)
	 )

plotshape(
	 hiddenBearCond ? osc[lbR] : na,
	 offset=-lbR,
	 title="Hidden Bearish Label",
	 text=" H Bear ",
	 style=shape.labeldown,
	 location=location.absolute,
	 color=bearColor,
	 textcolor=textColor
	 )

// alertcondition(bullCondAlert, title='Regular Bullish CVD Divergence', message="Found a new Regular Bullish Divergence, `Pivot Lookback Right` number of bars to the left of the current bar")
// alertcondition(hiddenBullCondAlert, title='Hidden Bullish CVD Divergence', message='Found a new Hidden Bullish Divergence, `Pivot Lookback Right` number of bars to the left of the current bar')
// alertcondition(bearCondAlert, title='Regular Bearish CVD Divergence', message='Found a new Regular Bearish Divergence, `Pivot Lookback Right` number of bars to the left of the current bar')
// alertcondition(hiddenBearCondAlert, title='Hidden Bearisn CVD Divergence', message='Found a new Hidden Bearisn Divergence, `Pivot Lookback Right` number of bars to the left of the current bar')

le = bullCondAlert or hiddenBullCondAlert

se = bearCondAlert or hiddenBearCondAlert

ltp = se

stp = le

// Check if the entry conditions for a long position are met
if (le) //and (close > ema200)
    strategy.entry("Long", strategy.long, comment="EL")

 // Check if the entry conditions for a short position are met
if (se) //and (close < ema200)
    strategy.entry("Short", strategy.short, comment="ES")

// Close long position if exit condition is met
if (ltp) // or (close < ema200)
    strategy.close("Long", comment="XL")

    // Close short position if exit condition is met
if (stp) //or (close > ema200)
    strategy.close("Short", comment="XS")


// The Fixed Percent Stop Loss Code
// User Options to Change Inputs (%)
stopPer = input.float(5.0, title='Stop Loss %') / 100
takePer = input.float(10.0, title='Take Profit %') / 100

// Determine where you've entered and in what direction
longStop = strategy.position_avg_price * (1 - stopPer)
shortStop = strategy.position_avg_price * (1 + stopPer)
shortTake = strategy.position_avg_price * (1 - takePer)
longTake = strategy.position_avg_price * (1 + takePer)

if strategy.position_size > 0
    strategy.exit("Close Long", "Long", stop=longStop, limit=longTake)
if strategy.position_size < 0
    strategy.exit("Close Short", "Short", stop=shortStop, limit=shortTake)