ویکٹر کینڈل سٹک چارٹ پر مبنی چینل بریک آؤٹ اور اپنی مرضی کے مطابق ChoCH حکمت عملی

جائزہ
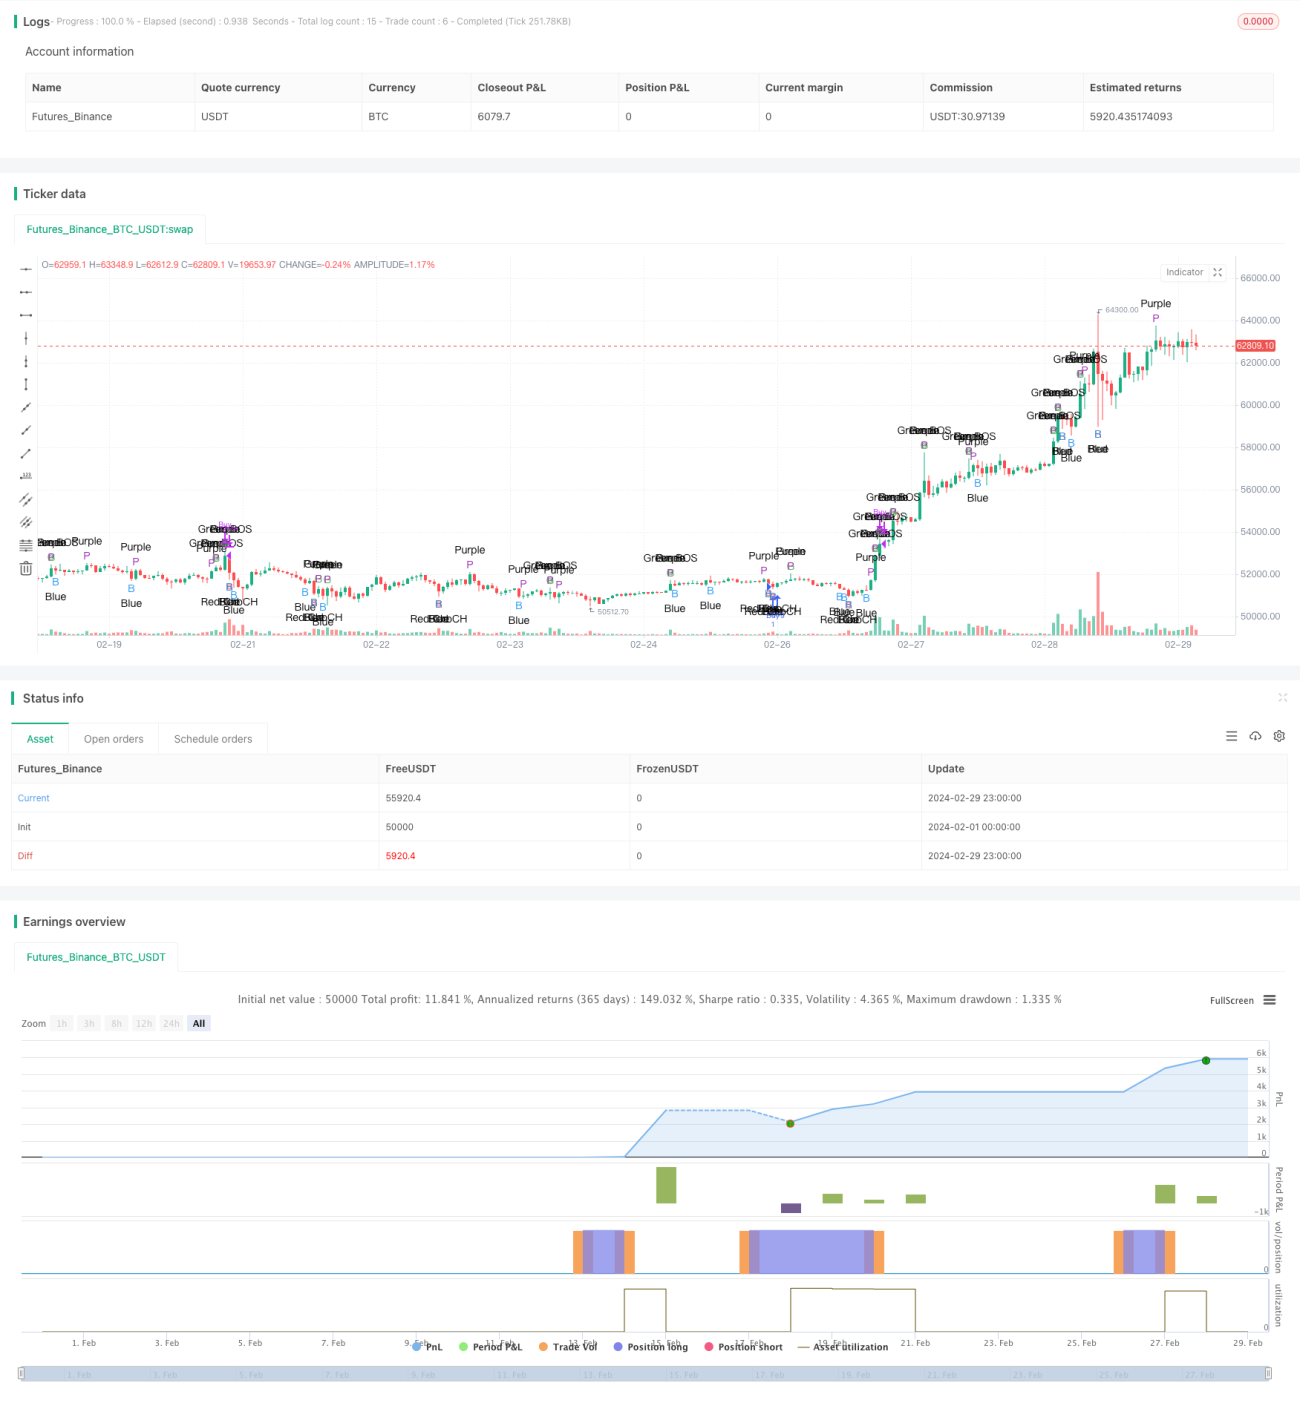
اس حکمت عملی میں ویکٹر موم بتیوں کے تصور کو روایتی چینل بریک آؤٹ اور چاکلیٹ چٹنی کے نمونوں کی شناخت کے ساتھ ملایا گیا ہے۔ اس حکمت عملی کا مقصد مارکیٹ میں ہونے والی بریکنگ حرکتوں کو پکڑنا ہے۔ حکمت عملی نے پہلے کی K لائن کی اونچائی اور نچلی قیمتوں کا موازنہ کرتے ہوئے ، اور حجم میں اضافے والے ویکٹر موم بتیوں کو جوڑ کر سگنل کی تصدیق کی ، جبکہ شور کو فلٹر کرنے کے لئے ایک خاص تعداد میں تصدیق شدہ K لائنوں کا استعمال کیا۔
حکمت عملی کا اصول
- ماضی میں ایک خاص تعداد میں K لائنوں کی اوسط ٹرانسمیشن کا حساب لگائیں ، اور ٹرانسمیشن کی مقدار کے مطابق ضرب کو بڑھا دیں چار مختلف رنگوں (سرخ ، سبز ، نیلے ، جامنی) کے ویکٹر گراف کی وضاحت کریں۔
- جب بند ہونے والی قیمت پچھلے K لائن کم سے کم ہوتی ہے اور سرخ ویکٹر فلٹر ہوتی ہے تو ، اس کی نشاندہی سرخ ChoCH سگنل کے طور پر کی جاتی ہے۔ جب بند ہونے والی قیمت پچھلے K لائن اونچائی سے زیادہ ہوتی ہے اور سبز ویکٹر فلٹر ہوتی ہے تو ، اس کی نشاندہی سبز BOS سگنل کے طور پر کی جاتی ہے۔
- ایک مخصوص تعداد میں تصدیق شدہ K لائنوں کے اندر ، اگر سرخ ویکٹر فلٹرنگ کی تعداد مقررہ حد تک پہنچ جاتی ہے تو ، سرخ ChoCH سگنل کی تصدیق کی جاتی ہے۔ اگر سبز ویکٹر فلٹرنگ کی تعداد مقررہ حد تک پہنچ جاتی ہے تو ، سبز BOS سگنل کی تصدیق کی جاتی ہے۔
- جب سرخ چوچ سگنل کی تصدیق ہوتی ہے تو زیادہ پوزیشن کھولی جائے اور جب سبز بوس سگنل کی تصدیق ہوتی ہے تو پوزیشن خالی کردی جائے۔
اسٹریٹجک فوائد
- ویکٹر فلٹرنگ کو روایتی چینل توڑنے اور ChoCH موڈ کے ساتھ مل کر سگنل کی وشوسنییتا میں اضافہ ہوا ہے۔
- تصدیق شدہ K لائن میکانزم متعارف کرایا گیا ہے، جو شور اور جعلی سگنل کو مؤثر طریقے سے فلٹر کرتا ہے۔
- ویکٹر فلٹرنگ کے رنگوں میں فرق کے ذریعے سگنل کو زیادہ بدیہی اور آسانی سے پہچاننے کے قابل بنایا گیا ہے۔
- پیرامیٹرز سایڈست ہیں ، زیادہ لچکدار ہیں ، مختلف مارکیٹ کے حالات اور تجارتی طرز کے مطابق بہتر بنایا جاسکتا ہے۔
اسٹریٹجک رسک
- ہنگامہ خیز مارکیٹوں میں ، بار بار توڑنے اور پیچھے ہٹنے سے حکمت عملی میں زیادہ سے زیادہ غلط سگنل اور نقصان دہ تجارت پیدا ہوسکتی ہے۔
- تصدیق K لائن کی تعداد کی غلط ترتیب سے سگنل میں تاخیر یا قبل از وقت داخلے کا سبب بن سکتا ہے۔
- صرف تکنیکی اشارے پر انحصار کرنے اور بنیادی عوامل کو نظرانداز کرنے سے غیر متوقع خطرات لاحق ہوسکتے ہیں۔
- اس حکمت عملی میں کوئی اسٹاپ نقصان نہیں ہے ، اور اگر مارکیٹ میں تیزی سے الٹ پڑتا ہے تو اس سے زیادہ نقصان ہوسکتا ہے۔
حکمت عملی کی اصلاح کی سمت
- رجحان کی تصدیق کے اشارے متعارف کروائیں ، جیسے چلتی اوسط ، ایک بریک سگنل کے بعد رجحان کی سمت کی تصدیق کریں ، سگنل کے معیار کو بہتر بنائیں۔
- زلزلے کی منڈیوں کے لئے ، اسپیڈ ٹریڈنگ کی حکمت عملی متعارف کرانے پر غور کیا جاسکتا ہے ، جیسے کوریج کے اندر زیادہ اور کم کرنے کے لئے ٹرگر شرائط۔
- K لائنوں کی تعداد کو بہتر بنانے کی تصدیق کریں ، مناسب توازن پوائنٹس تلاش کریں ، شور کو موثر انداز میں فلٹر کریں ، لیکن زیادہ تاخیر نہ کریں۔
- معقول اسٹاپ اور اسٹاپ رولز کا تعین کریں ، انفرادی تجارت کے خطرے اور مجموعی طور پر واپسی پر قابو پالیں۔
- دوسرے تکنیکی اشارے یا مارکیٹ کے جذبات کے اشارے کے ساتھ مل کر ، زیادہ تجارتی فیصلے کی بنیاد فراہم کریں۔
خلاصہ کریں۔
اس حکمت عملی میں ویکٹر فلٹرنگ کو کلاسیکی چینل بریک اور چوچ ماڈل کے ساتھ ملایا گیا ہے ، جس سے رنگ کے فرق اور تصدیق کے لائن میکانزم کے ذریعہ سگنل کی وشوسنییتا اور شناخت میں اضافہ ہوتا ہے۔ حکمت عملی کی خوبی یہ ہے کہ قواعد واضح ہیں ، سگنل بدیہی ہیں ، لیکن اس میں کچھ لچک اور اصلاح کی گنجائش ہے۔ تاہم ، اس حکمت عملی میں کچھ حدود اور خطرات بھی موجود ہیں ، جیسے چونکانے والی مارکیٹ میں ناقص کارکردگی ، مارکیٹ کے رجحانات کی ناکافی گرفت ، اور نقصانات کو روکنے کے انتظام کی کمی۔ مستقبل میں ، اس حکمت عملی کو رجحانات کی شناخت ، حد کی تجارت ، پیرامیٹرز کی اصلاح ، اور خطرے پر قابو پانے کے لئے بہتر اور مستحکم تجارتی کارکردگی حاصل کرنے کے لئے استعمال کیا جاسکتا ہے۔
- 1