نظر ثانی شدہ رشتہ دار طاقت انڈیکس رجحان کے بعد حکمت عملی
جائزہ
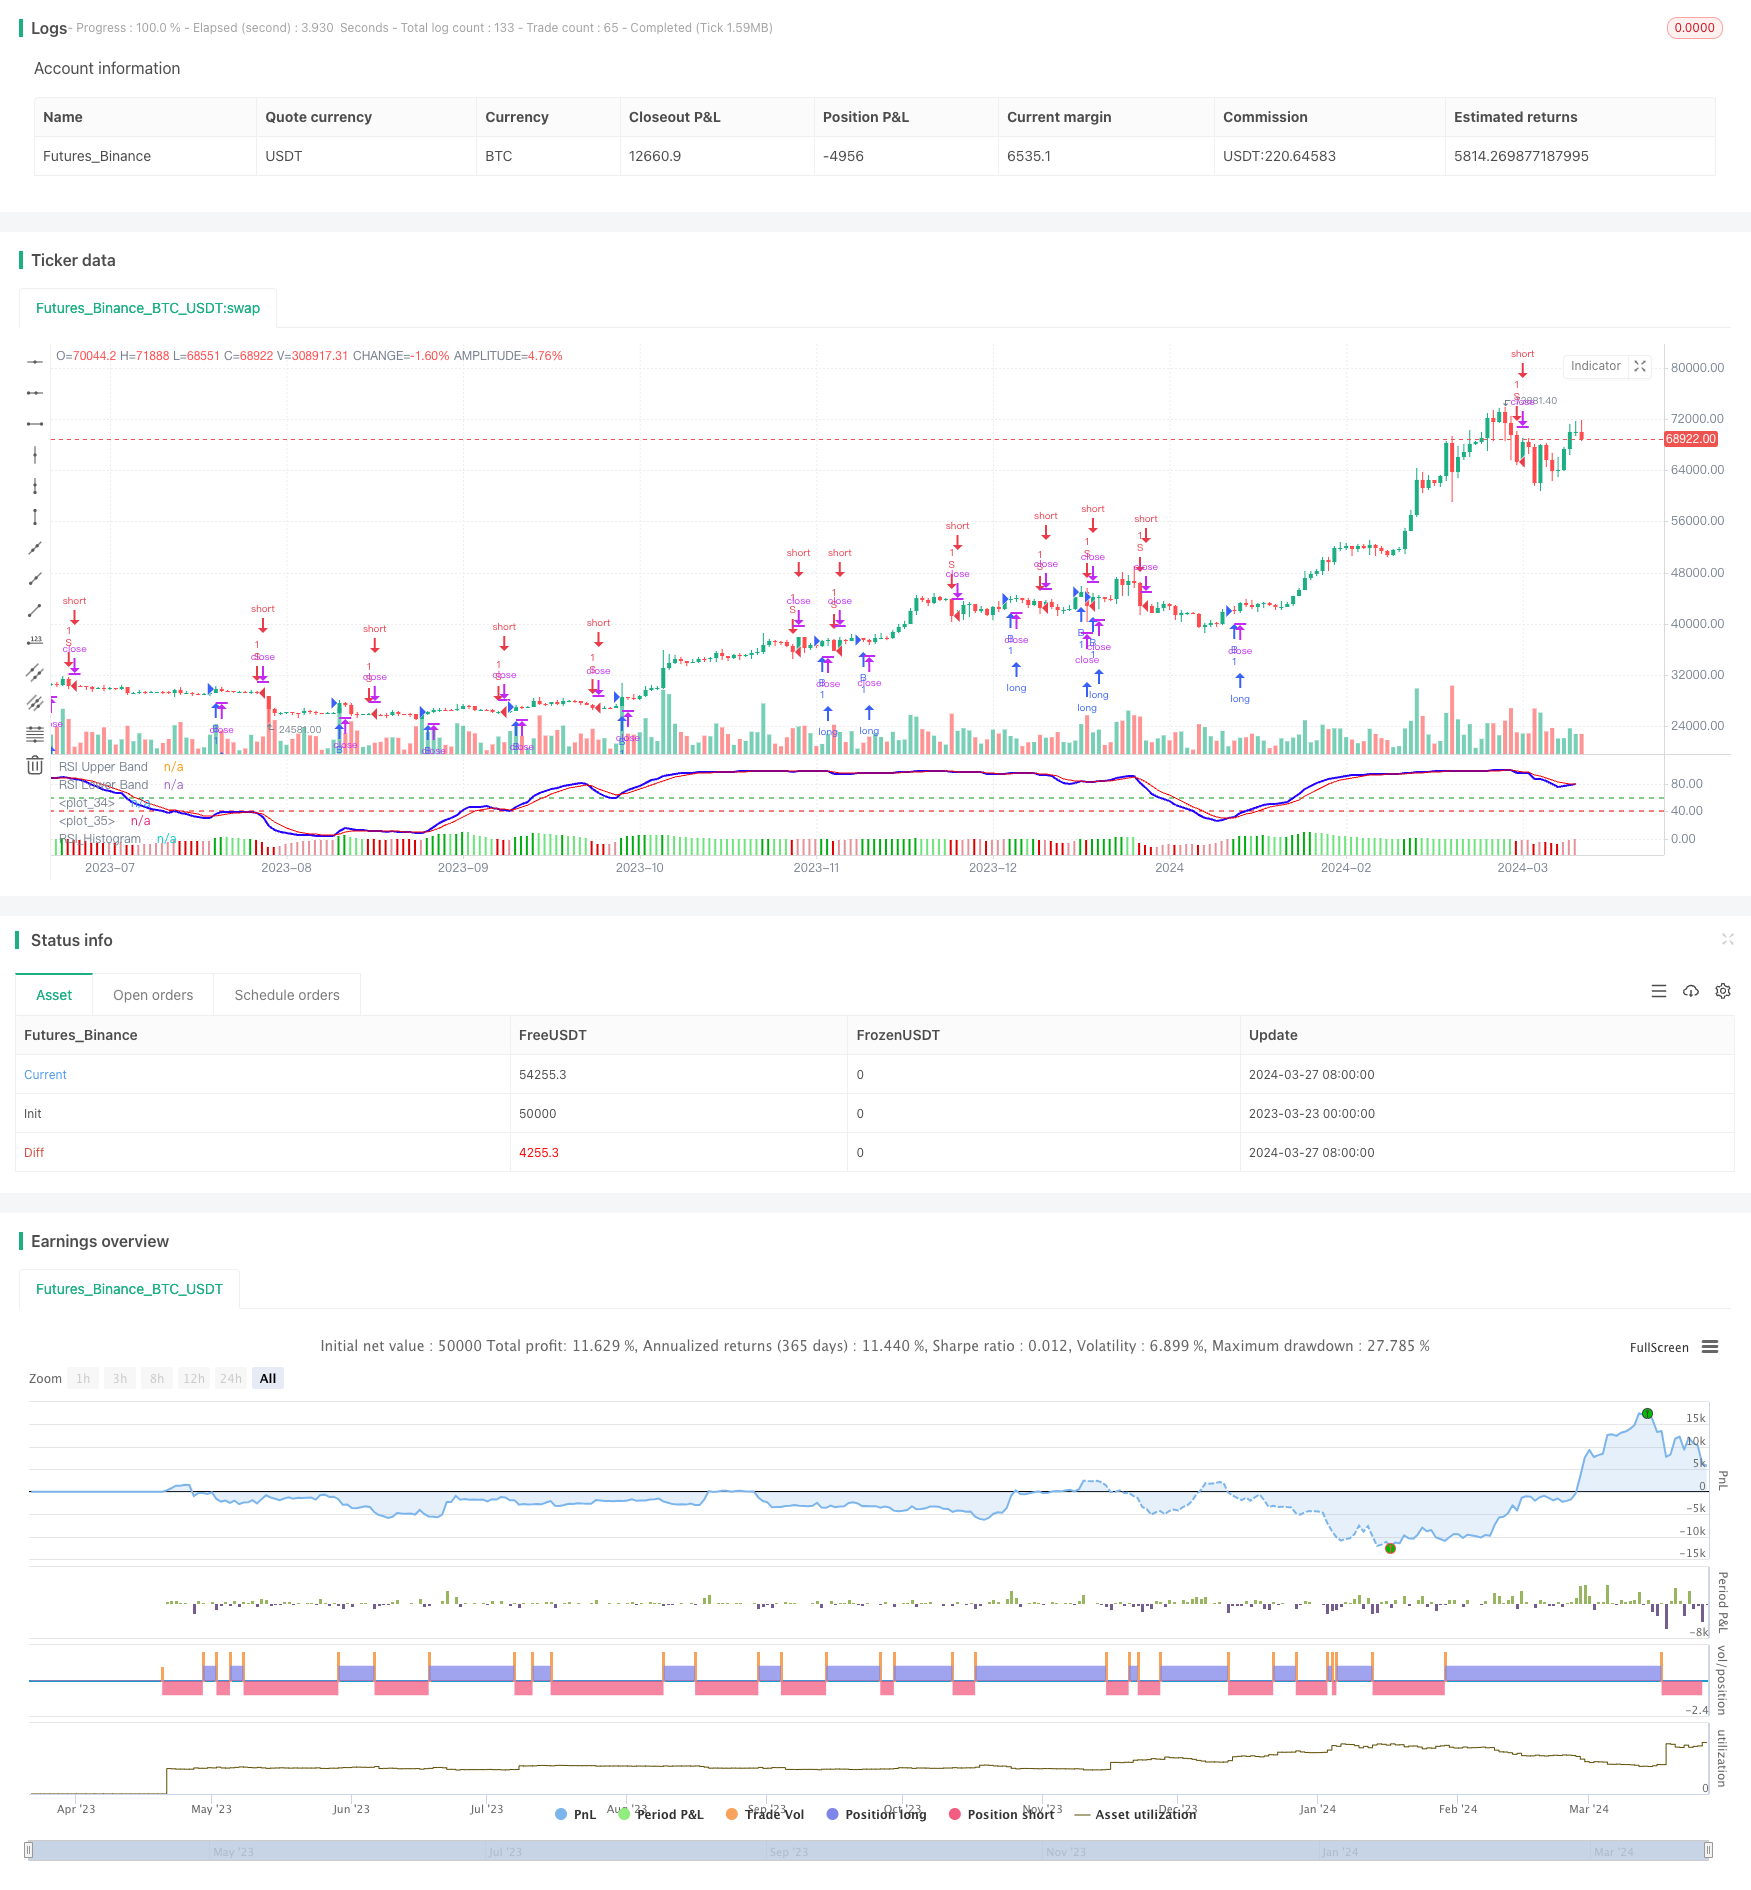
یہ حکمت عملی مارکیٹ کے رجحانات کو پکڑنے کے لئے ترمیم شدہ نسبتا strong مضبوط اشارے پر مبنی ہے۔ حکمت عملی کا بنیادی خیال مارکیٹ کے رجحانات کا فیصلہ کرنے کے لئے ترمیم شدہ RSI اشارے کے کراس سگنل اور سیدھے چارٹ سگنل کا استعمال کرنا ہے اور رجحان کی سمت کے مطابق تجارت کرنا ہے۔
حکمت عملی کا اصول
- قیمتوں کے EMAs کو Modified RSI کے ان پٹ کے طور پر شمار کرنا
- ترمیم شدہ RSI کا حساب لگائیں
- ایک سگنل لائن کے طور پر ترمیم شدہ RSI کے EMA کا حساب لگائیں
- ایک مستطیل کے طور پر ترمیم شدہ RSI اور سگنل لائن کے فرق کا حساب لگائیں
- جب Modified RSI پر سگنل لائن کو عبور کیا جاتا ہے اور سیدھے چارٹ 0 سے زیادہ ہوتے ہیں تو خریدنے کا اشارہ ہوتا ہے
- جب ترمیم شدہ RSI سگنل لائن کو عبور کرتا ہے اور اس کا سیدھا نقشہ 0 سے کم ہوتا ہے تو فروخت کا اشارہ ہوتا ہے
اسٹریٹجک فوائد
- ترمیم شدہ RSI اشارے روایتی RSI اشارے کے مقابلے میں رجحانات کو بہتر طور پر پکڑتا ہے
- Modified RSI کے کراس سگنل اور سیدھے چارٹ سگنل کے ساتھ مل کر ، جعلی سگنل کو مؤثر طریقے سے فلٹر کیا جاسکتا ہے
- مختلف مارکیٹوں اور ادوار کے لئے ایڈجسٹ کیا جا سکتا ہے
- سادہ اور کمپیوٹرائزڈ
اسٹریٹجک رسک
- ترمیم شدہ آر ایس آئی اشارے مارکیٹ میں ہلچل کے دوران غلط سگنل پیدا کرنے کا خطرہ ہے
- ٹرینڈ ٹرننگ پوائنٹس کی گرفت میں تاخیر کا امکان
- قیمتوں کے شور کی وجہ سے ایک ہی اشارے میں خلل پڑ سکتا ہے
حکمت عملی کی اصلاح کی سمت
- سگنل کی وشوسنییتا کو بہتر بنانے کے لئے دیگر رجحانات کے اشارے جیسے کہ منتقل اوسط کے ساتھ مل کر استعمال کیا جا سکتا ہے
- اسٹاپ نقصان روکنے والے ماڈیول کو شامل کیا جاسکتا ہے تاکہ ایک ہی تجارت کے خطرے کو کنٹرول کیا جاسکے
- مختلف مارکیٹ کی خصوصیات کے مطابق پیرامیٹرز کو بہتر بنایا جا سکتا ہے
- پوزیشن مینجمنٹ ماڈیول میں شامل ہونے کے لئے پوزیشنوں کو متحرک طور پر ایڈجسٹ کریں
خلاصہ کریں۔
اس حکمت عملی میں ترمیم شدہ آر ایس آئی اشارے کی خصوصیات کا استعمال کیا گیا ہے ، جس میں ٹریڈنگ سسٹم کو رجحان سے باخبر رہنے کے نقطہ نظر سے بنایا گیا ہے۔ ترمیم شدہ آر ایس آئی اشارے روایتی آر ایس آئی اشارے کی کچھ خامیوں پر قابو پاتے ہیں ، جس میں رجحان کی گرفتاری کی نسبتا strong طاقت ہے۔ تاہم ، ایک ہی اشارے کی حکمت عملی میں اکثر حدود ہوتی ہیں ، جس میں دیگر تکنیکی ذرائع کے ساتھ مل کر بہتری کی ضرورت ہوتی ہے۔ حکمت عملی کے پیرامیٹرز کو بہتر بنانے ، سگنل کے ذرائع کو افزودہ کرنے ، وائلڈ کنٹرول ماڈیول شامل کرنے وغیرہ کے ذریعہ حکمت عملی کی استحکام اور منافع بخش صلاحیت کو مزید بہتر بنایا جاسکتا ہے۔
/*backtest
start: 2023-03-23 00:00:00
end: 2024-03-28 00:00:00
period: 1d
basePeriod: 1h
exchanges: [{"eid":"Futures_Binance","currency":"BTC_USDT"}]
*/

// This source code is subject to the terms of the Mozilla Public License 2.0 at https://mozilla.org/MPL/2.0/
// © YogirajDange

//@version=5


// Verical lines


// // Define the times
// t1 = timestamp(year, month, dayofmonth, 09, 15) // 9:15
// t2 = timestamp(year, month, dayofmonth, 11, 15) // 11:15
// t3 = timestamp(year, month, dayofmonth, 13, 15) // 1:15
// t4 = timestamp(year, month, dayofmonth, 15, 25) // 3:25

// // Check if the current bar is on the current day
// is_today = (year(time) == year(timenow)) and (month(time) == month(timenow)) and (dayofmonth(time) == dayofmonth(timenow))

// // Draw a vertical line at each time
// if is_today and (time == t1 or time == t2 or time == t3 or time == t4)
//     line.new(x1 = bar_index, y1 = low, x2 = bar_index, y2 = high, extend = extend.both, color=color.red, width = 1)

strategy('Modified RSI')
col_grow_above = input(#02ac11, "Above   Grow", group="Histogram", inline="Above")
col_fall_above = input(#6ee47d, "Fall", group="Histogram", inline="Above")
col_grow_below = input(#e5939b, "Below Grow", group="Histogram", inline="Below")
col_fall_below = input(#dd0000, "Fall", group="Histogram", inline="Below")
EMA_length = input.int(13, 'Price_EMA', minval=1)
RSI_length = input.int(14, 'RSI_Period', minval=1)
Avg_length = input.int(5, 'RSI_Avg_EMA', minval=1)
fastMA = ta.ema(close, EMA_length)
modrsi = ta.rsi(fastMA, RSI_length)
RSIAVG = ta.ema(modrsi, Avg_length)
plot(modrsi, color=color.rgb(38, 0, 255), linewidth=2)
plot(RSIAVG, color=color.rgb(247, 0, 0))
rsiUpperBand = hline(60, 'RSI Upper Band', color=#099b0e)
//hline(50, "RSI Middle Band", color=color.new(#787B86, 50))
rsiLowerBand = hline(40, 'RSI Lower Band', color=#e90101)

RSI_hist = modrsi - RSIAVG

//plot(RSI_hist,"RSI_Histogram", color = #c201e9, style = plot.style_columns,linewidth= 5)

plot(RSI_hist, title="RSI_Histogram", style=plot.style_columns, color=(RSI_hist>=0 ? (RSI_hist[1] < RSI_hist ? col_grow_above : col_fall_above) : (RSI_hist[1] < RSI_hist ? col_grow_below : col_fall_below)))


/////// Moving Averages 20 50 EMA

fast_ma = input.int(20, minval=2, title="Fast_EMA")
slow_ma = input.int(50, minval=2, title="Slow_EMA")

src = input.source(close, title="Source")

out = ta.ema(src, fast_ma)
out1 = ta.ema(src, slow_ma)

//plot(out, title="20 EMA", color=color.rgb(117, 71, 247), linewidth = 2)
//plot(out1, title="50 EMA", color=color.rgb(0, 0, 0), linewidth = 2)


longCondition = ((ta.crossover(modrsi, RSIAVG)) and (RSI_hist > 0))
if longCondition
    strategy.entry('B', strategy.long)

shortCondition = ((ta.crossunder(modrsi, RSIAVG)) and (RSI_hist < 0))
if shortCondition
    strategy.entry('S', strategy.short)