RSI اور بولنگر بینڈز کی دوہری حکمت عملی

جائزہ
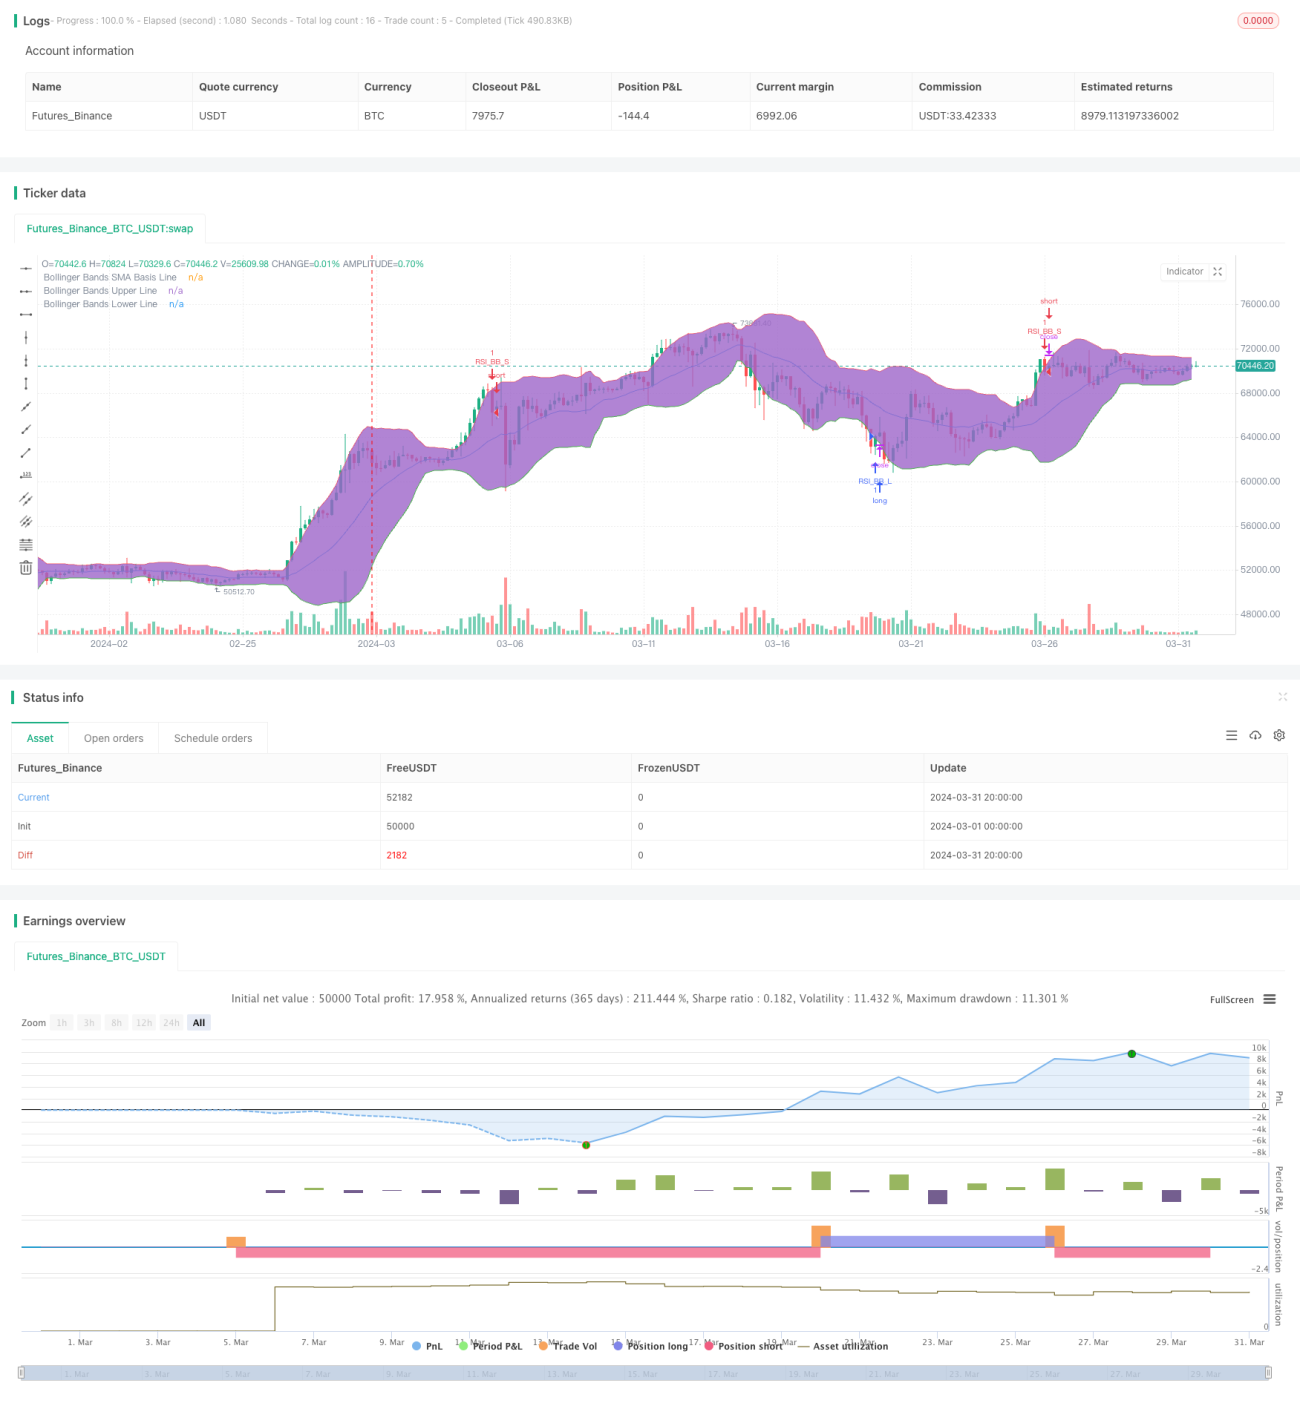
اس حکمت عملی میں دو تکنیکی اشارے ، نسبتا strong مضبوط اشاریہ ((RSI) اور بولنگر بینڈ ((Bollinger Bands) کو شامل کیا گیا ہے ، جس سے خریدنے کا اشارہ ہوتا ہے جب قیمت بولن بینڈ سے نیچے ہوتی ہے ، اور فروخت کا اشارہ ہوتا ہے جب قیمت بولن بینڈ سے اوپر ہوتی ہے۔ یہ حکمت عملی صرف اس صورت میں تجارت کا اشارہ کرتی ہے جب RSI اور بولن بینڈ اشارے بیک وقت اوور سیل یا اوور خرید کی حالت میں ہوں۔
حکمت عملی کا اصول
- آر ایس آئی کی قیمتوں کا حساب لگائیں۔
- برن بینڈ فارمولے کا استعمال کرتے ہوئے برن بینڈ کے وسط ، اوپری اور نچلے ریلوں کا حساب لگائیں۔
- اس بات کا تعین کریں کہ آیا موجودہ بندش کی قیمتوں نے برن کی پٹی کو ٹریک کیا ہے یا نہیں.
- اس بات کا تعین کریں کہ آیا موجودہ RSI حد سے زیادہ ہے یا حد سے کم ہے۔
- جب بلین بینڈ اور آر ایس آئی دونوں خرید و فروخت کے شرائط پر پورا اترتے ہیں تو ، اسی طرح کا تجارتی سگنل پیدا ہوتا ہے۔
اسٹریٹجک فوائد
- رجحانات اور متحرک دونوں تکنیکی اشارے کو ملا کر ، مارکیٹ کی حالت کا زیادہ جامع اندازہ لگایا جاسکتا ہے۔
- ایک ہی وقت میں دو اشارے فلٹرنگ کی شرائط کے طور پر استعمال کرتے ہیں، مؤثر طریقے سے جھوٹے سگنل کے امکانات کو کم کر دیا گیا ہے.
- واضح کوڈ منطق ، پیرامیٹرز کی لچکدار ترتیب ، مختلف مارکیٹ کے ماحول اور ٹریڈنگ کے انداز کے لئے موزوں ہے۔
اسٹریٹجک رسک
- اس حکمت عملی کے نتیجے میں ہلکے بازاروں میں زیادہ نقصان دہ تجارت ہوسکتی ہے۔
- پیرامیٹرز کی غلط ترتیب سے حکمت عملی کی خراب کارکردگی کا سبب بن سکتا ہے ، جس کو عملی حالات کے مطابق بہتر بنانے کی ضرورت ہے۔
- اس حکمت عملی میں کوئی روک تھام نہیں ہے اور اس میں واپسی کا زیادہ خطرہ ہوسکتا ہے۔
حکمت عملی کی اصلاح کی سمت
- مارکیٹ کی خصوصیات اور ذاتی ترجیحات کے مطابق آر ایس آئی اور برن بینڈ کے پیرامیٹرز کو بہتر بنایا جاسکتا ہے۔
- سگنل کی وشوسنییتا کو بہتر بنانے کے لئے دیگر تکنیکی اشارے جیسے MACD ، اوسط وغیرہ متعارف کروائے گئے۔
- معقول اسٹاپ اور اسٹاپ سیٹ کریں اور ایک ہی تجارت کے خطرے پر قابو پالیں۔
- ہلچل والے بازاروں کے لئے ، آپ فیصلہ کرنے کی شرائط کو بڑھانے یا پوزیشنوں کو کم کرنے پر غور کرسکتے ہیں ، جس سے بار بار تجارت کی لاگت کو کم کیا جاسکتا ہے۔
خلاصہ کریں۔
آر ایس آئی اور برین بینڈ کی دوہری حکمت عملی ، رجحان اور حرکیات کے اشارے کے امتزاج کے ذریعہ ، مارکیٹ کی حالت کا جامع اندازہ لگانے اور اسی کے مطابق تجارتی سگنل دینے کے قابل ہے۔ تاہم ، یہ حکمت عملی اتار چڑھاؤ والے بازار میں ناقص کارکردگی کا مظاہرہ کرسکتی ہے ، اور اس میں خطرے کے کنٹرول کے اقدامات کا تعین نہیں کیا گیا ہے ، لہذا اس کا استعمال کرتے وقت محتاط رہنے کی ضرورت ہے۔ پیرامیٹرز کو بہتر بنانے ، دوسرے اشارے متعارف کرانے اور معقول اسٹاپ نقصان کی حد قائم کرنے جیسے طریقوں سے ، اس حکمت عملی کی استحکام اور منافع بخش صلاحیت کو مزید بہتر بنایا جاسکتا ہے۔
/*backtest
start: 2024-03-01 00:00:00
end: 2024-03-31 23:59:59
period: 4h
basePeriod: 15m
exchanges: [{"eid":"Futures_Binance","currency":"BTC_USDT"}]
*/

//@version=4
strategy("Bollinger + RSI, Double Strategy (by ChartArt) v1.1", shorttitle="CA_-_RSI_Bol_Strat_1.1", overlay=true)

// ChartArt's RSI + Bollinger Bands, Double Strategy - Update- 1