MACD کراس اوور حکمت عملی

جائزہ
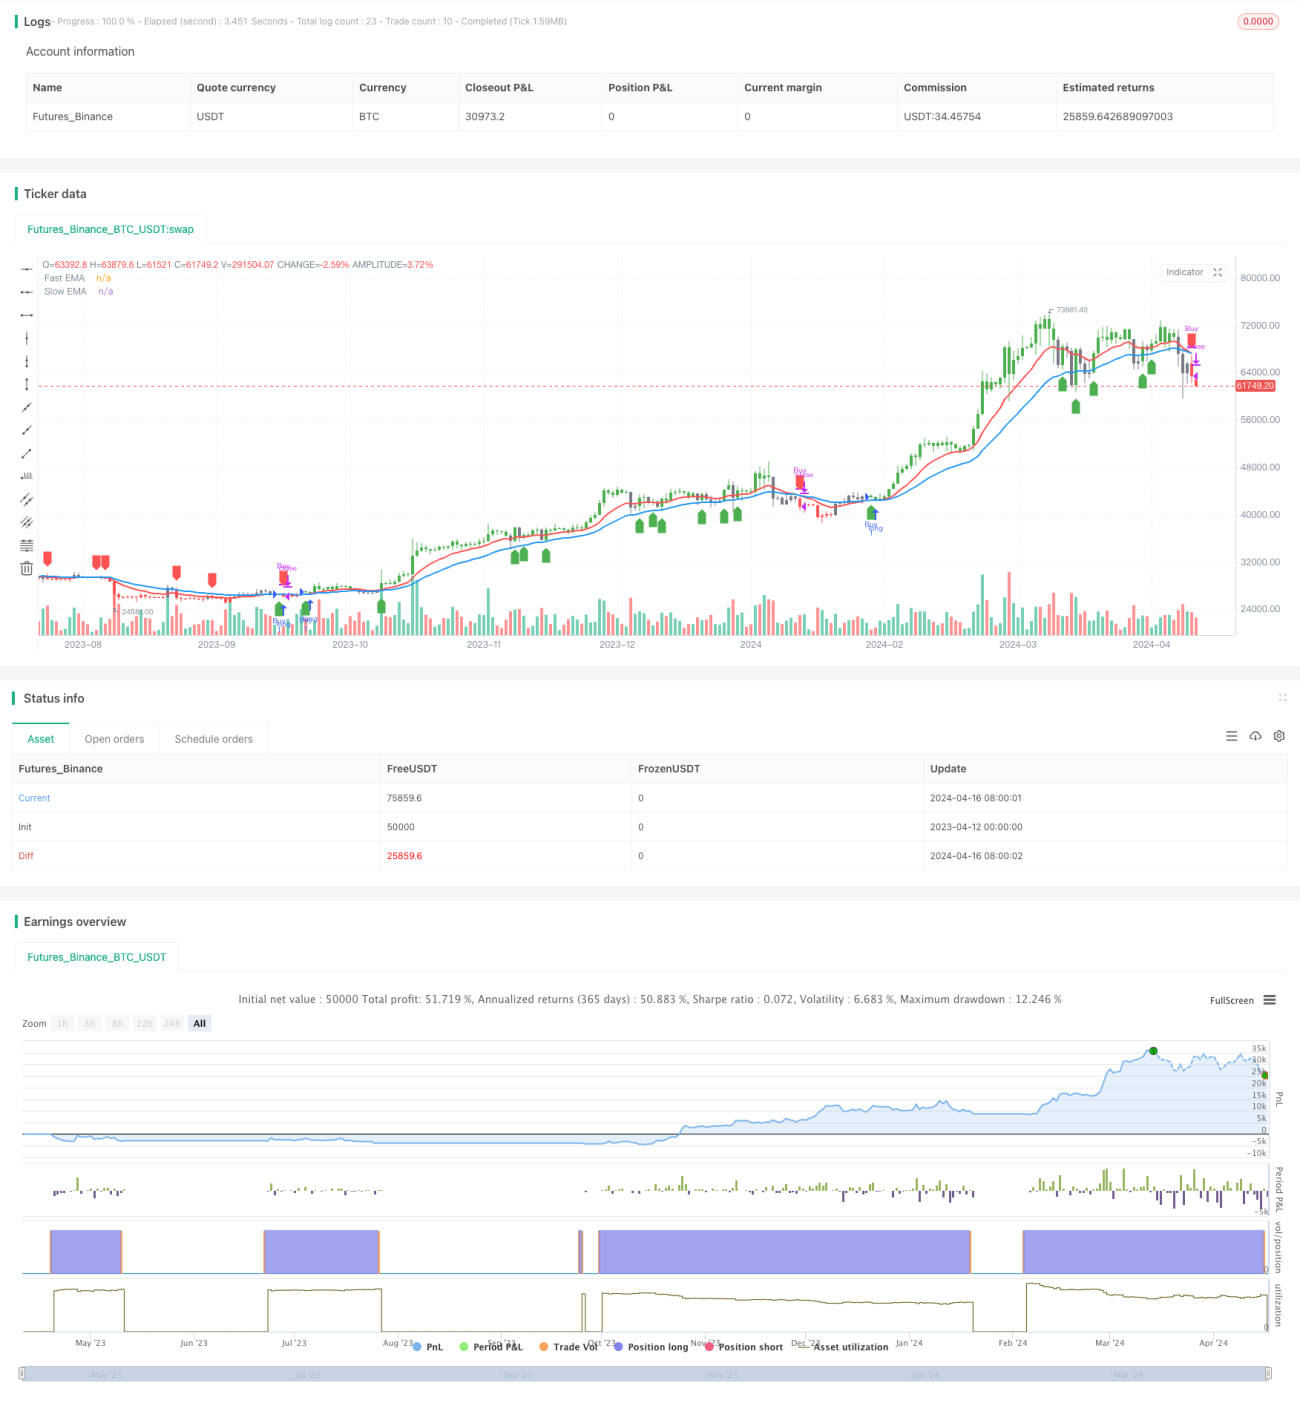
یہ حکمت عملی دو مختلف ادوار کی اشاریہ منتقل اوسط ((ای ایم اے) کا استعمال کرتی ہے جس میں ایک خرید کا اشارہ ہوتا ہے جب تیز ای ایم اے نیچے سے اوپر کی طرف سے سست ای ایم اے کو عبور کرتا ہے اور ایک فروخت کا اشارہ ہوتا ہے جب تیز ای ایم اے اوپر سے نیچے کی طرف سے سست ای ایم اے کو عبور کرتا ہے۔ اس حکمت عملی کو مختلف مالیاتی آلات اور وقت کے دورانیوں پر لاگو کیا جاسکتا ہے ، مثال کے طور پر سونے 2 گھنٹے کے دورانیے پر سب سے زیادہ موثر ہے ، بٹ کوائن سورج کی لکیر کے چارٹ پر سب سے زیادہ موثر ہے۔
حکمت عملی کا اصول
- ایک تیز رفتار EMA (ڈیفالٹ سائیکل 12) اور ایک سست رفتار EMA (ڈیفالٹ سائیکل 26) کا حساب لگائیں۔
- ایک کثیر سر علاقہ کی وضاحت کریں ((فاسٹ ای ایم اے سست ای ایم اے کے اوپر ہے اور قیمت تیز رفتار ای ایم اے کے اوپر ہے) اور ایک خالی سر علاقہ ((فاسٹ ای ایم اے سست ای ایم اے کے نیچے ہے اور قیمت تیز رفتار ای ایم اے کے نیچے ہے)) ۔
- جب خالی سر والے علاقے سے کثیر سر والے علاقے میں تبدیل کرتے وقت خریدتے ہیں، جب کثیر سر والے علاقے سے خالی سر والے علاقے میں تبدیل کرتے وقت بیچتے ہیں۔
- چارٹ پر سبز اور سرخ رنگ کے ساتھ کثیر سر والے علاقوں اور خالی سر والے علاقوں کو نشان زد کریں اور تیر کے ساتھ خرید و فروخت کے سگنل کو نشان زد کریں۔
اسٹریٹجک فوائد
- آسان اور سمجھنے میں آسان، ابتدائی سیکھنے کے لئے موزوں۔
- اس کے علاوہ، یہ ایک وسیع پیمانے پر قابل اطلاق ہے، مختلف مالیاتی آلات اور وقت کی مدت کے لئے استعمال کیا جا سکتا.
- ٹرینڈ ٹریک کرنے کی صلاحیت، درمیانی اور طویل مدتی رجحانات کو پکڑنے کے قابل۔
- پیرامیٹرز کو ایڈجسٹ کیا جا سکتا ہے، زیادہ لچکدار.
اسٹریٹجک رسک
- ٹریفک کے بحران میں غلط سگنل کی وجہ سے نقصانات کا سامنا کرنا پڑتا ہے۔
- رجحانات میں تبدیلی کے وقت رد عمل سست ہوتا ہے ، جس کی وجہ سے کچھ سلائڈ پوائنٹس پیدا ہوسکتے ہیں۔
- پیرامیٹرز کا غلط انتخاب حکمت عملی کے اثر کو متاثر کرتا ہے۔
حکمت عملی کی اصلاح کی سمت
- رجحان فلٹر شامل کریں ، جیسے کہ صرف تب ہی تجارت کریں جب ADX کسی قدر سے زیادہ ہو ، اور اس طرح ہلکے بازاروں میں نقصان کو کم کریں۔
- آؤٹ پٹ کے وقت کو بہتر بنائیں ، جیسے اے ٹی آر کا استعمال کرتے ہوئے اسٹاپ نقصان کا فیصلہ کریں ، اور انفرادی نقصانات کو کم کریں۔
- پیرامیٹرز کو بہتر بنانے کے لئے ، استحکام اور منافع بخش بنانے کے لئے بہترین پیرامیٹرز کا مجموعہ تلاش کریں۔
- دیگر اشارے معاون فیصلے کے ساتھ مل کر ، جیسے MACD ، RSI وغیرہ ، سگنل کی درستگی کو بہتر بنائیں۔
خلاصہ کریں۔
ایم اے سی ڈی کراسنگ حکمت عملی ایک سادہ حکمت عملی ہے جو رجحان کی پیروی پر مبنی ہے۔ اس کی خوبی یہ ہے کہ یہ آسان ، عملی اور وسیع پیمانے پر قابل اطلاق ہے۔ اس کی خرابی یہ ہے کہ رجحان کی تبدیلی کو سمجھنا مشکل ہے ، پیرامیٹرز کا انتخاب مشکل ہے۔ اس حکمت عملی کی کارکردگی کو رجحان فلٹرنگ ، آؤٹ پٹ کو بہتر بنانے ، پیرامیٹرز کا انتخاب اور دیگر اشارے کے مجموعے کے ذریعہ بہتر بنایا جاسکتا ہے ، جو مزید تحقیق اور جانچ کے قابل ہے۔
/*backtest
start: 2023-04-12 00:00:00
end: 2024-04-17 00:00:00
period: 1d
basePeriod: 1h
exchanges: [{"eid":"Futures_Binance","currency":"BTC_USDT"}]
*/

//@version=5
strategy('Advance EMA Crossover Strategy', overlay=true, precision=6)
//****************************************************************************//
// CDC Action Zone is based on a simple EMA crossover - 1