موونگ ایوریج کراس اوور ملٹی لیئر منافع کی حکمت عملی

جائزہ
اس حکمت عملی میں مارکیٹ کے رجحانات کا اندازہ لگانے کے لئے دو حرکت پذیر اوسطوں کے کراس کا استعمال کیا جاتا ہے ، اور جب قلیل مدتی حرکت پذیر اوسط پر طویل مدتی حرکت پذیر اوسط ہوتا ہے تو زیادہ پوزیشنیں کھولی جاتی ہیں ، اور اس کے برعکس خالی پوزیشنیں کھولی جاتی ہیں۔ اس کے علاوہ ، اس حکمت عملی میں کثیر درجے کا فائدہ اٹھانے کا طریقہ استعمال کیا جاتا ہے ، جب قیمت منافع کی مطلوبہ سطح تک پہنچ جاتی ہے تو ، اس کی جگہ پر صفائی کی جاتی ہے ، جس سے منافع کو زیادہ سے زیادہ کیا جاسکتا ہے اور خطرے پر قابو پایا جاسکتا ہے۔
حکمت عملی کا اصول
اس حکمت عملی کا بنیادی مقصد مارکیٹ کے رجحانات کو پکڑنے کے لئے مختلف ادوار کی متحرک اوسطوں کا استعمال کرنا ہے۔ جب قلیل مدتی متحرک اوسط پر طویل مدتی متحرک اوسط سے تجاوز کرنا ہوتا ہے تو اس کا مطلب ہے کہ مارکیٹ میں اضافے کا رجحان ہوسکتا ہے ، اس وقت زیادہ پوزیشنیں کھولی جاتی ہیں۔ جب قلیل مدتی متحرک اوسط کے نیچے طویل مدتی متحرک اوسط سے تجاوز کرنا ہوتا ہے تو اس کا مطلب ہے کہ مارکیٹ میں کمی کا رجحان ہوسکتا ہے ، اس وقت خالی پوزیشنیں کھولی جاتی ہیں۔
اسٹریٹجک فوائد
- سادہ اور موثر: یہ حکمت عملی کلاسیکی اوسطا اوسطا اوسطا اوسطا اوسطا اوسطا اوسطا اوسطا اوسطا اوسطا اوسطا اوسطا اوسطا اوسطا اوسطا اوسطا اوسطا اوسطا اوسطا اوسطا اوسطا اوسطا اوسطا اوسطا اوسطا اوسطا اوسطا اوسطا اوسطا اوسطا اوسطا اوسطا اوسطا اوسطا اوسطا اوسطا اوسطا اوسطا اوسطا اوسطا اوسطا
- ایک سے زیادہ منافع کا خاتمہ: منافع کی ایک سے زیادہ سطحیں ترتیب دے کر اور جب قیمت ان سطحوں تک پہنچ جاتی ہے تو بیچوں میں صفائی کرکے ، منافع کو زیادہ سے زیادہ کیا جاسکتا ہے ، جبکہ خطرے پر بھی قابو پایا جاسکتا ہے۔
- پیرامیٹرز میں لچک: اس حکمت عملی کے پیرامیٹرز کی ترتیب بہت لچکدار ہے ، صارف اپنی ضروریات اور مارکیٹ کی خصوصیات کے مطابق موزوں اثر کے ل moving اوسط اوسط کی مدت اور منافع کی سطح کو ایڈجسٹ کرسکتا ہے۔
اسٹریٹجک رسک
- مارکیٹ میں اتار چڑھاؤ کا خطرہ: جب مارکیٹ میں شدید اتار چڑھاؤ ہوتا ہے تو ، بار بار کراس سگنل حکمت عملی کو بار بار تجارت کا باعث بن سکتے ہیں ، جس سے تجارت کی لاگت اور واپسی کا خطرہ بڑھ جاتا ہے۔
- پیرامیٹرز کی ترتیب کا خطرہ: نامناسب پیرامیٹرز کی ترتیب سے حکمت عملی کی خراب کارکردگی کا سبب بن سکتا ہے ، جیسے کہ حرکت پذیر اوسط کی غلط مدت کا انتخاب ، یا منافع کی سطح کی غیر معقول ترتیب وغیرہ۔
- رجحانات کی شناخت کا خطرہ: یہ حکمت عملی بنیادی طور پر رجحانات پر منحصر ہے ، اور جب مارکیٹ میں ہلچل پڑتی ہے یا رجحانات واضح نہیں ہوتے ہیں تو ، غلط سگنل زیادہ ہوسکتے ہیں ، جس سے نقصان ہوتا ہے۔
حکمت عملی کی اصلاح کی سمت
- دوسرے اشارے کے ساتھ مل کر: رجحانات کی شناخت کی درستگی اور وشوسنییتا کو بہتر بنانے کے لئے دیگر تکنیکی اشارے جیسے RSI، MACD وغیرہ کے ساتھ مل کر غور کیا جاسکتا ہے۔
- آپٹمائزنگ پیرامیٹرز: مارکیٹ کے مختلف حالات کو اپنانے کے لئے بہترین اوسطا اوسطا اور منافع کی سطح کے پیرامیٹرز کو تلاش کرنے کے لئے بیک اپ اور اصلاح کے ذریعے تلاش کیا جاسکتا ہے۔
- اسٹاپ شامل کریں: خطرے کو مزید کنٹرول کرنے کے لئے اسٹاپ میکانزم شامل کرنے پر غور کیا جاسکتا ہے ، جیسے اے ٹی آر کی ترتیب کے مطابق متحرک اسٹاپ وغیرہ۔
- انٹری اور آؤٹ پٹ میں تبدیلی: حکمت عملی کی استحکام کو بہتر بنانے کے لئے ، زیادہ سے زیادہ انٹری اور آؤٹ پٹ شرائط جیسے تجارت کی مقدار ، سپورٹ مزاحمت اور دیگر عوامل کو مدنظر رکھتے ہوئے دریافت کیا جاسکتا ہے۔
خلاصہ کریں۔
متحرک اوسط کراس کثیر پرت منافع کی حکمت عملی ایک سادہ اور موثر رجحان کی پیروی کی حکمت عملی ہے ، جس میں متعدد سطحوں پر منافع کا خاتمہ کیا گیا ہے ، جس سے رجحان میں زیادہ منافع حاصل کیا جاسکتا ہے ، جبکہ خطرے پر قابو پایا جاسکتا ہے۔ تاہم ، اس حکمت عملی میں کچھ حدود اور خطرات بھی موجود ہیں ، جن کو مارکیٹ کی مخصوص صورتحال اور صارف کی ضروریات کے مطابق بہتر اور بہتر بنانے کی ضرورت ہے۔ مجموعی طور پر ، یہ حکمت عملی ایک موثر تجارتی آلہ کے طور پر کام کر سکتی ہے ، لیکن اس پر مکمل طور پر انحصار نہیں کیا جاسکتا ہے ، جس کو بہترین اثر کے ل other دوسرے تجزیاتی طریقوں اور خطرے کے انتظام کے اقدامات کے ساتھ مل کر استعمال کرنے کی ضرورت ہے۔
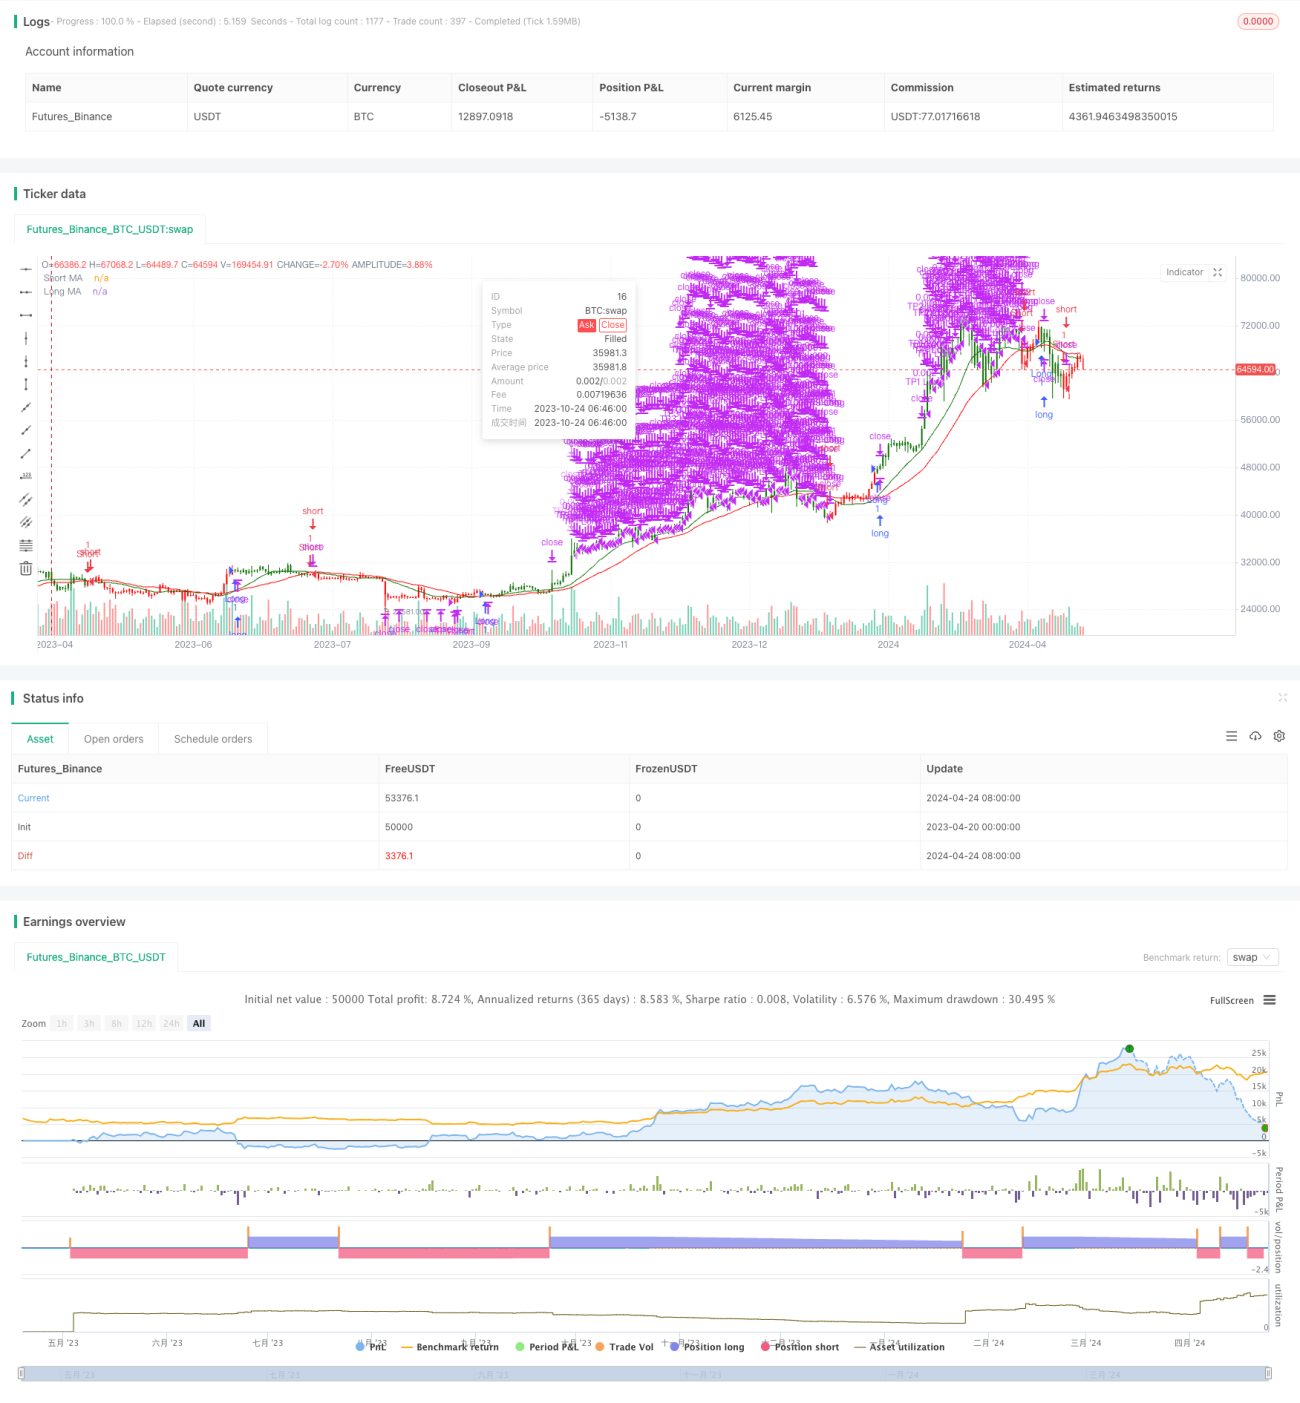
/*backtest
start: 2023-04-20 00:00:00
end: 2024-04-25 00:00:00
period: 1d
basePeriod: 1h
exchanges: [{"eid":"Futures_Binance","currency":"BTC_USDT"}]
*/

// This Pine Script™ code is subject to the terms of the Mozilla Public License 2.0 at https://mozilla.org/MPL/2.0/
// © ValdesTradingBots

//Follow Us for More Insights and Updates!- 1