والیوم ہیٹ میپس اور ریئل ٹائم قیمتوں پر مبنی حکمت عملی خریدیں اور بیچیں۔

جائزہ
یہ حکمت عملی خرید و فروخت کے سگنل پیدا کرنے کے لئے ٹرانزیکشن ہاٹ چارٹ اور ریئل ٹائم قیمتوں کو جوڑتی ہے ، جس میں قیمتوں اور ٹرانزیکشن حجم کی تقسیم کا تجزیہ کیا جاتا ہے۔ حکمت عملی پہلے موجودہ قیمت اور مقررہ قیمت کی حد کے فیصد کے مطابق قیمتوں کی سطح کا حساب لگاتی ہے۔ پھر ہر قیمت کی سطح پر پچھلے کچھ عرصے میں خرید و فروخت کے لین دین کا حساب لگایا جاتا ہے ، اور اس کے بعد مجموعی خرید و فروخت کے لین دین کا حساب لگایا جاتا ہے۔ مجموعی خرید و فروخت کے لین دین کی بنیاد پر ، لیبل کا رنگ طے کیا جاتا ہے۔ اس کے علاوہ ، حکمت عملی ایک حقیقی وقت کی قیمت کا منحنی خطوط بھی تیار کرتی ہے۔ اس کے علاوہ ، یہ حکمت عملی ای ایم اے ، وی ڈبلیو اے پی ، وغیرہ جیسے اشارے کو جوڑتی ہے ، جو قیمت کے حجم کے ساتھ ان کے تعلقات پر مبنی ہے ، خرید و فروخت کے سگنل پیدا کرتی ہے۔ جب خریداری کی شرائط پوری ہوجاتی ہیں اور اس سے پہلے کوئی سگنل پیدا نہیں ہوتا ہے تو خرید و فروخت کا سگنل پیدا ہوتا ہے۔
حکمت عملی کا اصول
- موجودہ قیمتوں اور مقررہ قیمتوں کے تناسب کے مطابق قیمتوں کے کئی درجے کا حساب لگایا گیا ہے۔
- ہر قیمت کی سطح پر ماضی میں خرید و فروخت کے لین دین کی مقدار کا حساب لگائیں اور مجموعی خرید و فروخت کے لین دین کی مقدار کا حساب لگائیں۔
- لیبل کا رنگ طے کریں اور لیبل دکھائیں یا اس کا گرافک بنائیں۔
- ریئل ٹائم قیمتوں کا منحنی خطوط۔
- ای ایم اے، وی ڈبلیو اے پی اور دیگر اشارے کا حساب لگائیں
- قیمت کے ای ایم اے ، وی ڈبلیو اے پی اور دیگر اشارے کے ساتھ تعلقات اور حجم کی شرائط کے مطابق ، خریداری کی شرائط کو پورا کرنے کا فیصلہ کریں۔ اگر یہ پورا ہو اور اس سے پہلے کوئی سگنل پیدا نہیں ہوا ہے تو ، خریداری کا سگنل پیدا کیا جائے گا۔
- قیمت اور ای ایم اے جیسے اشارے کے تعلقات اور حجم کی شرائط کے مطابق ، فیصلہ کریں کہ آیا فروخت کی شرائط پوری ہوئیں۔ اگر یہ پورا ہو اور اس سے پہلے کوئی سگنل پیدا نہ ہوا ہو تو ، فروخت کا سگنل پیدا ہوگا۔ اگر دو مسلسل سینیٹ لائنیں اور اس سے پہلے کوئی سگنل پیدا نہ ہوا ہو تو ، فروخت کا سگنل بھی پیدا ہوتا ہے۔
- موجودہ خرید و فروخت کے حالات کی حالت کو ریکارڈ کریں اور سگنل کی پیداوار کی حالت کو اپ ڈیٹ کریں۔
طاقت کا تجزیہ
- ٹرانزیکشن حجم کے ہاٹ چارٹ اور ریئل ٹائم قیمتوں کے ساتھ مل کر ، قیمتوں اور ٹرانزیکشن حجم کی تقسیم کو بصری طور پر ظاہر کرنے کے قابل ، جو تجارتی فیصلوں کے لئے حوالہ فراہم کرتا ہے۔
- ای ایم اے، وی ڈبلیو اے پی اور دیگر اشارے متعارف کروائے گئے ہیں، جس سے حکمت عملی کی شرائط و ضوابط میں اضافہ ہوا ہے اور حکمت عملی کی وشوسنییتا میں اضافہ ہوا ہے۔
- قیمت، اشارے اور حجم جیسے متعدد عوامل کو مدنظر رکھتے ہوئے ، خرید و فروخت کے سگنل کو زیادہ جامع اور مضبوط بنایا گیا ہے۔
- سگنل کی پیداوار کو محدود کرنے کی شرائط طے کی گئیں ، جس سے بار بار دہرائے جانے والے سگنل کی مسلسل پیداوار سے بچنے اور گمراہ کن سگنل کو کم کرنے کی اجازت دی گئی۔
خطرے کا تجزیہ
- حکمت عملی کی کارکردگی کو پیرامیٹرز کی ترتیبات جیسے قیمت کی حد فیصد ، واپسی کی مدت وغیرہ سے متاثر کیا جاسکتا ہے ، جس کو مخصوص حالات کے مطابق ایڈجسٹ اور بہتر بنانے کی ضرورت ہے۔
- ای ایم اے ، وی ڈبلیو اے پی اور دیگر اشارے خود میں بھی کچھ تاخیر اور حدود ہیں ، جو کچھ مارکیٹ کے حالات میں غیر موثر ہوسکتے ہیں۔
- اس حکمت عملی کا اطلاق زیادہ تر رجحان سازی والے بازاروں پر ہوتا ہے ، جہاں ہلچل والے بازاروں میں زیادہ جعلی سگنل پیدا ہوسکتے ہیں۔
- حکمت عملی کے خطرے کو کنٹرول کرنے کے اقدامات نسبتا simple آسان ہیں ، خطرے کے انتظام کے ذرائع جیسے اسٹاپ نقصان اور پوزیشن مینجمنٹ کی کمی ہے۔
اصلاح کی سمت
- مزید تکنیکی اشارے اور مارکیٹ کے جذبات کے اشارے جیسے RSI، MACD، اور برین بینڈ کو متعارف کرانے سے حکمت عملی کے فیصلے کے لئے ایک بہتر بنیاد پیدا ہوتی ہے۔
- خرید و فروخت کے سگنل کی پیداوار کے حالات کو بہتر بنانا ، سگنل کی درستگی اور وشوسنییتا کو بہتر بنانا۔ رجحان کی سمت کی تصدیق کے لئے متعدد ٹائم فریموں کا تجزیہ متعارف کرانے پر غور کیا جاسکتا ہے۔
- اسٹاپ نقصان اور پوزیشن مینجمنٹ جیسے رسک کنٹرول اقدامات شامل کریں ، معقول اسٹاپ نقصان اور پوزیشن سائز مرتب کریں ، اور انفرادی تجارت کے خطرے کی حد کو کنٹرول کریں۔
- اس حکمت عملی کے پیرامیٹرز کو بہتر بنانے اور اس کی جانچ پڑتال کرنے کے لئے ، بہترین پیرامیٹرز کا مجموعہ اور مارکیٹ میں اطلاق کے دائرہ کار کو تلاش کریں۔
- اس حکمت عملی کو دیگر حکمت عملیوں کے ساتھ جوڑنے پر غور کریں تاکہ مختلف حکمت عملیوں کے فوائد کو استعمال کیا جاسکے ، جس سے مجموعی طور پر استحکام اور منافع میں اضافہ ہو۔
خلاصہ کریں۔
اس حکمت عملی میں ٹرانزیکشن ہاٹ چارٹ ، ریئل ٹائم قیمت اور متعدد تکنیکی اشارے کو جوڑ کر ، خرید و فروخت کے سگنل تیار کیے جاتے ہیں ، جس میں کچھ حوالہ کی قیمت ہوتی ہے۔ حکمت عملی کی خوبی یہ ہے کہ وہ قیمتوں اور ٹرانزیکشن کی تقسیم کو بصری طور پر ظاہر کرسکتی ہے ، اور متعدد عوامل کو جامع طور پر مدنظر رکھتی ہے۔ تاہم ، حکمت عملی میں کچھ حدود اور خطرات بھی موجود ہیں ، جیسے پیرامیٹرز کی ترتیب کا اثر ، اشارے کی پسماندگی ، رجحان سازی والی مارکیٹ پر انحصار وغیرہ۔ لہذا ، عملی استعمال میں ، حکمت عملی کو مزید بہتر بنانے اور بہتر بنانے کی ضرورت ہے ، جیسے مزید اشارے ، بہتر سگنل کی شرائط ، اور خطرے کے کنٹرول کو مضبوط بنانا ، تاکہ حکمت عملی کی استحکام اور منافع بخش صلاحیت کو بہتر بنایا جاسکے۔
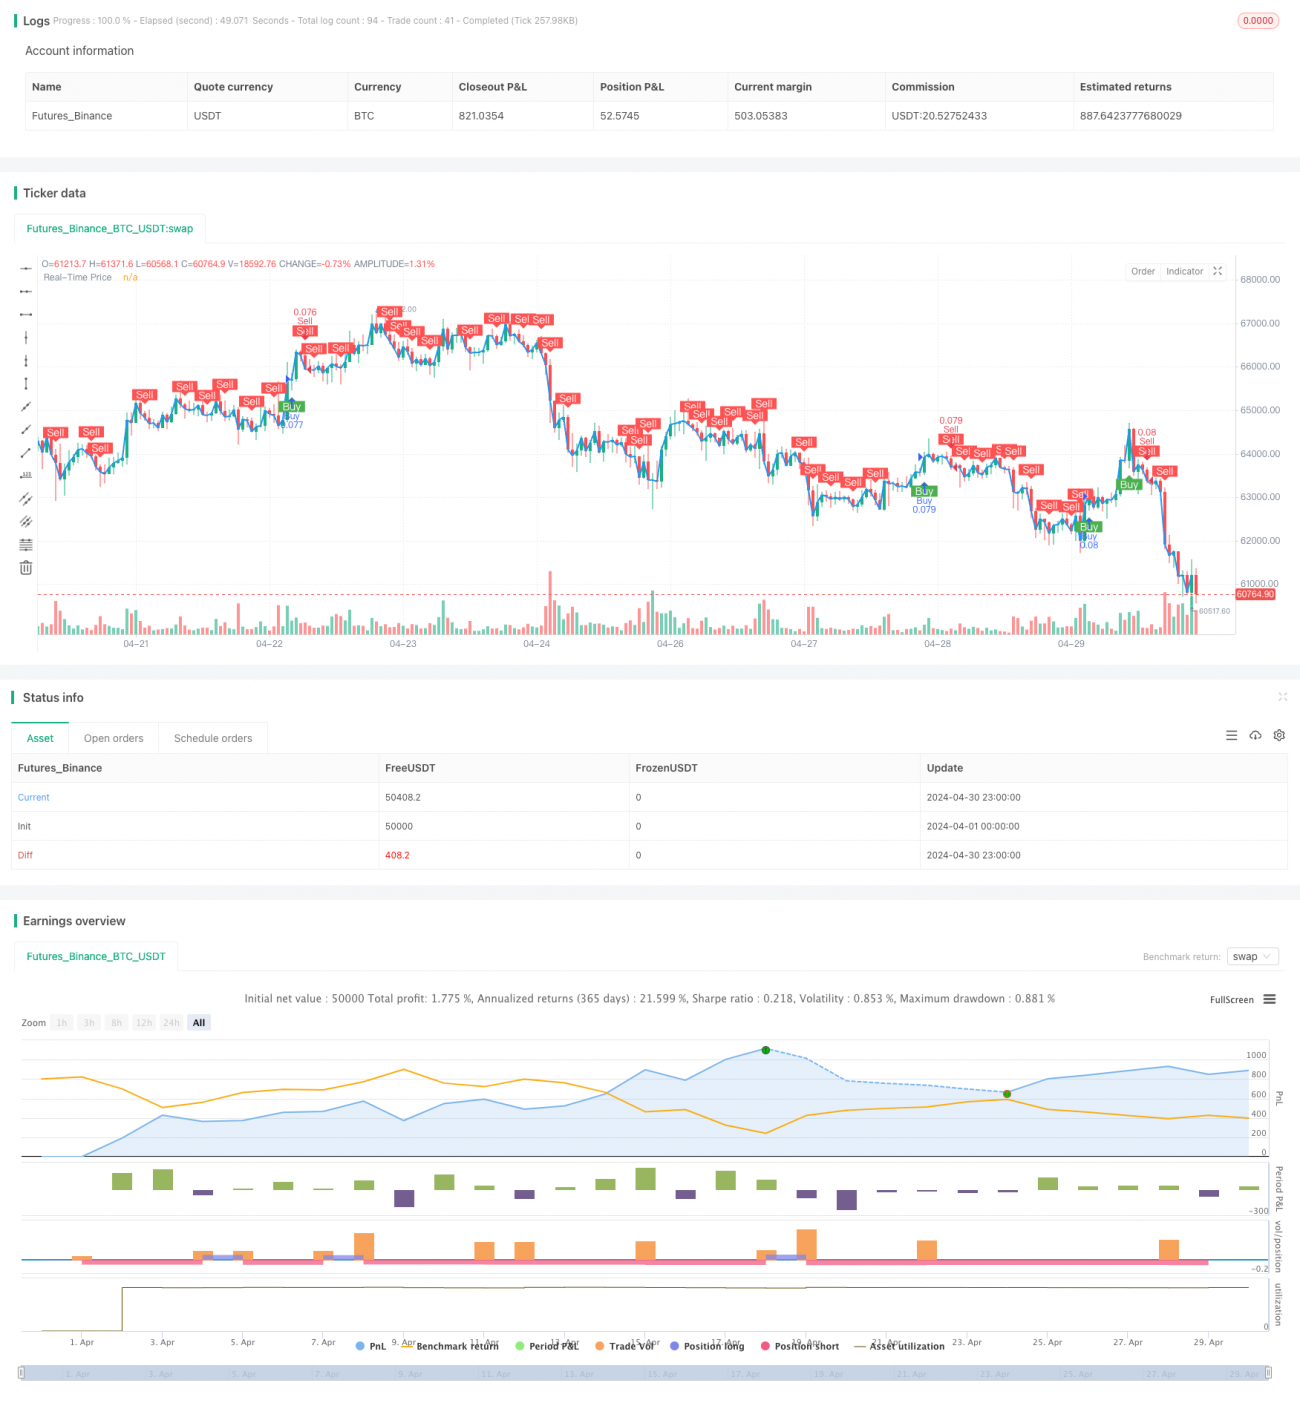
/*backtest
start: 2024-04-01 00:00:00
end: 2024-04-30 23:59:59
period: 1h
basePeriod: 15m
exchanges: [{"eid":"Futures_Binance","currency":"BTC_USDT"}]
*/

//@version=5
strategy("Buy and Sell Volume Heatmap with Real-Time Price Strategy", overlay=true, default_qty_type=strategy.percent_of_equity, default_qty_value=10)

// Settings for Volume Heatmap- 1