ڈبل موونگ ایوریج کراس اوور اسٹاپ پرافٹ اور اسٹاپ لاس اسٹریٹجی

جائزہ
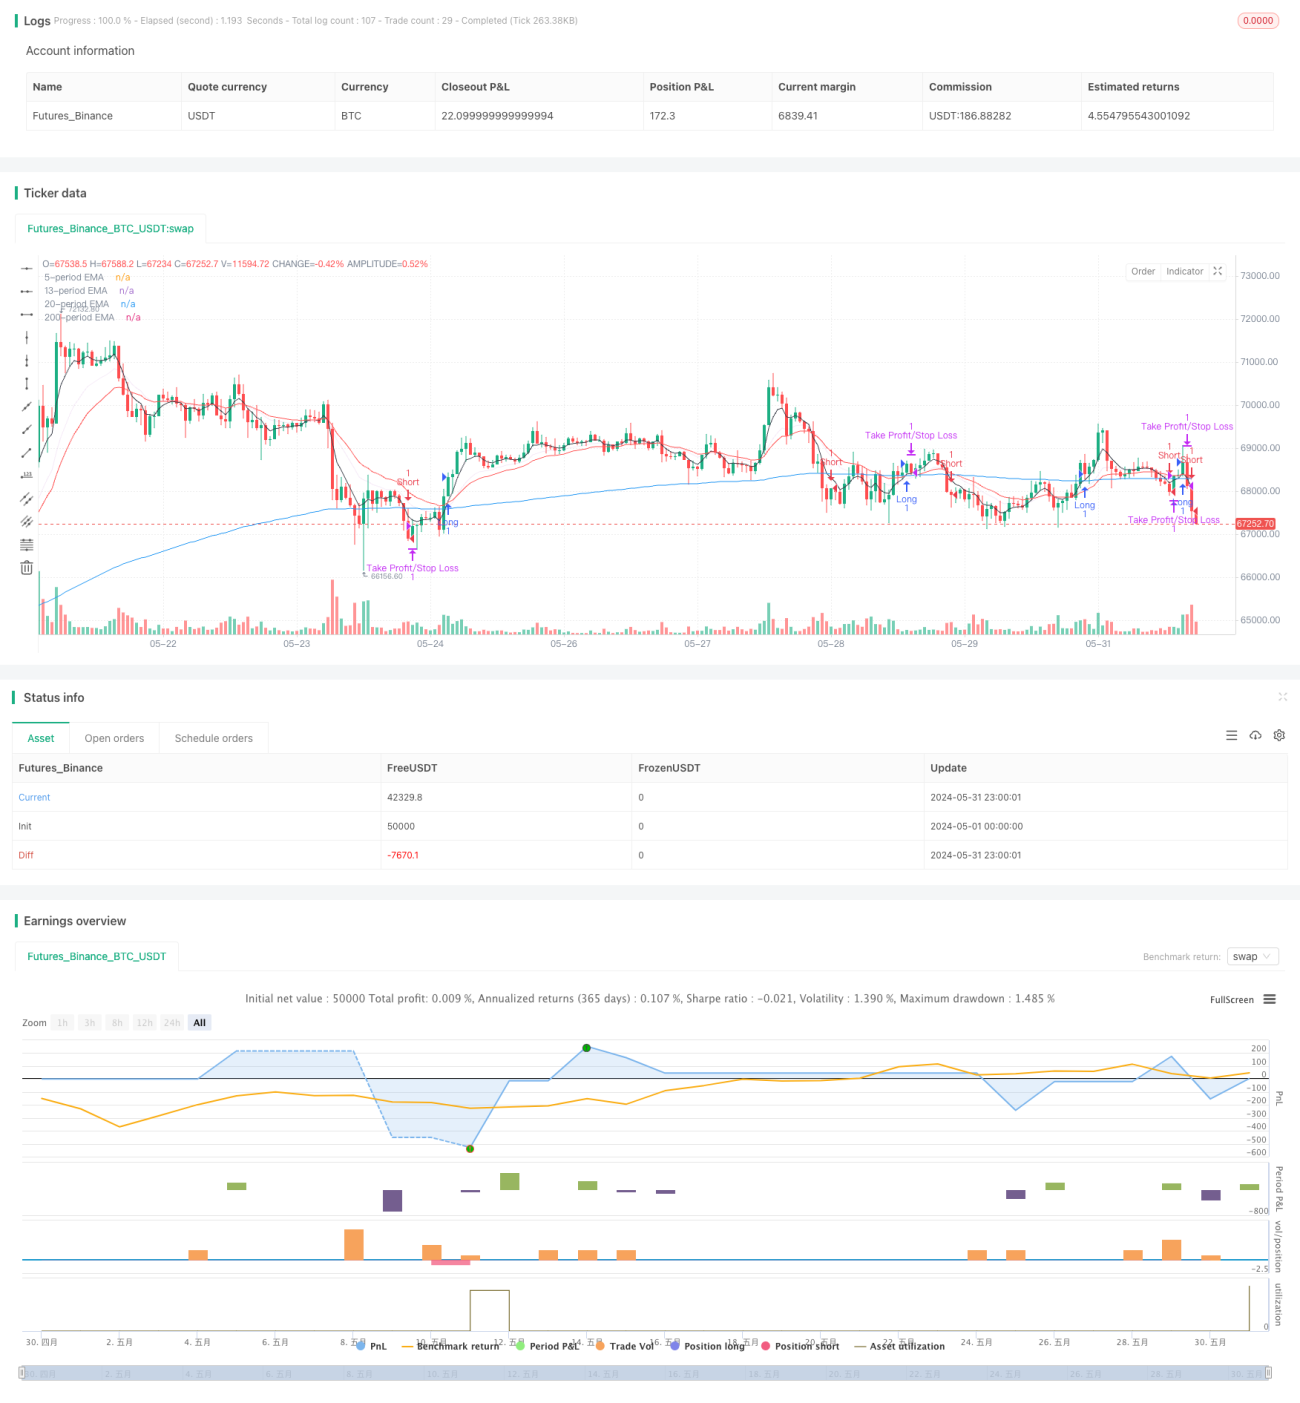
یہ حکمت عملی دو مختلف ادوار کی اشاریہ حرکت پذیری اوسط ((EMA) کے کراس کو بطور تجارتی سگنل استعمال کرتی ہے ، اور ایک مقررہ تعداد میں اسٹاپ اور اسٹاپ نقصانات کا تعین کرتی ہے۔ جب قلیل مدتی EMA نیچے سے اوپر کی طرف سے طویل مدتی EMA کو عبور کرتا ہے تو ، زیادہ پوزیشن کھولی جاتی ہے۔ جب قلیل مدتی EMA اوپر سے نیچے کی طرف سے طویل مدتی EMA کو عبور کرتا ہے تو ، پوزیشن خالی کردی جاتی ہے۔ جب تجارت ہوتی ہے تو ، خطرے کو کنٹرول کرنے اور منافع کو مقفل کرنے کے لئے مقررہ تعداد میں اسٹاپ اور اسٹاپ نقصانات کا تعین کیا جاتا ہے۔
حکمت عملی کا اصول
- دو مختلف ادوار کے لئے EMA کا حساب لگائیں ، پہلے سے طے شدہ 5 ادوار اور 200 ادوار۔
- جب 5 سائیکل ای ایم اے نیچے سے اوپر کی طرف سے 200 سائیکل ای ایم اے کو پار کرتا ہے تو ، ایک کثیر سگنل پیدا ہوتا ہے۔ جب 5 سائیکل ای ایم اے اوپر سے نیچے کی طرف سے 200 سائیکل ای ایم اے کو پار کرتا ہے تو ، ایک خالی سگنل پیدا ہوتا ہے۔
- پوزیشن کھولنے کے بعد ، اسٹاپ نقصان کے پوائنٹس ((ڈیفالٹ 50 پوائنٹس) اور اسٹاپ بند پوائنٹس ((ڈیفالٹ 200 پوائنٹس) مقرر کریں۔
- جب قیمت اسٹاپ پوائنٹ یا اسٹاپ نقصان پوائنٹ کو چھوتی ہے ، یا پوزیشن کو 200 ٹریڈنگ سائیکل تک پہنچاتی ہے تو ، پوزیشن سے باہر نکل جاتی ہے۔
- اسٹاپ اسٹاپ نقصان کے پوائنٹس کی تعداد کو چارٹ کی تجارت کی مقدار کے مطابق ایڈجسٹ کیا جاسکتا ہے۔
اسٹریٹجک فوائد
- سادہ اور سمجھنے میں آسان: حکمت عملی کی منطق واضح ہے اور اسے سمجھنا اور اس پر عمل درآمد کرنا آسان ہے۔
- رجحانات کا سراغ لگانا: مارکیٹ کے رجحانات کو بہتر طور پر پکڑنے کے لئے ای ایم اے کی رجحانات کی خصوصیات کا استعمال کریں۔
- رسک کنٹرول: فکسڈ پوائنٹ اسٹاپ نقصان کی ترتیب ، ایک ہی تجارت کے خطرے کو مؤثر طریقے سے کنٹرول کریں۔
- لچکدار: اسٹاپ اسٹاپ پوائنٹس کو مارکیٹ کی اتار چڑھاؤ اور ذاتی خطرے کی ترجیحات کے مطابق ایڈجسٹ کیا جاسکتا ہے۔
اسٹریٹجک رسک
- غلط سگنل: ای ایم اے کراسنگ سے غلط سگنل پیدا ہوسکتے ہیں ، جس کی وجہ سے بار بار تجارت اور رقم کا نقصان ہوتا ہے۔
- رجحان کی تاخیر: ای ایم اے ایک پیچھے رہ جانے والا اشارے ہے ، جو رجحان کے قیام کے بعد ہی سگنل دے سکتا ہے ، بہترین داخلے کے مواقع سے محروم ہوجاتا ہے۔
- مارکیٹوں کی صفائی: مارکیٹوں کی صفائی میں ، بار بار ای ایم اے کے کراسنگ سے مسلسل نقصان دہ تجارت ہوسکتی ہے۔
- فکسڈ پوائنٹ اسٹاپ: فکسڈ پوائنٹ اسٹاپ مارکیٹ میں اتار چڑھاؤ کی تبدیلیوں کے مطابق نہیں ہوسکتا ہے ، جس کی وجہ سے اسٹاپ پوزیشن کی غلط ترتیب ہوتی ہے۔
حکمت عملی کی اصلاح کی سمت
- مزید اشارے متعارف کروائیں: دیگر تکنیکی اشارے جیسے MACD ، RSI وغیرہ کے ساتھ مل کر ، سگنل کی وشوسنییتا کو بہتر بنائیں۔
- پیرامیٹرز کو بہتر بنائیں: حکمت عملی کی کارکردگی کو بہتر بنانے کے لئے ای ایم اے کی مدت ، اسٹاپ اسٹاپ نقصان پوائنٹس اور دیگر پیرامیٹرز کو بہتر بنائیں۔
- متحرک رکاوٹ: مارکیٹ میں اتار چڑھاو کے مطابق متحرک رکاوٹ پوائنٹس کو بہتر طور پر مارکیٹ میں تبدیلیوں کے مطابق ڈھالنا۔
- پوزیشن مینجمنٹ: پوزیشن مینجمنٹ کے قواعد متعارف کروائیں ، جیسے خطرے پر مبنی پوزیشن ایڈجسٹمنٹ ، خطرے سے متعلق ایڈجسٹمنٹ کے بعد منافع میں اضافہ کریں۔
- فلٹر: سگنل کے معیار کو بہتر بنانے کے لئے ٹریڈنگ سگنل فلٹرنگ شرائط جیسے ٹرانزیکشن حجم ، قیمت کی شکل وغیرہ شامل کریں۔
خلاصہ کریں۔
ڈبل مساوی کراس اسٹاپ نقصان کی حکمت عملی ایک آسان اور استعمال میں آسان تجارتی حکمت عملی ہے ، جو EMA کراسنگ کے ذریعے تجارتی سگنل پیدا کرتی ہے ، جبکہ اسٹریپ نقصان کو روکنے کے لئے مقررہ پوائنٹس کی تعداد بھی رکھتی ہے۔ اس حکمت عملی کا فائدہ یہ ہے کہ یہ منطقی طور پر واضح ہے ، اس پر عمل درآمد کرنا آسان ہے ، اور مارکیٹ کے رجحانات کو بہتر طور پر پکڑ سکتا ہے۔ لیکن اس کے ساتھ ہی ، جعلی سگنل ، رجحان کی تاخیر ، مارکیٹ اور فکسڈ اسٹاپ جیسے خطرات بھی موجود ہیں۔ اصلاح کی سمت میں مزید اشارے کی اصلاح کے پیرامیٹرز ، متحرک نقصانات ، پوزیشن مینجمنٹ اور فلٹرز میں اضافہ شامل ہے۔ تاجر اپنی خطرے کی ترجیحات اور مارکیٹ کی خصوصیات کے مطابق ، حکمت عملی کی استحکام اور منافع بخش صلاحیت کو بہتر بنانے کے لئے اس حکمت عملی کو مناسب طریقے سے بہتر اور ایڈجسٹ کرسکتا ہے۔
- 1