ڈبل موونگ ایوریج کراس اوور پر مبنی حرکت پذیری اوسط حکمت عملی

جائزہ
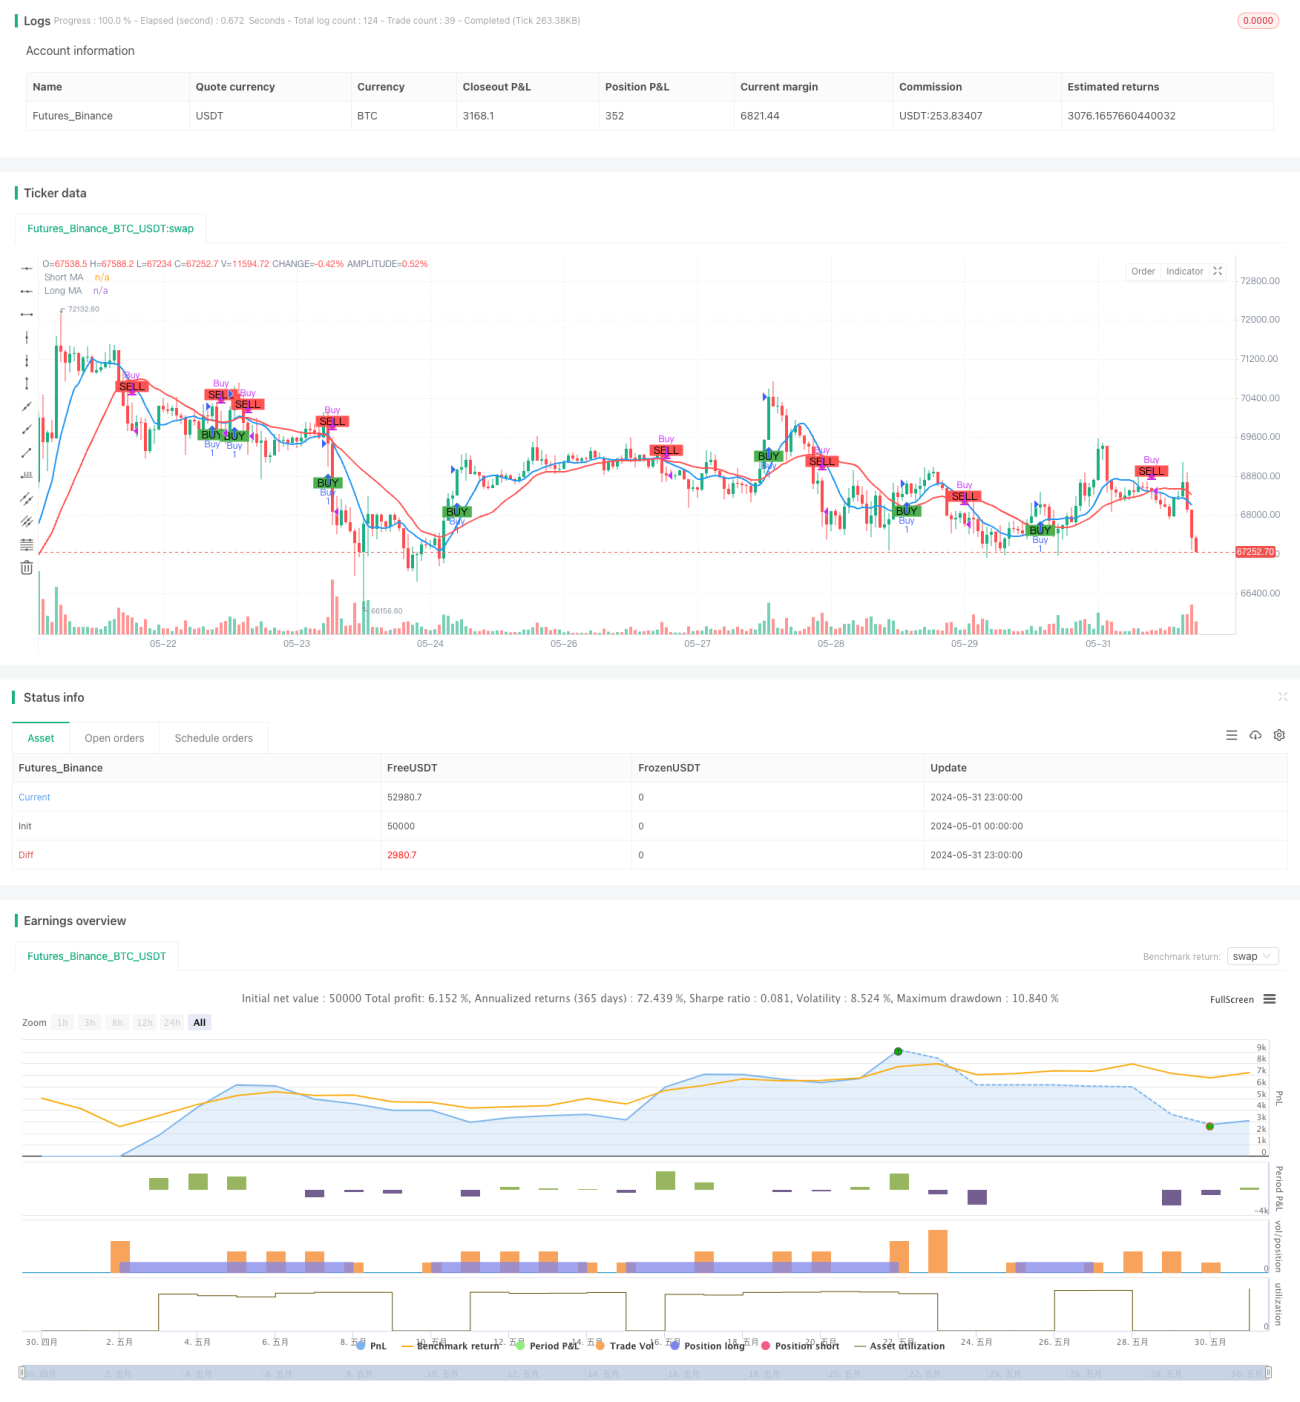
ایک متحرک اوسط حکمت عملی جو دو بارہ کی اوسط پر مبنی ہے ایک سادہ اور موثر دن کے اندرونی تجارت کا طریقہ ہے جس کا مقصد مارکیٹ میں خرید و فروخت کے ممکنہ مواقع کی نشاندہی کرنا ہے۔ اس حکمت عملی میں ایک مختصر مدت کی سادہ حرکت پذیر اوسط (ایس ایم اے) اور ایک طویل مدتی سادہ حرکت پذیر اوسط کا استعمال کیا جاتا ہے ، جب قلیل مدتی اوسط پر طویل مدتی اوسط سے گزرتا ہے تو ، اس کی نشاندہی کرتا ہے اور ممکنہ خرید و فروخت کے مواقع کی نشاندہی کرتا ہے۔ اس کے برعکس ، جب طویل مدتی اوسط پر قلیل مدتی اوسط سے گزرتا ہے تو ، اس کی نشاندہی کرتا ہے اور ممکنہ فروخت کے مواقع کی نشاندہی کرتا ہے۔ اس طرح کے ایکسلنگ سے تاجروں کو مارکیٹ کے رجحانات کو پکڑنے میں مدد ملتی ہے ، جبکہ مارکیٹ میں شور کی مداخلت کو کم سے کم کیا جاتا ہے۔
حکمت عملی کا اصول
اس حکمت عملی کا بنیادی اصول یہ ہے کہ مختلف دورانیہ کی حرکت پذیری اوسط کی رجحان کی خصوصیات اور تاخیر کا استعمال کیا جائے ، اور قلیل مدتی اوسط اور طویل مدتی اوسط کے مابین متعلقہ پوزیشن کے تعلقات کا موازنہ کرکے موجودہ مارکیٹ کی رجحان کی سمت کا فیصلہ کیا جائے ، تاکہ اسی کے مطابق تجارتی فیصلے کیے جاسکیں۔ جب مارکیٹ میں اضافہ ہوتا ہے تو ، قیمت پہلے طویل مدتی اوسط کو توڑ دیتی ہے ، اور پھر قلیل مدتی اوسط پر طویل مدتی اوسط کو عبور کرتی ہے ، جس سے خریدنے کا اشارہ ہوتا ہے۔ جب مارکیٹ میں کمی کا رجحان ہوتا ہے تو ، قیمت پہلے طویل مدتی اوسط کو توڑ دیتی ہے ، اور پھر قلیل مدتی اوسط نیچے کی طرف جاتا ہے۔ طویل مدتی اوسط پر مشتمل ہے ، جس میں فروخت کا اشارہ ہوتا ہے۔ اس حکمت عملی کے پیرامیٹرز میں ، قلیل مدتی اوسط کا دورانیہ 9 ہے ، اور طویل مدتی اوسط کا دورانیہ 21 ہے ، یہ دونوں پیرامیٹرز مارکیٹ کی انفرادی خصوصیات اور ترجیحات کے مطابق ایڈجسٹ ہوسکتے ہیں۔ اس حکمت عملی میں ابتدائی فنڈ مینجمنٹ کا تصور بھی متعارف کرایا گیا ہے ، جس میں ہر پوزیشن کے لئے
اسٹریٹجک فوائد
- سادہ اور سمجھنے میں آسان: یہ حکمت عملی کلاسیکی حرکت پذیری اوسط نظریہ پر مبنی ہے، منطق واضح ہے، سمجھنے اور لاگو کرنے میں آسان ہے۔
- لچکدار: یہ حکمت عملی متعدد مارکیٹوں اور مختلف قسم کے لین دین پر لاگو ہوسکتی ہے ، پیرامیٹرز کی ترتیبات کو ایڈجسٹ کرکے مختلف مارکیٹ کی خصوصیات کے ل.
- رجحانات کو پکڑنے: دو برابر لکیروں کے ذریعے رجحانات کی سمت کا تعین کرنے کے لئے ، تاجر کو اہم رجحانات کے ساتھ وقت پر عمل کرنے میں مدد ملتی ہے ، جس سے منافع کے مواقع میں اضافہ ہوتا ہے۔
- رسک کنٹرول: اس حکمت عملی میں رسک مینجمنٹ کا تصور متعارف کرایا گیا ہے ، جس میں پوزیشن ایڈجسٹمنٹ کے ذریعہ ہر تجارت کے خطرے کے سوراخ کو کنٹرول کیا جاتا ہے ، تاکہ ممکنہ نقصانات کو مؤثر طریقے سے منظم کیا جاسکے۔
- شور کو کم کرنا: مساوی لائن کی تاخیر کی خصوصیات کا استعمال کرتے ہوئے ، مارکیٹ میں بے ترتیب شور کو مؤثر طریقے سے فلٹر کریں ، اور تجارتی سگنل کی وشوسنییتا کو بہتر بنائیں۔
اسٹریٹجک رسک
- پیرامیٹرز کا انتخاب: مختلف پیرامیٹرز کی ترتیبات حکمت عملی کی کارکردگی پر اہم اثر ڈالتی ہیں۔ غلط انتخاب سے حکمت عملی ناکام یا خراب کارکردگی کا سبب بن سکتی ہے۔
- مارکیٹ کے رجحانات: یہ حکمت عملی ایک بار پھر نقصان کا شکار ہوسکتی ہے جب مارکیٹ میں ہلچل پڑتی ہے یا رجحانات میں تبدیلی آتی ہے۔
- سلائڈ پوائنٹ لاگت: بار بار تجارت سے سلائڈ پوائنٹ لاگت میں اضافہ ہوسکتا ہے ، جو حکمت عملی کے مجموعی منافع کو متاثر کرتا ہے۔
- بلیک سوان واقعہ: یہ حکمت عملی انتہائی حالات کے لیے موزوں نہیں ہے۔ بلیک سوان واقعے سے حکمت عملی کو بہت زیادہ نقصان ہو سکتا ہے۔
- اوور فٹ ہونے کا خطرہ: اگر پیرامیٹرز کی اصلاح تاریخ کے اعداد و شمار پر بہت زیادہ انحصار کرتی ہے تو ، اس حکمت عملی کو حقیقی تجارت میں خراب کارکردگی کا مظاہرہ کرنے کا سبب بن سکتا ہے۔
حکمت عملی کی اصلاح کی سمت
- متحرک پیرامیٹرز کی اصلاح: مارکیٹ کی حالت میں تبدیلی کے مطابق ، حکمت عملی کے پیرامیٹرز کو متحرک طور پر ایڈجسٹ کریں ، موافقت کو بہتر بنائیں۔
- رجحان کی تصدیق: ٹریڈنگ سگنل کے بعد ، رجحان کی تصدیق کے لئے دوسرے اشارے یا قیمت کے طرز عمل کے نمونوں کو متعارف کرایا جاتا ہے ، جس سے سگنل کی وشوسنییتا میں اضافہ ہوتا ہے۔
- اسٹاپ نقصان: ایک مناسب اسٹاپ نقصان کا طریقہ کار متعارف کرایا گیا ہے جس سے ایک ہی تجارت کے خطرے کی حد کو مزید کنٹرول کیا جاسکتا ہے۔
- پوزیشن مینجمنٹ: پوزیشن ایڈجسٹمنٹ کو بہتر بنانے کے طریقے ، جیسے اتار چڑھاؤ کی شرح کے اشارے متعارف کروانا ، مارکیٹ میں اتار چڑھاؤ کی سطح کے مطابق پوزیشن کو متحرک طور پر ایڈجسٹ کرنا۔
- کثیر فضائی طاقت کی تشخیص: کثیر اور فضائی طاقت کے متضاد تعلقات کا اندازہ لگانا ، رجحانات کی ابتدائی مداخلت ، رجحانات کی گرفت کی درستگی کو بہتر بنانا۔
خلاصہ کریں۔
ایک متحرک اوسط حکمت عملی جو دو بارہ لائنوں پر مبنی ہے ایک آسان عملی دن کے اندر تجارت کا طریقہ ہے ، مارکیٹ کے رجحان کی سمت کا اندازہ لگانے کے لئے ، اور تجارت کے سگنل پیدا کرنے کے لئے مختلف دورانیہ اوسط کے مابین پوزیشن کے تعلقات کا موازنہ کریں۔ حکمت عملی کی منطق واضح ، لچکدار ہے ، اور مارکیٹ کے رجحانات کو مؤثر طریقے سے پکڑ سکتی ہے ، جبکہ خطرے کے انتظام کے اقدامات کو متعارف کرانے کے ساتھ ساتھ ، ممکنہ نقصان کو کنٹرول کرتی ہے۔ تاہم ، اس حکمت عملی میں پیرامیٹرز ، رجحان کا انتخاب ، بار بار تجارت اور دیگر ممکنہ خطرات بھی موجود ہیں۔ متحرک اصلاح ، سگنل کی تصدیق ، پوزیشن مینجمنٹ وغیرہ کے ذریعہ حکمت عملی کی استحکام اور منافع بخش صلاحیت کو مزید بڑھانے کی ضرورت ہے۔ مجموعی طور پر ، ایک کلاسک تکنیکی تجزیہ اشارے کے طور پر ، ایک متحرک اوسط ، جس کے بنیادی اصول اور عملی اطلاق کی قدر کو مارکیٹ میں وسیع پیمانے پر ثابت کیا گیا ہے ، کو گہرائی سے مطالعہ کرنے اور بہتر بنانے کے قابل ہے۔
Overview
The Moving Average Crossover Strategy based on dual moving averages is a straightforward and effective intraday trading approach designed to identify potential buy and sell opportunities in the market by analyzing the relationship between two moving averages of different periods. This strategy utilizes a short-term simple moving average (SMA) and a long-term simple moving average. When the short-term moving average crosses above the long-term moving average, it indicates a bullish signal, suggesting a potential buying opportunity. Conversely, when the short-term moving average crosses below the long-term moving average, it indicates a bearish signal, suggesting a potential selling opportunity. This crossover method helps traders capture trending moves in the market while minimizing market noise interference.
Strategy Principle
The core principle of this strategy is to utilize the trend characteristics and lag of moving averages with different periods. By comparing the relative position relationship between the short-term moving average and the long-term moving average, it determines the current market trend direction and makes corresponding trading decisions. When an upward trend emerges in the market, the price will first break through the long-term moving average, and the short-term moving average will subsequently cross above the long-term moving average, forming a golden cross and generating a buy signal. When a downward trend emerges in the market, the price will first break below the long-term moving average, and the short-term moving average will subsequently cross below the long-term moving average, forming a death cross and generating a sell signal. In the parameter settings of this strategy, the period of the short-term moving average is set to 9, and the period of the long-term moving average is set to 21. These two parameters can be adjusted based on market characteristics and personal preferences. Additionally, this strategy introduces the concept of money management by setting the initial capital and risk percentage per trade, using position sizing to control the risk exposure of each trade.
Strategy Advantages
- Simplicity: This strategy is based on the classic moving average theory, with clear logic and easy to understand and implement.
- Adaptability: This strategy can be applied to multiple markets and different trading instruments. By adjusting parameter settings, it can flexibly adapt to different market characteristics.
- Trend Capture: By using the dual moving average crossover to determine the trend direction, it helps traders timely follow the mainstream trend and increase profit opportunities.
- Risk Control: This strategy introduces the concept of risk management, using position sizing to control the risk exposure of each trade, effectively managing potential losses.
- Noise Reduction: By utilizing the lag characteristic of moving averages, it effectively filters out random noise in the market, improving the reliability of trading signals.
Strategy Risks
- Parameter Selection: Different parameter settings can have a significant impact on strategy performance. Improper selection may lead to strategy failure or poor performance.
- Market Trend: In ranging markets or trend turning points, this strategy may experience consecutive losses.
- Slippage Costs: Frequent trading may result in higher slippage costs, affecting the overall profitability of the strategy.
- Black Swan Events: This strategy has poor adaptability to extreme market conditions, and black swan events may cause significant losses to the strategy.
- Overfitting Risk: If parameter optimization relies too heavily on historical data, it may lead to poor performance of the strategy in actual trading.
Strategy Optimization Directions
- Dynamic Parameter Optimization: Dynamically adjust strategy parameters based on changes in market conditions to improve adaptability.
- Trend Confirmation: After generating trading signals, introduce other indicators or price behavior patterns to confirm the trend, improving signal reliability.
- Stop-Loss and Take-Profit: Introduce reasonable stop-loss and take-profit mechanisms to further control the risk exposure of each trade.
- Position Management: Optimize the position sizing method, such as introducing volatility indicators to dynamically adjust positions based on market volatility levels.
- Long-Short Strength Assessment: Assess the comparative relationship between bullish and bearish strengths, entering at the early stage of a trend to improve the accuracy of trend capture.
Summary
The Moving Average Crossover Strategy based on dual moving averages is a simple and practical intraday trading method. By comparing the position relationship of moving averages with different periods, it determines the market trend direction and generates trading signals. This strategy has clear logic, strong adaptability, and can effectively capture market trends while introducing risk management measures to control potential losses. However, this strategy also has potential risks such as parameter selection, trend reversal, frequent trading, etc. It needs to be further improved through dynamic optimization, signal confirmation, position management, and other methods to enhance the robustness and profitability of the strategy. In general, as a classic technical analysis indicator, the basic principles and practical application value of moving averages have been widely verified by the market. It is a trading strategy worthy of in-depth research and continuous optimization.
- 1