حکمت عملی کے بعد متحرک رجحان
ATR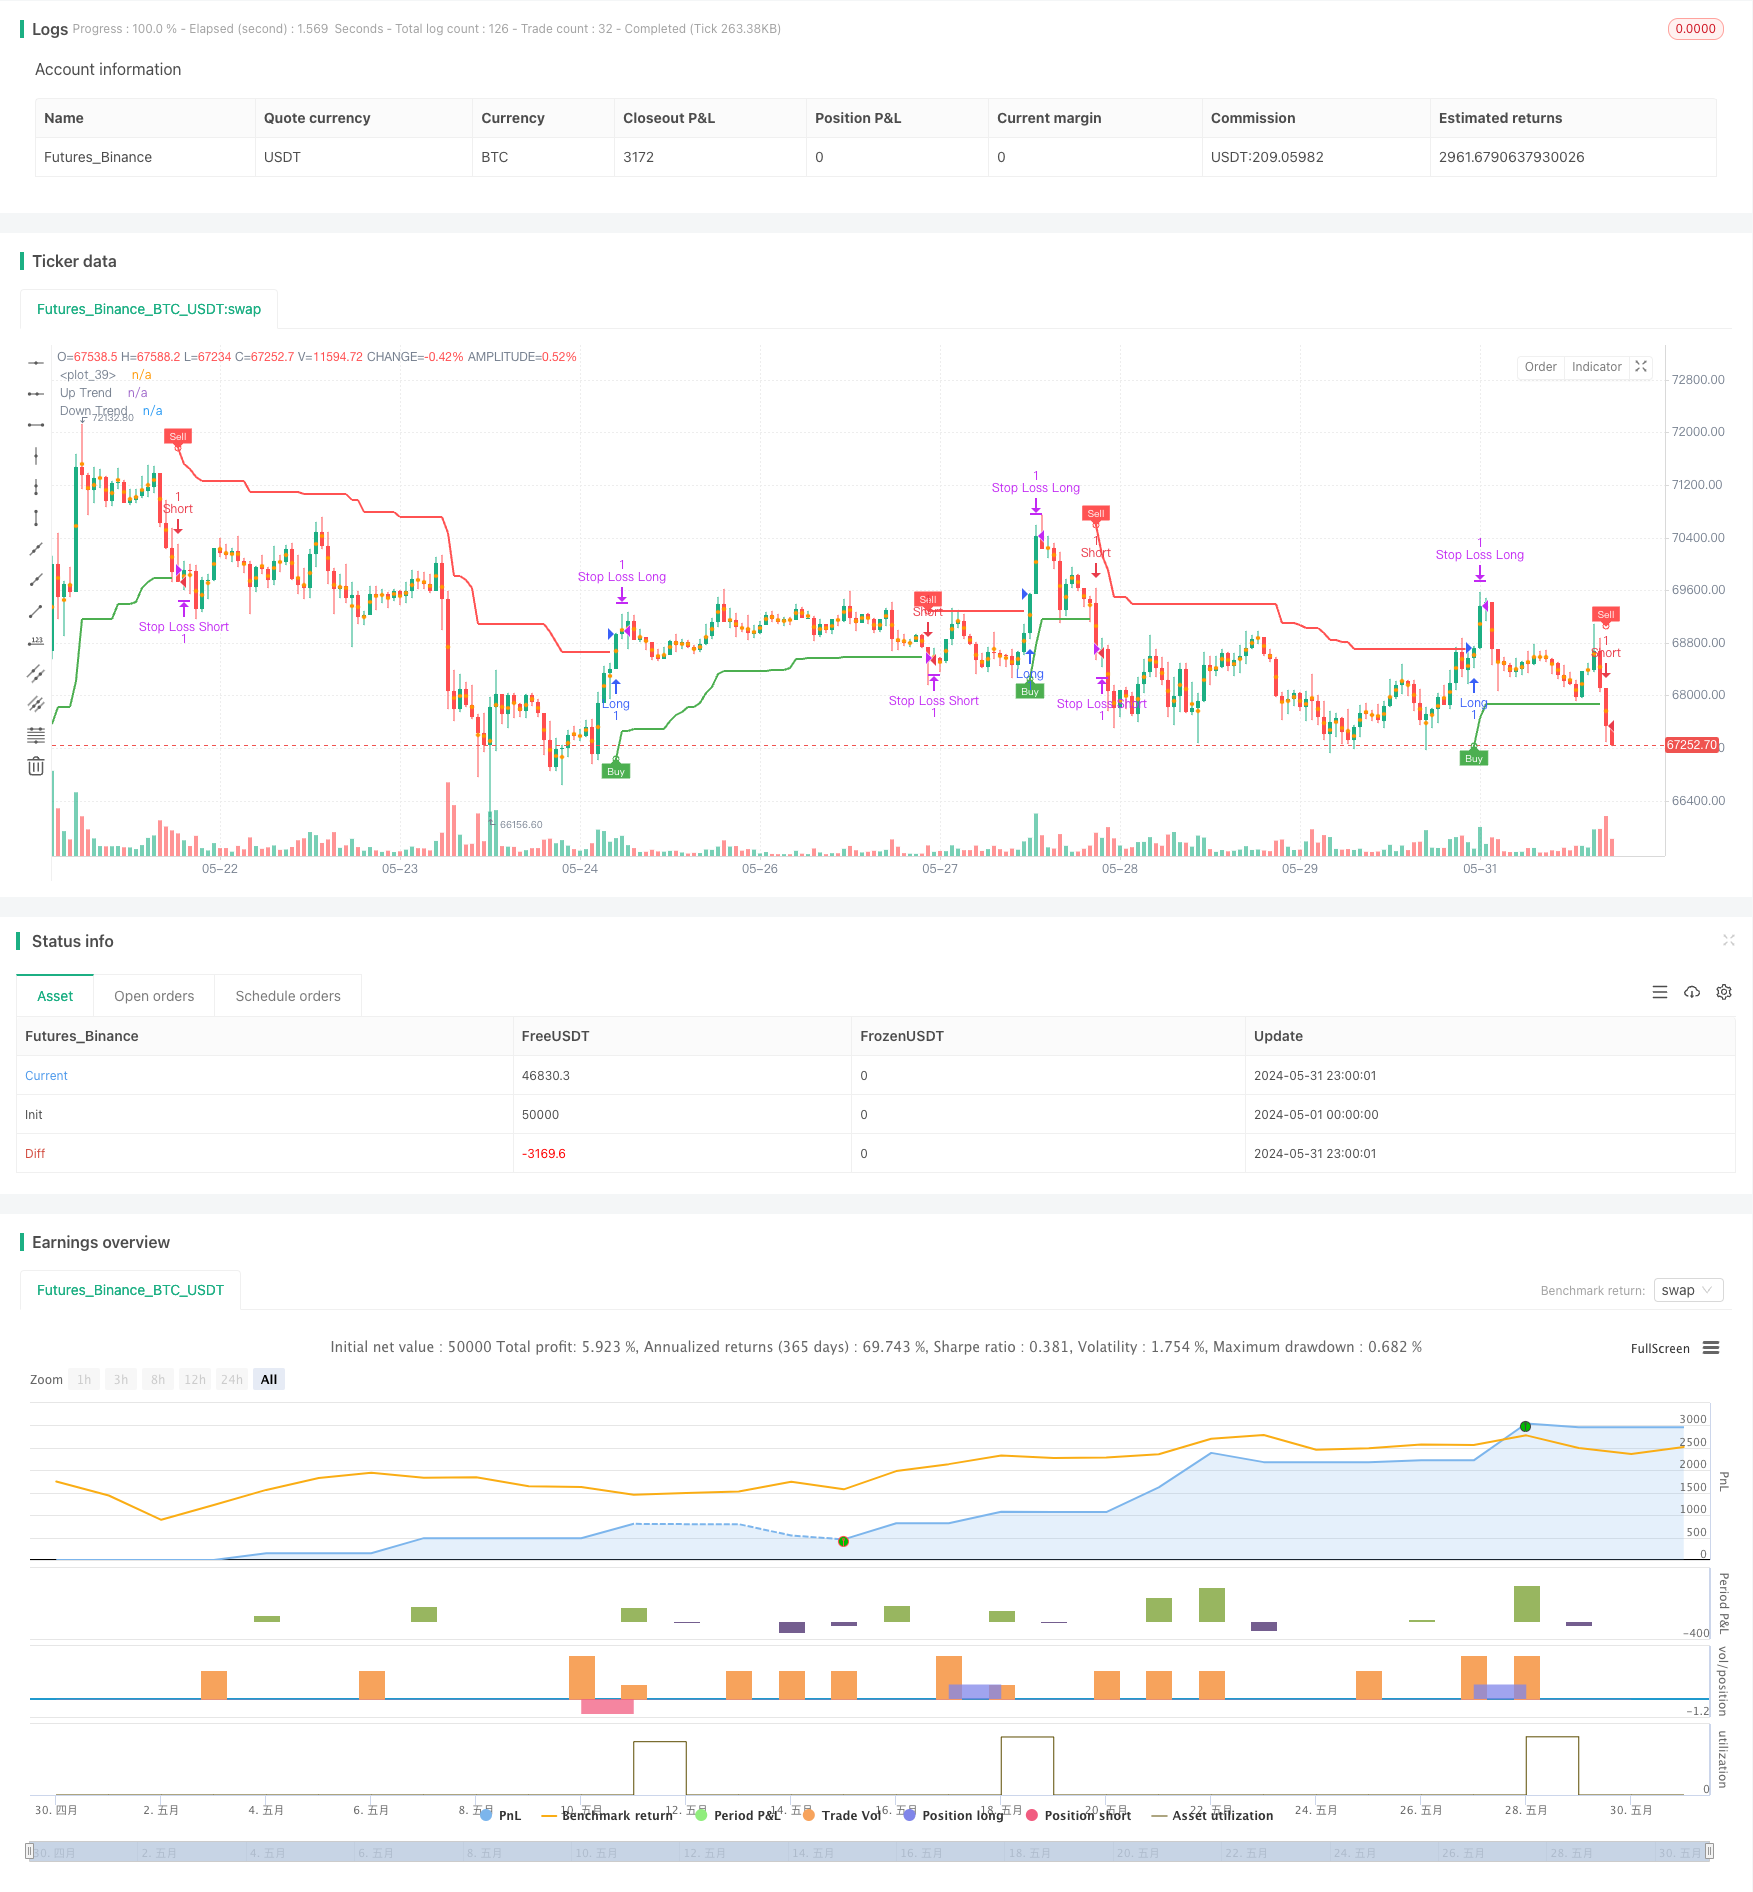
جائزہ
یہ حکمت عملی مارکیٹ کے رجحانات کو پکڑنے کے لئے سپر ٹرینڈ اشارے کا استعمال کرتی ہے۔ سپر ٹرینڈ اشارے قیمت اور اتار چڑھاؤ کی شرح کو یکجا کرتے ہیں ، جب اشارے کی لکیر سبز ہوتی ہے تو یہ بڑھتی ہوئی رجحان کی نشاندہی کرتی ہے ، جب سرخ ہوتی ہے تو یہ گرتی ہوئی رجحان کی نشاندہی کرتی ہے۔ حکمت عملی اشارے کی لکیر کے رنگ میں ہونے والی تبدیلیوں کا پتہ لگانے کے ذریعہ خرید و فروخت کا اشارہ پیدا کرتی ہے ، جبکہ اشارے کی لکیر کو متحرک اسٹاپ نقصان کے طور پر استعمال کرتی ہے۔ حکمت عملی میں حکمت عملی کی کارکردگی کو بہتر بنانے کے لئے متحرک اسٹاپ نقصان اور فکسڈ اسٹاپ لاجسٹک بھی متعارف کرایا گیا ہے۔
حکمت عملی کا اصول
- سپر ٹرینڈ اشارے کے اوپری ٹریک ((up) اور نچلے ٹریک ((dn) کا حساب لگائیں ، اور موجودہ رجحان کی سمت ((trend) کو بند ہونے والی قیمتوں اور اوپری اور نچلے ٹریک کے تعلقات کے مطابق فیصلہ کریں۔
- جب رجحان نیچے سے ((-1) اوپر کی طرف مڑتا ہے ((1) ، خریدنے کا اشارہ ((buySignal) پیدا کرتا ہے۔ جب رجحان اوپر سے ((1) نیچے کی طرف مڑتا ہے ((-1) ، بیچنے کا اشارہ ((sellSignal) پیدا کرتا ہے۔
- جب خریدنے کا اشارہ پیدا ہوتا ہے تو ، زیادہ پوزیشنیں کھولیں ، اور نیچے کی ریل ((dn) کو نقصان کی پوزیشن کے طور پر مقرر کریں۔ جب فروخت کا اشارہ پیدا ہوتا ہے تو ، پوزیشنیں خالی کریں ، اور اوپر کی ریل ((up) کو نقصان کی پوزیشن کے طور پر مقرر کریں۔
- متحرک اسٹاپ لاجسٹک متعارف کرایا گیا ، جب قیمت میں اضافہ / کمی ایک خاص تعداد میں ہوتی ہے (ٹریلنگ ویلیو) ، تو اسٹاپ نقصان کو اوپر / نیچے منتقل کیا جائے گا ، تاکہ اسٹاپ تحفظ کو حاصل کیا جاسکے۔
- فکسڈ اسٹاپ لاجسٹک متعارف کرایا گیا ہے ، جب رجحان میں تبدیلی آتی ہے تو ، بیعانہ منافع ختم ہوجاتا ہے۔
اسٹریٹجک فوائد
- لچکدار: سپر ٹرینڈ اشارے قیمتوں اور اتار چڑھاؤ کی شرح کے ساتھ مل کر مختلف مارکیٹ کی حالتوں اور تجارت کی اقسام کے مطابق ڈھال سکتے ہیں۔
- متحرک اسٹاپ: انڈیکیٹر لائن کو متحرک اسٹاپ کی حیثیت سے استعمال کرکے ، خطرے کو مؤثر طریقے سے کنٹرول کیا جاسکتا ہے ، اور نقصان کو کم کیا جاسکتا ہے۔
- متحرک رکاوٹ: متحرک رکاوٹ کی منطق متعارف کرانے سے رجحانات جاری رہنے پر منافع کی حفاظت ہوسکتی ہے اور حکمت عملی کی منافع بخش صلاحیت میں اضافہ ہوتا ہے۔
- واضح سگنل: حکمت عملی کی طرف سے پیدا کردہ خرید و فروخت کے سگنل واضح اور آسان ہیں، ان کا استعمال اور ان پر عمل درآمد آسان ہے۔
- پیرامیٹرز کی لچک: حکمت عملی کے پیرامیٹرز (جیسے اے ٹی آر سائیکل ، اے ٹی آر ضرب ، وغیرہ) کو مارکیٹ کی خصوصیات اور تجارتی طرز کے مطابق ایڈجسٹ کیا جاسکتا ہے ، جس سے موافقت کو بہتر بنایا جاسکتا ہے۔
اسٹریٹجک رسک
- پیرامیٹرز کا خطرہ: مختلف پیرامیٹرز کی ترتیبات سے حکمت عملی کی کارکردگی میں بڑے پیمانے پر فرق پیدا ہوسکتا ہے ، جس میں کافی مقدار میں جانچ پڑتال اور پیرامیٹرز کی اصلاح کی ضرورت ہوتی ہے۔
- غیر مستحکم مارکیٹ کا خطرہ: غیر مستحکم مارکیٹ میں ، رجحانات میں بار بار تبدیلیاں حکمت عملیوں کو زیادہ تجارتی سگنل پیدا کرنے کا سبب بن سکتی ہیں ، جس سے تجارت کی لاگت اور اسکیلپنگ کا خطرہ بڑھ جاتا ہے۔
- رجحانات میں تبدیلی کا خطرہ: جب مارکیٹ میں رجحانات میں اچانک تبدیلی آتی ہے تو ، حکمت عملی پوزیشنوں میں دیر سے ایڈجسٹ ہوسکتی ہے ، جس سے نقصان میں اضافہ ہوتا ہے۔
- اوور آپٹیمائزیشن کا خطرہ: حکمت عملی کو زیادہ سے زیادہ بہتر بنانا مستقبل کی مارکیٹ میں خراب کارکردگی کا مظاہرہ کرنے کے لئے منحنی فٹ ہونے کا سبب بن سکتا ہے۔
حکمت عملی کی اصلاح کی سمت
- ایک سے زیادہ ٹائم فریم تجزیہ متعارف کرانے کے لئے، رجحانات کی استحکام کی تصدیق، اور ہلکے بازاروں میں بار بار تجارت کو کم کرنے کے لئے.
- دوسرے تکنیکی اشارے یا بنیادی عوامل کے ساتھ مل کر ، رجحانات کی تشخیص کی درستگی کو بہتر بنائیں۔
- اسٹاپ نقصان اور اسٹاپ لاجسٹک کو بہتر بنائیں ، جیسے متحرک اسٹاپ یا رسک ریٹرن متعارف کرانا ، حکمت عملی کے منافع اور نقصان کا تناسب بڑھانا۔
- پیرامیٹرز کی استحکام کی جانچ کریں ، پیرامیٹرز کا ایک مجموعہ منتخب کریں جو مختلف مارکیٹ کے حالات میں اچھی کارکردگی کا مظاہرہ کرسکے۔
- پوزیشن مینجمنٹ اور فنڈ مینجمنٹ کے قواعد متعارف کروائیں تاکہ انفرادی تجارت کے خطرات اور مجموعی خطرات کو کنٹرول کیا جاسکے۔
خلاصہ کریں۔
متحرک رجحان سے باخبر رہنے کی حکمت عملی مارکیٹ کے رجحانات کو پکڑنے کے لئے سپر ٹرینڈ اشارے کا استعمال کرتی ہے ، متحرک اسٹاپ اور موبائل اسٹاپ نقصان کو کنٹرول کرتی ہے ، جبکہ فکسڈ اسٹاپ کو لاک کرنے کے لئے منافع کا استعمال کرتی ہے۔ یہ حکمت عملی لچکدار ہے ، سگنل واضح ہے ، اور کام کرنا آسان ہے۔ لیکن عملی استعمال میں ، پیرامیٹرز کی اصلاح ، اتار چڑھاؤ کی مارکیٹ کا خطرہ اور رجحان میں تبدیلی کا خطرہ وغیرہ پر توجہ دینے کی ضرورت ہے۔ ایک سے زیادہ ٹائم فریم تجزیہ ، اسٹاپ نقصانات کے منطقی پیرامیٹرز کو بہتر بنانے ، عددی استحکام ٹیسٹ وغیرہ کو متعارف کرانے کے ذریعہ حکمت عملی کی کارکردگی اور استحکام کو مزید بہتر بنایا جاسکتا ہے۔
/*backtest
start: 2024-05-01 00:00:00
end: 2024-05-31 23:59:59
period: 1h
basePeriod: 15m
exchanges: [{"eid":"Futures_Binance","currency":"BTC_USDT"}]
*/

//@version=5
strategy('Supertrend Strategy', overlay=true, format=format.price, precision=2)
Periods = input.int(title='ATR Period', defval=10)
src = input.source(hl2, title='Source')
Multiplier = input.float(title='ATR Multiplier', step=0.1, defval=3.0)
changeATR = input.bool(title='Change ATR Calculation Method ?', defval=true)
showsignals = input.bool(title='Show Buy/Sell Signals ?', defval=true)
highlighting = input.bool(title='Highlighter On/Off ?', defval=true)

// ATR calculation
atr2 = ta.sma(ta.tr, Periods)
atr = changeATR ? ta.atr(Periods) : atr2

// Supertrend calculations
up = src - Multiplier * atr
up1 = nz(up[1], up)
up := close[1] > up1 ? math.max(up, up1) : up
dn = src + Multiplier * atr
dn1 = nz(dn[1], dn)
dn := close[1] < dn1 ? math.min(dn, dn1) : dn

// Trend direction
trend = 1
trend := nz(trend[1], trend)
trend := trend == -1 and close > dn1 ? 1 : trend == 1 and close < up1 ? -1 : trend

// Plotting
upPlot = plot(trend == 1 ? up : na, title='Up Trend', style=plot.style_linebr, linewidth=2, color=color.new(color.green, 0))
buySignal = trend == 1 and trend[1] == -1
plotshape(buySignal ? up : na, title='UpTrend Begins', location=location.absolute, style=shape.circle, size=size.tiny, color=color.new(color.green, 0))
plotshape(buySignal and showsignals ? up : na, title='Buy', text='Buy', location=location.absolute, style=shape.labelup, size=size.tiny, color=color.new(color.green, 0), textcolor=color.new(color.white, 0))

dnPlot = plot(trend == 1 ? na : dn, title='Down Trend', style=plot.style_linebr, linewidth=2, color=color.new(color.red, 0))
sellSignal = trend == -1 and trend[1] == 1
plotshape(sellSignal ? dn : na, title='DownTrend Begins', location=location.absolute, style=shape.circle, size=size.tiny, color=color.new(color.red, 0))
plotshape(sellSignal and showsignals ? dn : na, title='Sell', text='Sell', location=location.absolute, style=shape.labeldown, size=size.tiny, color=color.new(color.red, 0), textcolor=color.new(color.white, 0))

// Highlighting
mPlot = plot(ohlc4, title='', style=plot.style_circles, linewidth=0)
longFillColor = highlighting ? trend == 1 ? color.green : color.white : color.white
shortFillColor = highlighting ? trend == -1 ? color.red : color.white : color.white
fill(mPlot, upPlot, title='UpTrend Highligter', color=longFillColor, transp=90)
fill(mPlot, dnPlot, title='DownTrend Highligter', color=shortFillColor, transp=90)

// Alerts
alertcondition(buySignal, title='SuperTrend Buy', message='SuperTrend Buy!')
alertcondition(sellSignal, title='SuperTrend Sell', message='SuperTrend Sell!')
changeCond = trend != trend[1]
alertcondition(changeCond, title='SuperTrend Direction Change', message='SuperTrend has changed direction!')

// Pip and trailing stop calculation
pips = 50
pipValue = syminfo.mintick * pips
trailingPips = 10
trailingValue = syminfo.mintick * trailingPips

// Strategy
if (buySignal)
    strategy.entry("Long", strategy.long, stop=dn, comment="SuperTrend Buy")
if (sellSignal)
    strategy.entry("Short", strategy.short, stop=up, comment="SuperTrend Sell")

// Take profit on trend change
if (changeCond and trend == -1)
    strategy.close("Long", comment="SuperTrend Direction Change")
if (changeCond and trend == 1)
    strategy.close("Short", comment="SuperTrend Direction Change")

// Initial Stop Loss
longStopLevel = up - pipValue
shortStopLevel = dn + pipValue

// Trailing Stop Loss
var float longTrailStop = na
var float shortTrailStop = na

if (strategy.opentrades > 0)
    if (strategy.position_size > 0)  // Long position
        if (longTrailStop == na or close > strategy.position_avg_price + trailingValue)
            longTrailStop := high - trailingValue
        strategy.exit("Stop Loss Long", from_entry="Long", stop=longTrailStop)
    if (strategy.position_size < 0)  // Short position
        if (shortTrailStop == na or close < strategy.position_avg_price - trailingValue)
            shortTrailStop := low + trailingValue
        strategy.exit("Stop Loss Short", from_entry="Short", stop=shortTrailStop)

// Initial Exit
strategy.exit("Initial Stop Loss Long", from_entry="Long", stop=longStopLevel)
strategy.exit("Initial Stop Loss Short", from_entry="Short", stop=shortStopLevel)