ٹرینڈ فلٹرڈ پن بار کو تبدیل کرنے کی حکمت عملی

جائزہ
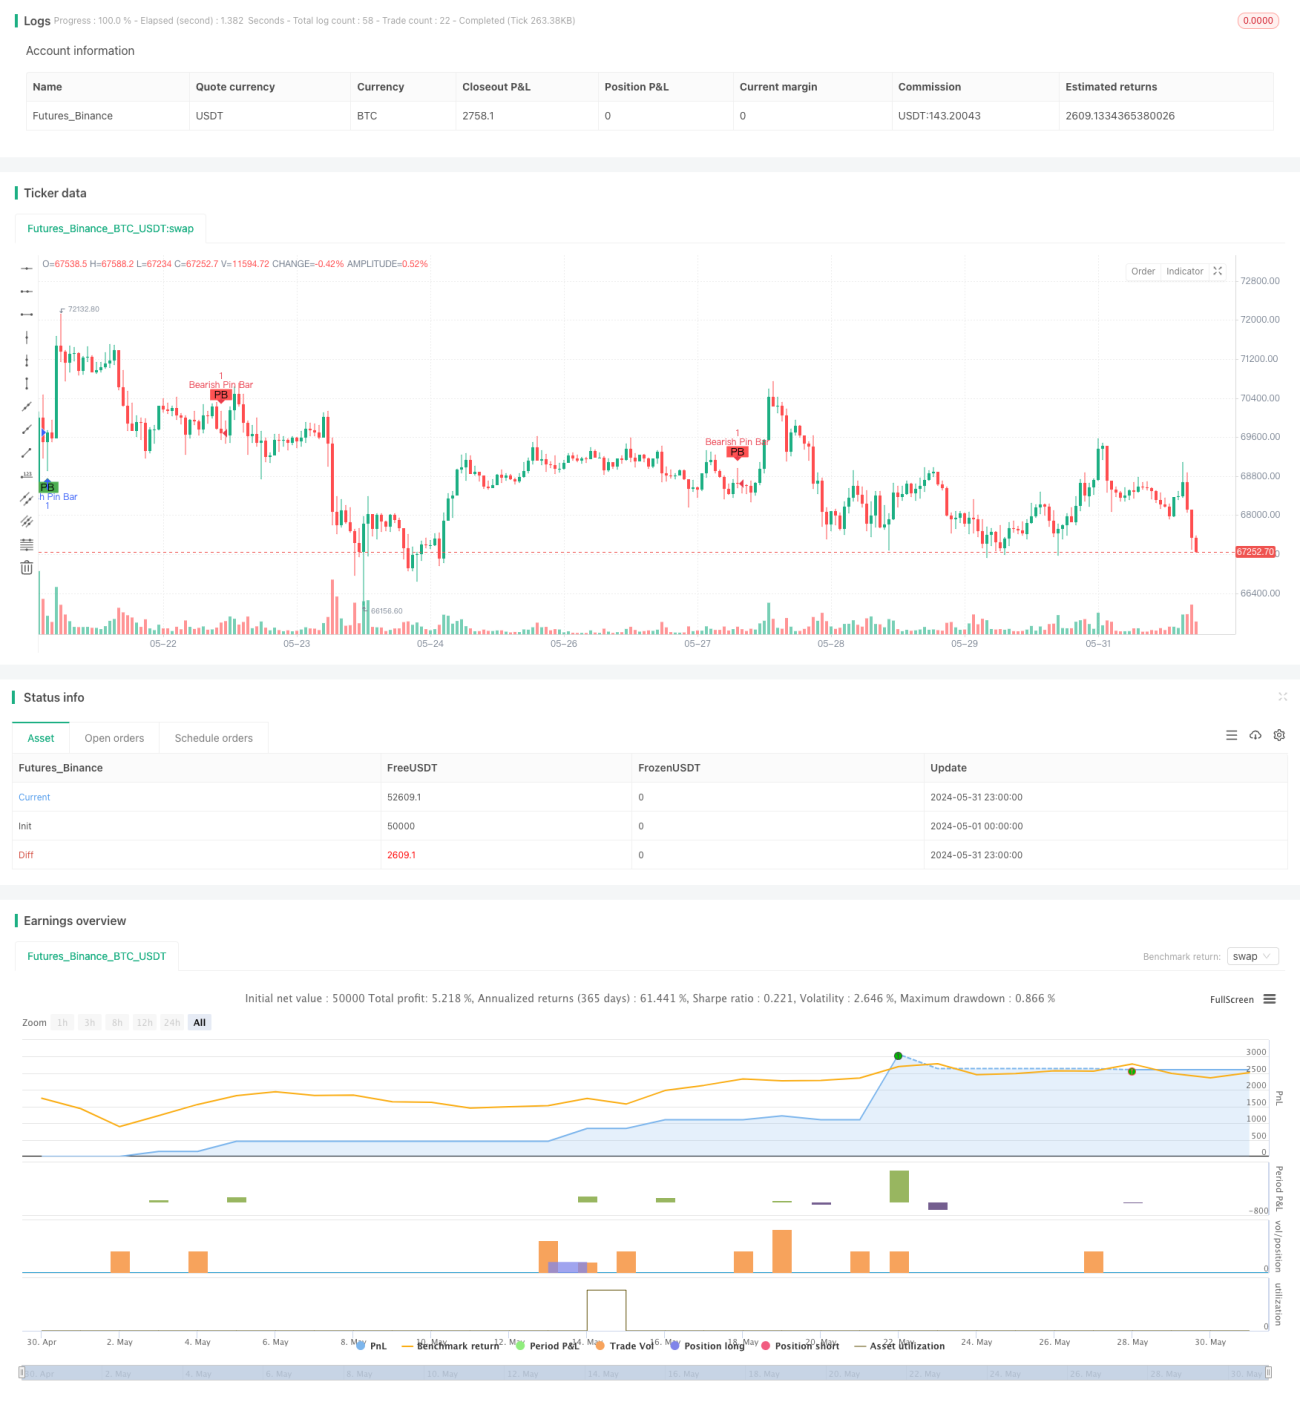
یہ حکمت عملی بنیادی طور پر ایک مخصوص K لائن کی شکل کی نشاندہی کرکے مارکیٹ کے ممکنہ الٹ پوائنٹس کا فیصلہ کرتی ہے۔ پن بار ایک K لائن کی شکل ہے جس میں لمبی سائے کی لائن اور چھوٹی ہستی شامل ہوتی ہے ، جس سے یہ ظاہر ہوتا ہے کہ مارکیٹ میں اس مقام پر زیادہ اتار چڑھاؤ ہوا ہے ، لیکن آخر میں قیمت پیچھے ہٹ گئی ہے ، جس سے یہ ظاہر ہوتا ہے کہ یہ مقام معاون یا مزاحمتی مقام ہوسکتا ہے۔ یہ حکمت عملی موجودہ رجحان کی سمت کا فیصلہ کرنے کے لئے 50 سیکنڈ کی سادہ حرکت پذیری اوسط ((SMA) کا استعمال کرتی ہے ، اور 20 سیکنڈ کی SMA کو حجم فلٹرنگ کی شرط کے طور پر استعمال کرتی ہے ، اور صرف اس اوسط لائن سے زیادہ تجارت کو ایک مؤثر سگنل سمجھا جاتا ہے جب پن بار ظاہر ہوتا ہے۔ اس کے علاوہ ، یہ حکمت عملی نسبتا strong مضبوط کمزور اشارے ((RSI) کا بھی حساب لگاتی ہے ، لیکن براہ راست انٹری اور آؤٹ شرائط میں استعمال نہیں ہوتی ہے ، بلکہ اس کے بجائے مزید قابل عمل سگنل کی شرط کے طور پر منتخب کیا جاتا ہے۔
حکمت عملی کا اصول
- سب سے پہلے ، پن بار کی اوپر اور نیچے کی سائے کی لکیر اور ہستی کے متعلقہ سائز کا اندازہ لگائیں ، جس میں یہ ضروری ہے کہ اوپر کی سائے یا نیچے کی سائے کی لکیر کم از کم 60٪ پوری K لائن کی اونچائی اور نچلی حد کی حد ہو ، جبکہ ہستی کا حصہ 30٪ سے زیادہ نہیں ہوسکتا ہے۔
- پن بار کی قیمتوں کا موازنہ بند ہونے والی قیمتوں اور کھلنے والی قیمتوں کے سائز کے مقابلے میں کیا جاتا ہے۔
- موجودہ رجحان کا تعین کرنے کے لئے 50 سائیکل ایس ایم اے کا استعمال کریں ، جب قیمت ایس ایم اے کے اوپر ختم ہوجائے تو اسے اوپر کی طرف بڑھنے کا رجحان سمجھا جاتا ہے ، اور اس کے برعکس ، اس کا رجحان نیچے کی طرف ہے۔
- 20 سائیکل ٹرانزیکشن حجم ایس ایم اے کو ٹریڈ حجم فلٹرنگ کی شرط کے طور پر استعمال کرتے ہوئے ، صرف اس وقت ٹرانزیکشن کا حجم اس قدر سے زیادہ ہوتا ہے جب پن بار کو نافذ کیا جاتا ہے تو اسے ایک موثر سگنل سمجھا جاتا ہے۔
- شناخت شدہ بیج اور بیج پین بار کو ڈرائنگ کریں۔
- جب پن بار نظر آتا ہے تو ایک سے زیادہ پوزیشن کھولیں ، جب پن بار نظر آتا ہے تو خالی پوزیشن کھولیں۔
- اسٹاپ نقصان کی ترتیب پن بار کے جسمانی سائز کا 2 گنا ہے ، اور اسٹاپ کی ترتیب 3 گنا ہے۔ کثیر سر اسٹاپ پن بار کے نچلے حصے کے نیچے ہے ، اور اسٹاپ سب سے اوپر ہے۔ خالی سر اس کے برعکس ہے۔
طاقت کا تجزیہ
- پن بار ایک بہت ہی بدیہی اور موثر قیمت کی تبدیلی کی شکل ہے جو مارکیٹ کے جذبات کی تبدیلی کو زیادہ درست طریقے سے پکڑ سکتی ہے۔
- رجحان فلٹرنگ کی شرائط پن بار سگنل کو موجودہ رجحان کی سمت سے مطابقت پذیر رکھنے کی ضمانت دیتی ہیں ، جس سے سگنل کی کامیابی میں بہتری آتی ہے۔
- حجم کی شرائط مارکیٹ کے شور کو فلٹر کرتی ہیں جس کی وجہ سے لیکویڈیٹی کی کمی ہوتی ہے اور اس بات کو یقینی بناتی ہے کہ پن بار سگنل میں مارکیٹ کی کافی شرکت ہو۔
- سٹاپ نقصان اور اسٹاپ پوزیشن کی ترتیب پن بار کی اپنی خصوصیات پر مبنی ہے ، جس میں منافع کے مقابلے میں زیادہ خطرہ ہوتا ہے۔
- کوڈ کی منطق اور قواعد واضح ہیں، سمجھنے اور لاگو کرنے میں آسان ہیں۔
خطرے کا تجزیہ
- پن بار کے اشارے کی وشوسنییتا کو ایک ہلکا پھلکا مارکیٹ میں بہت زیادہ نقصان پہنچایا جاتا ہے، جب رجحان فلٹرنگ کا کوئی اثر نہیں ہوتا.
- ٹیلنٹیا یا لڈو کے واقعات میں پن بار بھی غیر فعال ہوسکتی ہے۔
- اس کے علاوہ ، یہ بھی کہا گیا ہے کہ اس کے نتیجے میں ، اس کی واپسی کے نمونے بہت کم ہوسکتے ہیں۔
- مخصوص نسلوں اور ادوار کے لئے، پہلے سے طے شدہ پیرامیٹرز کو مزید بہتر بنانے کی ضرورت ہوسکتی ہے.
- سنگل سگنل سسٹم مجموعی طور پر زیادہ خطرہ ہے۔
اصلاح کی سمت
- سگنل کے ذرائع کو فروغ دینے کے لئے اندرونی بار جیسے دیگر ریورس شکلوں کو متعارف کرانے پر غور کیا جاسکتا ہے۔
- اسٹاپ نقصان اور اسٹاپ کی پوزیشنوں کو متحرک طور پر مارکیٹ کی مختلف حالتوں کو ایڈجسٹ کرنے کے لئے اے ٹی آر جیسے اتار چڑھاؤ کے اشارے کے ساتھ ایڈجسٹ کیا جاسکتا ہے۔
- اس کے علاوہ، آپ کو ایک فی صد ٹریکنگ سٹاپ نقصان کے ساتھ ایک ڈیلٹا ڈال کر سکتے ہیں.
- مزید بنیادی اعداد و شمار جیسے معاشی کیلنڈر اور اہم واقعات کو شامل کیا جاسکتا ہے تاکہ سگنل کو فلٹر کیا جاسکے جو غیر موثر ہوسکتے ہیں۔
- فنڈ مینجمنٹ ماڈیولز کو متعارف کرانے پر غور کریں تاکہ ہر ٹرانزیکشن کے خطرے کو کنٹرول کیا جاسکے۔
خلاصہ کریں۔
پن بار الٹ حکمت عملی نے سادہ اور موثر سوچ کو اپنایا ہے ، جس نے رجحان فلٹرنگ ، حجم فلٹرنگ اور اسی طرح کے طریقوں سے سگنل کی شناخت کی درستگی کو بہتر بنایا ہے۔ اگرچہ ابھی کچھ جگہیں ہیں جہاں بہتری آسکتی ہے ، لیکن مجموعی طور پر یہ سوچ قابل عمل ہے اور مزید اصلاحی جانچ کے قابل ہے۔ پن بار خود ایک کلاسک قیمت کی شکل کے طور پر ، دوسرے اشارے یا سگنل کے ساتھ مل کر بھی استعمال کیا جاسکتا ہے ، تاکہ ایک زیادہ مستحکم تجارتی نظام حاصل کیا جاسکے۔
- 1