RSI رجحان کی حکمت عملی

1
Follow
1780
Followers
جائزہ
اس حکمت عملی میں خرید و فروخت کے اشارے طے کیے جاتے ہیں کہ آیا آر ایس آئی اشارے کی قدر پہلے سے طے شدہ اوپر اور نیچے کی حد سے زیادہ ہے یا نہیں۔ اس کے علاوہ ، اس حکمت عملی میں خطرے کو کنٹرول کرنے کے لئے اسٹاپ نقصان اور پوزیشن رکھنے کی مدت کی حد بھی رکھی گئی ہے۔
حکمت عملی کا اصول
- RSI اشارے کی قیمت کا حساب لگائیں
- جب RSI کی قیمت پہلے سے طے شدہ خرید کی حد سے کم ہو تو خریدنے کا اشارہ پیدا ہوتا ہے۔ جب RSI کی قیمت پہلے سے طے شدہ فروخت کی حد سے زیادہ ہو تو فروخت کا اشارہ پیدا ہوتا ہے۔
- خریدنے کے سگنل کے مطابق ، موجودہ اختتامی قیمت پر خریدنے کی مقدار کا حساب لگائیں ، اور خریدنے کا حکم دیں۔
- اگر اسٹاپ نقصان کا تناسب مقرر کیا گیا ہے تو ، اسٹاپ نقصان کی قیمت کا حساب لگائیں اور اسٹاپ نقصان کا آرڈر دیں
- فروخت سگنل یا سٹاپ نقصان کی شرائط کے مطابق ، تمام پوزیشنوں کو فلیٹ کریں۔
- اگر زیادہ سے زیادہ پوزیشن رکھنے کا وقت مقرر کیا گیا ہے تو ، پوزیشن رکھنے کے وقت سے زیادہ پوزیشن رکھنے کے وقت کے بعد ، تمام پوزیشنوں کو برابر کردیا جائے گا ، چاہے اس میں کوئی نقصان ہو۔
اسٹریٹجک فوائد
- آر ایس آئی ایک وسیع پیمانے پر استعمال ہونے والا تکنیکی تجزیہ اشارے ہے جو مارکیٹ میں اوورلو اور اوور سیل سگنل کو مؤثر طریقے سے پکڑ سکتا ہے۔
- اس حکمت عملی نے خطرے کو کنٹرول کرنے میں مدد کے لئے اسٹاپ نقصان اور پوزیشن کی مدت کی حدود متعارف کروائی ہیں۔
- حکمت عملی کی منطق واضح ہے، سمجھنے اور لاگو کرنے میں آسان ہے۔
- مختلف مارکیٹ کے حالات کو ایڈجسٹ کرنے کے لئے RSI کے پیرامیٹرز اور حدود کو ایڈجسٹ کریں.
اسٹریٹجک رسک
- RSI اشارے بعض حالات میں غلط سگنل دے سکتے ہیں جس کی وجہ سے حکمت عملی میں نقصان ہوتا ہے۔
- اس حکمت عملی میں تجارتی اقسام کے بنیادی عوامل کو مدنظر نہیں رکھا گیا ہے اور صرف تکنیکی اشارے پر انحصار کیا گیا ہے ، جس سے مارکیٹ میں اچانک واقعات کا خطرہ لاحق ہوسکتا ہے۔
- فکسڈ اسٹاپ نقصان کا تناسب مارکیٹ میں اتار چڑھاؤ کی تبدیلیوں کے لئے موزوں نہیں ہوسکتا ہے۔
- حکمت عملی کی کارکردگی پیرامیٹرز کی ترتیب سے متاثر ہوسکتی ہے ، اور نامناسب پیرامیٹرز حکمت عملی کی خراب کارکردگی کا سبب بن سکتے ہیں۔
حکمت عملی کی اصلاح کی سمت
- حکمت عملی کی وشوسنییتا کو بہتر بنانے کے لئے دیگر تکنیکی اشارے جیسے کہ چلتی اوسط متعارف کروائیں۔
- آپٹمائزڈ سٹاپ اسٹریٹجیز جیسے کہ موبل سٹاپ یا متحرک سٹاپ جو لہر پر مبنی ہو۔
- آر ایس آئی کے پیرامیٹرز اور قیمتوں کو مارکیٹ کے حالات کے مطابق متحرک طور پر ایڈجسٹ کیا جاتا ہے۔
- حکمت عملی کے خطرے کو کنٹرول کرنے کی صلاحیت کو بہتر بنانے کے لئے تجارت کی قسم کے بنیادی تجزیہ کے ساتھ مل کر.
- بہترین پیرامیٹرز کا مجموعہ تلاش کرنے کے لئے حکمت عملی کی جانچ اور پیرامیٹرز کی اصلاح کریں۔
خلاصہ کریں۔
اس حکمت عملی میں مارکیٹ کے اوورلوڈ اور اوور سیل سگنل کو پکڑنے کے لئے آر ایس آئی اشارے کا استعمال کیا جاتا ہے ، جبکہ اسٹریٹجک منطق سادہ ہے ، اس پر عمل درآمد اور اصلاح کرنا آسان ہے۔ تاہم ، حکمت عملی کی کارکردگی مارکیٹ میں اتار چڑھاؤ اور پیرامیٹرز کی ترتیب سے متاثر ہوسکتی ہے ، لہذا حکمت عملی کی استحکام اور منافع بخش صلاحیت کو بڑھانے کے لئے دیگر تجزیاتی طریقوں اور رسک مینجمنٹ کے ساتھ مل کر ضرورت ہے۔
Source
Pine
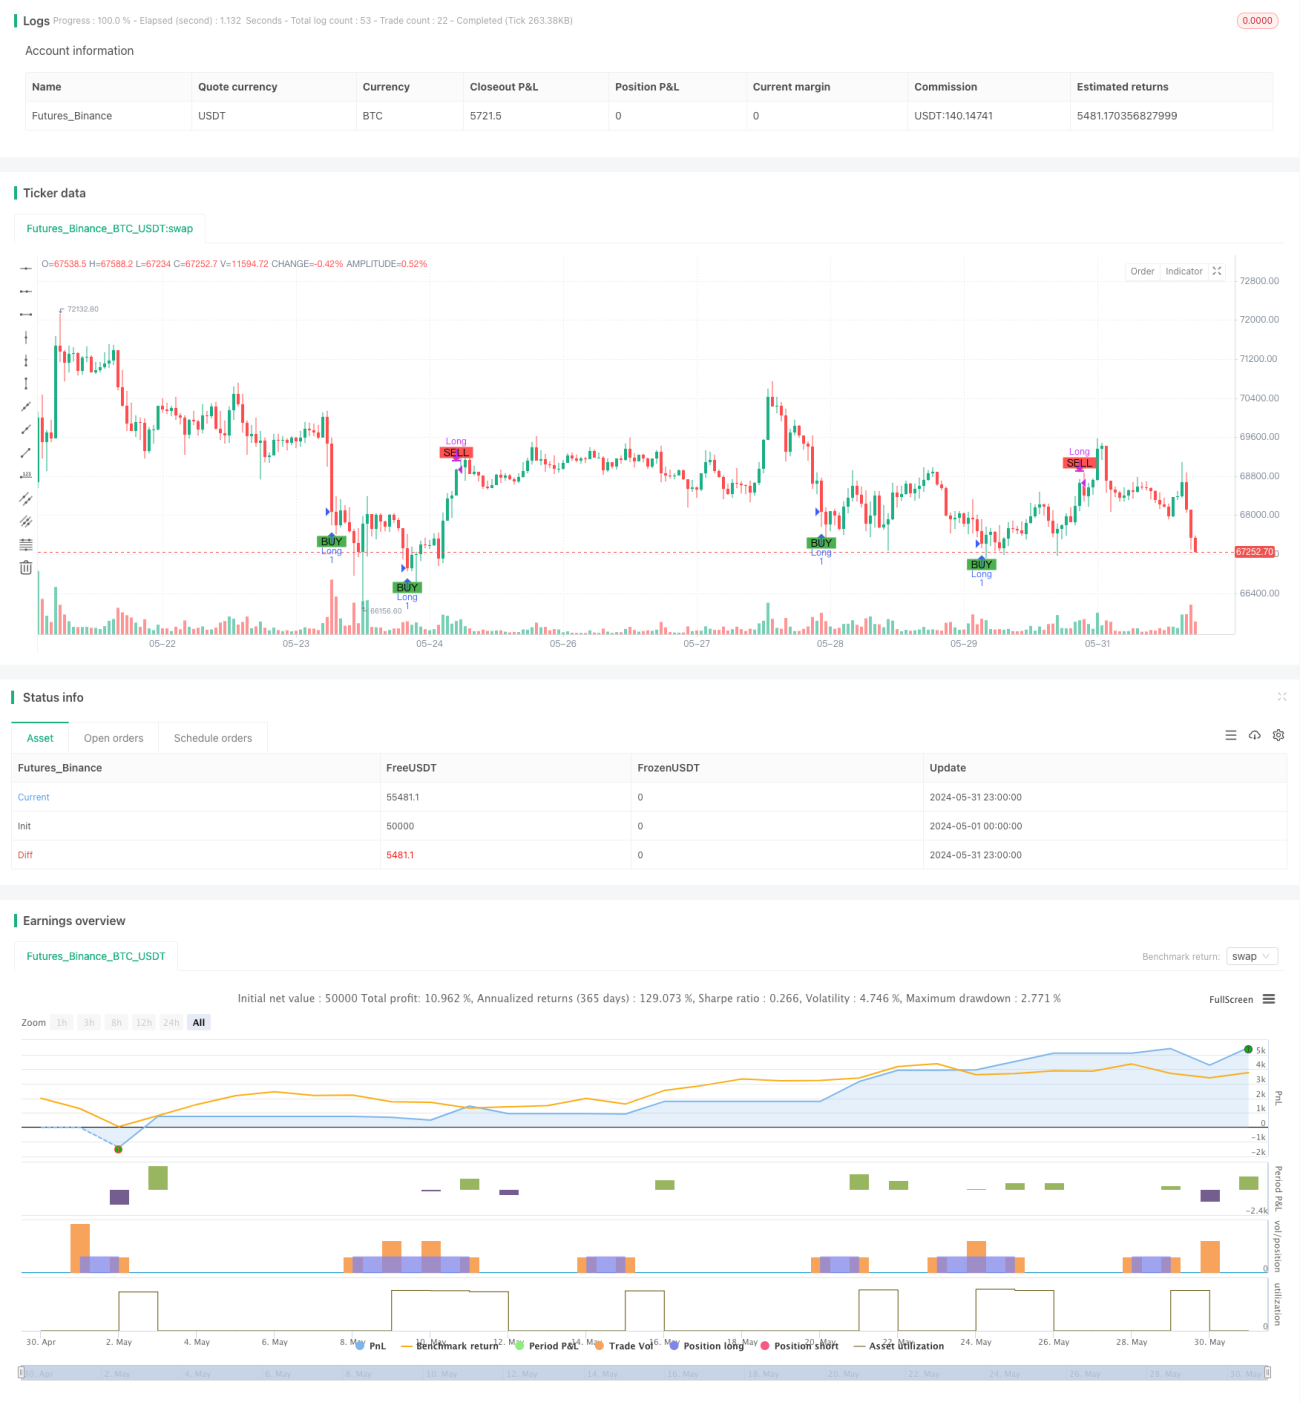
/*backtest
start: 2024-05-01 00:00:00
end: 2024-05-31 23:59:59
period: 1h
basePeriod: 15m
exchanges: [{"eid":"Futures_Binance","currency":"BTC_USDT"}]
*/

//@version=5
strategy("Simple RSI Strategy", overlay=true,  initial_capital=20, commission_value=0.1, commission_type=strategy.commission.percent)

// Define the hardcoded date (Year, Month, Day, Hour, Minute)Strategy parameters
Related strategies
Comment
All comments (0)
No data
- 1