G Trend EMA ATR سمارٹ ٹریڈنگ حکمت عملی

جائزہ
یہ حکمت عملی G چینل اشارے کا استعمال کرتے ہوئے مارکیٹ کے رجحان کی سمت کی شناخت کے لئے ، جبکہ EMA اور ATR اشارے کے ساتھ مل کر داخلے اور باہر نکلنے کے مقامات کو بہتر بنانے کے لئے استعمال کرتی ہے۔ حکمت عملی کا بنیادی نظریہ یہ ہے کہ: جب قیمت G چینل کو توڑنے اور EMA کے نچلے حصے پر زیادہ کام کرتی ہے تو ، G چینل کو توڑنے اور EMA کے اوپری حصے پر خالی ہوجاتی ہے۔ اس کے ساتھ ہی ، ATR کا استعمال کرتے ہوئے متحرک اسٹاپ اور اسٹاپ پوزیشن قائم کی جاتی ہے ، جس میں اسٹاپ نقصان 2xATR ہے اور اسٹاپ پوزیشن 4xATR ہے۔ اس طرح سے رجحان کی صورت حال میں زیادہ منافع حاصل کیا جاسکتا ہے ، جبکہ خطرے کو سختی سے کنٹرول کیا جاسکتا ہے۔
حکمت عملی کا اصول
- G چینل کے اوپر اور نیچے کی ٹریک کا حساب لگائیں: موجودہ اختتامی قیمت اور اس سے پہلے کی اعلی ترین قیمت کی کم سے کم قیمت کا استعمال کرتے ہوئے G چینل کے اوپر اور نیچے کی ٹریک کا حساب لگائیں۔
- رجحان کی سمت کا تعین کریں: قیمتوں اور جی چینل کے اوپر اور نیچے کے تعلقات کو دیکھ کر فاریکس ٹریڈنگ کے لئے بہترین ٹولز کا تعین کریں۔
- EMA کا حساب لگائیں: مخصوص دورانیے کے EMA کی قدر کا حساب لگائیں۔
- اے ٹی آر کا حساب لگائیں: مخصوص دورانیے کے لئے اے ٹی آر کی قیمت کا حساب لگائیں
- خرید و فروخت کی شرائط کا تعین کریں: جب قیمت G چینل کو ٹریک کرنے اور ای ایم اے سے نیچے ٹریک کرنے پر زیادہ کام کریں اور جب قیمت نیچے ٹریک کرنے اور ای ایم اے سے اوپر ٹریک کرنے پر کام کریں۔
- اسٹاپ نقصان کی حد مقرر کریں: اسٹاپ نقصان کی حد پوزیشن کھولنے کی قیمت - 2 گنا اے ٹی آر ، اسٹاپ نقصان کی حد پوزیشن کھولنے کی قیمت + 4 گنا اے ٹی آر ((کثیر سر)) ؛ اسٹاپ نقصان کی حد پوزیشن کھولنے کی قیمت + 2 گنا اے ٹی آر ، اسٹاپ نقصان کی حد پوزیشن کھولنے کی قیمت - 4 گنا اے ٹی آر ((خالی سر)) ۔
- حکمت عملی کا محرک: خرید و فروخت کے شرائط کو پورا کرنے پر پوزیشن کھولنے کا عمل انجام دیں ، اور اس کے مطابق اسٹاپ نقصان کی روک تھام طے کریں۔
اسٹریٹجک فوائد
- رجحانات کا سراغ لگانا: مارکیٹ کے رجحانات کو مؤثر طریقے سے پکڑنے کے لئے جی چینل کا استعمال کرنے کی حکمت عملی ، جو رجحانات کے مطابق ہے۔
- متحرک اسٹاپ نقصان: اے ٹی آر کا استعمال کرتے ہوئے متحرک طور پر اسٹاپ نقصان کی پوزیشن کو ایڈجسٹ کریں ، تاکہ مارکیٹ میں اتار چڑھاؤ کو بہتر طور پر ڈھال سکیں۔
- خطرے پر قابو پانا: اسٹاپ نقصان کی حد 2x اے ٹی آر پر رکھی گئی ہے ، جس سے ہر تجارت کا خطرہ سختی سے کنٹرول ہوتا ہے۔
- آسان استعمال: حکمت عملی کی منطق واضح ہے اور زیادہ تر سرمایہ کاروں کے لئے موزوں ہے۔
اسٹریٹجک رسک
- ہلچل: ہلچل والے بازاروں میں ، بار بار ٹریڈنگ سگنل نقصانات میں اضافے کا سبب بن سکتے ہیں۔
- پیرامیٹرز کی اصلاح: مختلف اقسام اور ادوار کے لئے مختلف پیرامیٹرز کی ضرورت ہوسکتی ہے ، اور اندھا دھند استعمال سے خطرہ لاحق ہوسکتا ہے۔
- بلیک سوان واقعہ: انتہائی صورت حال میں ، قیمتوں میں شدید اتار چڑھاؤ ہوتا ہے ، جس کی وجہ سے اسٹاپ نقصان کو مؤثر طریقے سے نافذ نہیں کیا جاسکتا ہے۔
حکمت عملی کی اصلاح کی سمت
- رجحان فلٹرنگ: رجحان فلٹرنگ شرائط جیسے ایم اے کراسنگ ، ڈی ایم آئی وغیرہ کو شامل کریں ، اور ہنگامہ خیز حالات میں تجارت کو کم کریں۔
- پیرامیٹرز کو بہتر بنائیں: مختلف اقسام اور ادوار کے لئے پیرامیٹرز کو بہتر بنائیں ، بہترین پیرامیٹرز کا مجموعہ تلاش کریں۔
- پوزیشن مینجمنٹ: مارکیٹ میں اتار چڑھاو کی رفتار کے مطابق پوزیشن کو ایڈجسٹ کریں ، فنڈز کے استعمال میں اضافہ کریں۔
- مجموعہ حکمت عملی: اس حکمت عملی کو دیگر موثر حکمت عملیوں کے ساتھ جوڑ کر استحکام میں اضافہ کریں۔
خلاصہ کریں۔
اس حکمت عملی نے جی چینل ، ای ایم اے ، اے ٹی آر اور دیگر اشارے کے ذریعہ ایک سادہ اور موثر رجحان سے باخبر رہنے کا تجارتی نظام تشکیل دیا ہے۔ یہ رجحان کے حالات میں اچھا اثر ڈال سکتا ہے ، لیکن یہ عام طور پر ہنگامہ خیز حالات میں کارکردگی کا مظاہرہ کرتا ہے۔ اس کے بعد حکمت عملی کو رجحان فلٹرنگ ، پیرامیٹرز کی اصلاح ، پوزیشن مینجمنٹ ، مجموعہ حکمت عملی وغیرہ سے بہتر بنایا جاسکتا ہے ، تاکہ حکمت عملی کی استحکام اور منافع بخش صلاحیت کو مزید بہتر بنایا جاسکے۔
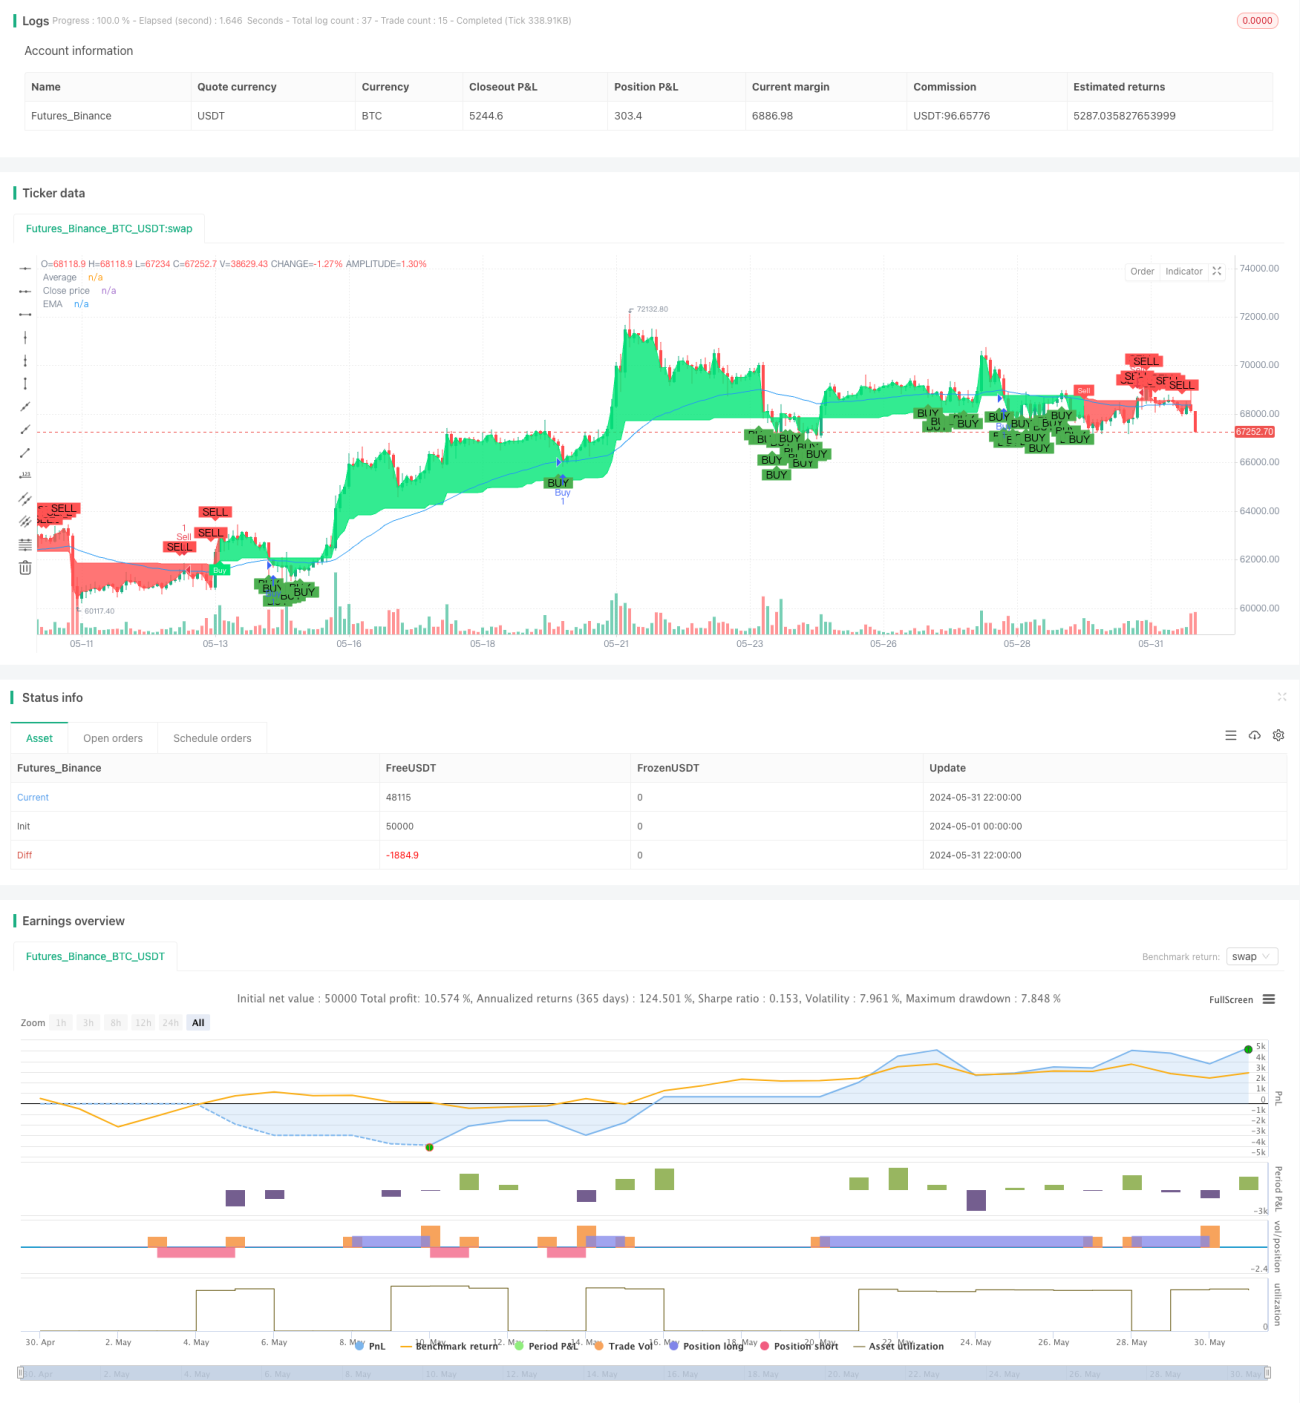
/*backtest
start: 2024-05-01 00:00:00
end: 2024-05-31 23:59:59
period: 2h
basePeriod: 15m
exchanges: [{"eid":"Futures_Binance","currency":"BTC_USDT"}]
*/

//@version=4
// Full credit to AlexGrover: https://www.tradingview.com/script/fIvlS64B-G-Channels-Efficient-Calculation-Of-Upper-Lower-Extremities/
strategy ("G-Channel Trend Detection with EMA Strategy and ATR", shorttitle="G-Trend EMA ATR Strategy", overlay=true)
- 1